Confirmation of SBS 1150+599A As An Extremely Metal-Poor Planetary Nebula
Abstract
SBS 1150+599A is a blue stellar object at high galactic latitude discovered in the Second Byurakan Survey. New high-resolution images of SBS 1150+599A are presented, demonstrating that it is very likely to be an old planetary nebula in the galactic halo, as suggested by Tovmassian et al (2001). An H image taken with the WIYN 3.5-m telescope and its “tip/tilt” module reveals the diameter of the nebula to be , comparable to that estimated from spectra by Tovmassian et al. Lower limits to the central star temperature were derived using the Zanstra hydrogen and helium methods to determine that the star’s effective temperature must be 68,000K and that the nebula is optically thin. New spectra from the MMT and FLWO telescopes are presented, revealing the presence of strong [Ne V] , indicating that the central star temperature must be 100,000K. With the revised diameter, new central star temperature, and an improved central star luminosity, we can constrain photoionization models for the nebula significantly better than before. Because the emission-line data set is sparse, the models are still not conclusive. Nevertheless, we confirm that this nebula is an extremely metal-poor planetary nebula, having a value for O/H that is less than 1/100 solar, and possibly as low as 1/500 solar.
1 Introduction
Planetary Nebulae (PNe) in our galactic halo provide a unique insight into the mechanisms of stellar evolution at low metallicities and old ages. Since many chemical abundances of the progenitor star are not changed during stellar evolution, halo PNe may probe the metallicity of the Galactic halo at the formation epoch of their progenitors (Torres-Peimbert & Peimbert 1979). Because of their rarity, however, only a few halo or Type IV PNe have been discovered (e.g., Howard, Henry, & McCartney 1997), where in contrast, there are over a thousand disk PNe known (e.g., Acker et al. 1992).
In this paper, we report our study of a likely new halo PN: SBS 1150+599A (PN G135.9+55.9). Garnavich & Stanek (1999) obtained a spectrum of SBS 1150+599A (11:53:24.73 +59:39:57.0 J2000) along with 2 other cataclysmic variable (CV) candidates identified in the stellar object list of the Second Byurakan Sky Survey (SBS; Balayan 1997). Of these 3 stars, SBS 1150+599A was uncharacteristic, having narrow emission lines from the Balmer series as well as He II and [Ne V] . Because the object was small and unresolved, Garnavich & Stanek suspected it to be a young PN or symbiotic star. Subsequently, Tovmassian et al. (2001; TSCZGP) obtained a series of spectra of this object to evaluate its nature. They confirmed some of the emission characteristics briefly noted by Garnavich & Stanek (1999) and they attempted to derive a number of astrophysical quantities by modeling the photoionization properties of the nebula. Remarkably, TSCZGP found that the nebula had to be extremely oxygen-poor, despite the relatively few constraints on their models. In fact, the nebula would be the most oxygen-poor PN known by about a factor of 10, implying that it derived from one of the most oxygen-poor stars.
Because this object is so extreme, we wished to verify that it was, in fact, a genuine PN. If it was another class of object (e.g., nova shell, galaxy, cataclysmic variable), then the TSCZGP abundance models would be suspect. If the object was found to be a PN, then we hoped to improve the abundance models by adding additional observational constraints. In Section 2, we describe the high spatial resolution images we obtained with the VATT and WIYN telescopes that confirm the PN hypothesis, as well as additional spectra obtained at the MMT. In Section 3, we derive the properties of the PN. In Sections 4 and 5, we discuss our photoionization model and abundance analysis results.
2 Observations
2.1 Imaging
If SBS 1150+599A has an extended nebula, it must be small on the sky. It must have appeared stellar on the SBS survey, or the nebular nature would have eliminated it from consideration as a CV. SBS 1150+599A appears stellar on the POSS-II images available in the Digital Sky Survey111The Digitized Sky Surveys were produced at the Space Telescope Science Institute under U.S. Government grant NAG W-2166., and was classified as unresolved in the SBS (Bicay et al. 2000). (Note that there is a well-resolved galaxy about 2’ north referred to as SBS 1150+599B.) Based on the extent of the spectral lines along the slit of their spectra, TSCZGP estimated the diameter of the nebula to be . Unless the seeing was very good and the spectrograph imaged very well, this extent was likely to be an overestimate. A direct image taken in good seeing conditions would clarify the nature of the object further, and would provide a direct measurement of the nebula diameter.
The nebula diameter serves us in two ways. First, it is an important parameter in estimating the distance to the PN. The Shklovsky method (Shklovsky 1956), while notoriously inaccurate, is still a competitive tool for measuring distances to random PNe, especially when the observational data are few. Second, the diameter provides an upper limit to the radius of integration for the photoionization models, essentially constraining the mass of the PN.
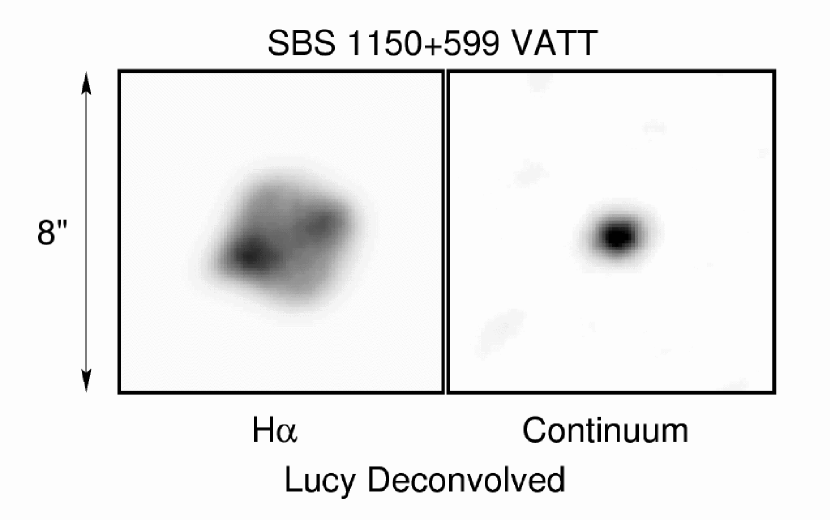
We first imaged SBS 1150+599A at the Vatican Advanced Technology Telescope (VATT) in March 2001. The H image showed an extended object, but with a seeing disk of (FWHM), the object diameter could not be measured accurately. A continuum image taken at 6670 Å demonstrated that a stellar component existed that was surrounded by an H nebulosity. Figure 1 illustrates the VATT images, after being deconvolved using the Lucy-Richardson algorithm.
More recently, we imaged SBS 1150+599A at the WIYN 3.5-m telescope on Kitt Peak on UT 02 April 2002. A series of 4 exposures were co-added, totaling 20 minutes of integration through a narrow-band filter (FWHM of 71 Å) centered on H. The filter bandpass includes the [N II] lines at , but the spectra indicate that any contribution from nitrogen emission is small enough to be ignored. Thus, the entire flux from the nebula can be considered H emission, plus some contribution from ionized helium (see Section 4).
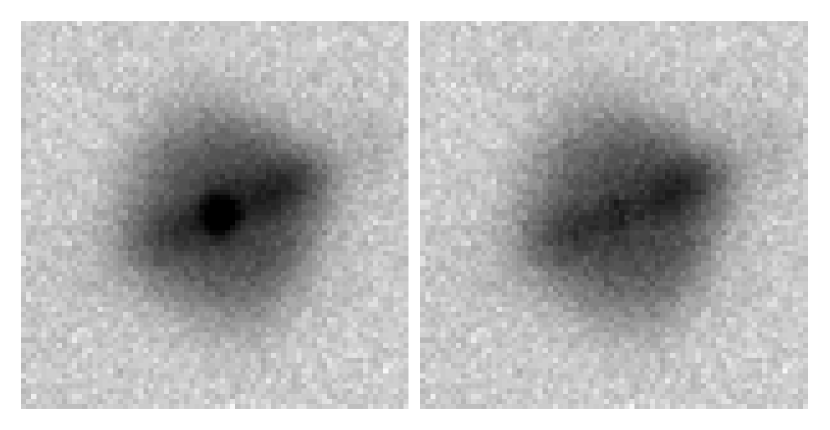
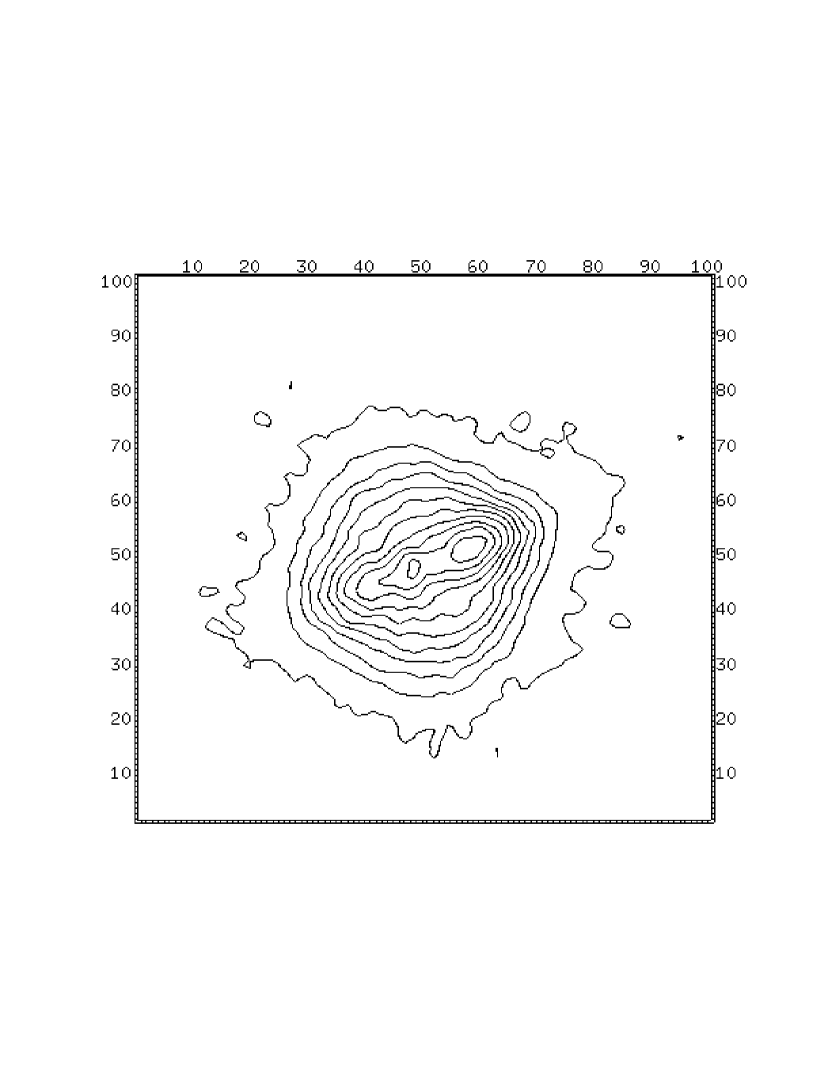
The WIYN images were obtained with the WIYN Tip-Tilt Module (WTTM) that compensates for image motion arising from telescope shake, guider errors, and atmospheric effects (Claver et al. 2002). The central star of SBS 1150+599A was used as the guide star, with corrections for image motion being applied at a rate of 200 Hz. The resulting images have a FWHM of 053, allowing a clean separation of the central star from the nebula, an accurate determination of the PN diameter, and illustrating that the PN has definite structure that departs from a simple sphere or shell. Figure 2 shows the WIYN image of the PN, both the original and with the central star subtracted away using several of the field stars as a guide to the point-spread function (see Section 3). Figure 3 shows the same image as Figure 2 (right), but as a contour map to illustrate the morphology of the faint outer parts of the nebula.
With the fine scale (/pixel) and good seeing of the WTTM imager, we are able to measure angular scales quite accurately. Unfortunately, there is no evident edge to the nebula; it simply fades into the sky background at very low surface brightness. Consequently, the diameter is not easily defined. One estimator of the diameter was proposed by Dopita et al. (1996) as the diameter enclosing 85% of the total flux of the nebula. For SBS 1150+599A, this diameter, , is . Clearly, though, the nebula extends well beyond this diameter, and by integrating to 99% of the total enclosed flux, we derive a diameter, , of . While it is unclear what definition of diameter TSCZGP adopted, their value of is comparable to our latter estimate.
Morphologically, SBS 1150+599A is neither a classic shell nor a uniformly filled sphere, but appears almost square (see contour map in Figure 3). If one plots the radial distribution of the emission (Figure 4), the linear fall-off indicates a slowly declining density with radius. In addition, there exists an enhancement that appears somewhat bipolar, perhaps due to a string of “fast low-ionization emission regions”, or FLIERs (Balick et al. 1993). The FLIER interpretation, though, is untenable since SBS 1150+599A has no low ionization species. Superficially, SBS 1150+599A looks like a faint version of the PN J320 (Balick 1987).
2.2 Spectroscopy
A spectrum of SBS 1150+599A was obtained at the MMT on UT 26 January 1998 and a second spectrum was obtained on 26 March 2001. The latter spectrum is shown in Figure 5. Both spectra were obtained using a 1″ slit rotated to the parallactic angle. The exposure times were 900 seconds, and the spectral resolution was Å over most of the wavelength coverage. The spectrum is remarkable in that the principal lines are the recombination lines of the hydrogen and helium. This spectrum, however, extends well into the blue and adds new information beyond that described by TSCZGP – the line of [Ne V] 3426 is extremely strong. It is easily the strongest collisionally excited line, with a corroborating detection of [Ne V] 3346. The more familiar lines of [O III] 5007 and [Ne III] 3868 are extremely weak (see Figure 6).
SBS 1150+599A was also observed on UT 30 May 2000 through a 3″ slit at the Fred L. Whipple Observatory 1.5-m Tillinghast telescope. This last spectrum is not very deep, but it has greater spectrophotometric accuracy than the MMT spectra. In particular, the MMT data suffer from second order contamination in the red that compromises the flux levels there, leading to an underestimate of the H flux and an unphysically small Balmer decrement. The ratio of H/H from the FLWO spectrum is 2.86, which we adopt as the observed value before de-reddening. This line ratio is higher than reported by TSCZGP, who found 2.52 from their spectra. The remaining line ratios relative to H are taken from the deeper MMT data. Since these lines are much bluer than H, they do not suffer from second order effects.
Table 1 lists the emission lines seen in the spectra, their heliocentric radial velocities, and their fluxes relative to H. For the fluxes we list both the observed values (average of the two MMT spectra, except for H, which is taken from the FLWO spectrum), and the values from our model (described in Section 4). The uncertainties in the fluxes of the strong lines are typically 3-5%, and are dominated by the standard star calibrations and the reduction processes. For the faint lines, the uncertainties are dominated by the placement of the continuum. We estimated this uncertainty by measuring the flux assuming a range of plausible continuum values and determining the average and variance in the resulting line flux.
The observed Balmer decrement is shallow, suggesting that the interstellar extinction is small. The observed fluxes listed in Table 1 have been corrected for an adopted , based on the maps of Schlegel, Finkbeiner, & Davis (1998).
We measure the heliocentric radial velocity of SBS 1150+599A to be km-s-1, in good agreement with TSCZGP who report a velocity of km-s-1. Thus, we confirm that the velocity of this PN is consistent with it being part of the Galactic halo population.
3 Nebula and Central Star Parameters
3.1 Central Star Temperature
We must have a reasonably accurate estimate of the central star temperature in order to calculate an oxygen abundance. The temperature becomes a critical parameter because it determines the ionization state for this low density, optically thin, nebula. Without knowing the ionization state, a weak [O III] 5007 flux can be evidence for either a low oxygen abundance, a nebula ionization state in which the oxygen is in states much higher (or lower) than doubly ionized, or some combination of these.
The temperature of the central star of SBS 1150+599A must be high for a variety of reasons. Most importantly, the mere presence of [Ne V] 3426 requires a star of 100,000K or hotter. Similarly, the relative strength of He II to He I requires a central star temperature of at least 80,000K. The continuum visible in our own spectra, and that of TSCZGP is also consistent with a hot central star. In addition, we have identified a soft x-ray source in the ROSAT all-sky survey bright source catalog RASS-BSC (Voges et al. 1999), 1RXS J115327.2+593959, that has a hardness ratio of , and is distant from SBS 1150+599A. If it proves to be associated with the PN central star, it provides further support for a temperature of 100,000K or hotter (Guerrero, Chu, & Gruendl 2000).
We can also derive a lower limit for the stellar temperature using the Zanstra method which depends only on the ratio between the stellar flux and the nebular flux (see, for example, Pottasch 1984). The usual Zanstra relationship between central star magnitude and H flux can be restated for any central star bandpass and any Balmer emission line. We adopt a “red” instrumental magnitude based on the star’s H flux that we relate to a magnitude assuming a hot black body for the star. We also measure the nebula’s H instrumental flux directly and use the observed de-reddened Balmer decrement of 2.81 to transform to H.
The first step is to measure the central star magnitude, a process that is complicated by the presence of the nebula, but simplified if we first subtract the image of the central star. To do this, we used the IRAF version of DAOPHOT (Stetson 1987; Stetson 1992). We created an empirical point-spread-function (PSF) from three bright, uncrowded, stars on the frame. We then fit the inner core of the nebula to the PSF, using the NSTAR task within DAOPHOT. The central star subtracts away well, with minimal residuals, as can be clearly seen in Figure 2.
When a PN is optically thin, ionizing radiation escapes and the derived Zanstra temperature is an underestimate. If one can derive the Zanstra temperature from emission-lines having a range of ionization limits, such as H, He, and He+, one can directly test whether the nebula is optically thin or not. In the thin case, the derived Zanstra temperature increases with ionization levels. For SBS 1150+599A, we can use the He II and H lines to compare our hydrogen Zanstra temperature to that for helium. As noted by Kaler & Jacoby (1989), these two temperatures will be equal in the optically thick case. For this nebula, though, the hydrogen temperature of 25,500 K is unrealistically low. The HeII temperature of 68,600 K is reasonable for a PN central star, but it, too, is very likely to be an underestimate because of the strong emission of [Ne V]. Thus, the central star must be hotter than 68,000 K.
The photoionization models described in Section 4 blend all the above information into a more quantitative formulation. We will show that a reasonable assessment of the central star temperature is K.
3.2 Central Star Luminosity
For a very low density nebula like this one, which is fully ionized throughout, the central star luminosity is not a critical parameter. Nevertheless, it does have secondary impact on the ionization structure of the nebula and helps to constrain the photoionization models if it can be measured.
In our WIYN image, the central star contributes 14.3% of the total flux in the nebula plus star. We adopt the nebular flux from TSCZGP (see Section 3.3). Thus, the stellar flux, integrated over the 71 Å bandpass of the filter, is ergs cm-2 s-1, which is equivalent to . For a hot black body, this corresponds to . A direct measure from the MMT spectrum yields . We will use the average magnitude of 18.25, combined with the distance (see Section 3.4) to derive the absolute magnitude for the star. Correcting for extinction, we adopt .
3.3 Nebular Flux
TSCZGP report the H nebular flux through a 3″ slit (presumably centered on the central star) of ergs cm-2 s-1. After removing the contribution to our image from the central star, we find that a 3″ slit samples 74.5% of the total integrated nebular flux. Thus, the total nebular emission in the H bandpass is ergs cm-2 s-1. Photoionization models indicate that the contribution from HeII to the H and H fluxes is about 5%. Thus, the total H flux is ergs cm-2 s-1 and after correcting for extinction, the H and H fluxes are and ergs cm-2 s-1, respectively.
3.4 Distance
We wish to have a reasonable estimate of the distance to help construct photoionization models that match sensible values for nebular and stellar fluxes, and nebular and stellar masses. Unfortunately, distances for Galactic PNe are rarely accurate. For SBS 1150+599A, we face the usual uncertainties in this field (e.g., Kwok 2000), and must resort to statistical distance techniques.
We start with parameters chosen for the Shklovsky method by TSCZGP in which they derive a distance of 20.4 kpc. We revisit several of these parameters below. That is, we adopt the nebular mass to be 0.2 M☉, the filling factor to be 0.2, and the nebular electron temperature to be 12,000 K. Now, if we use our measured diameter, of , and the H flux listed above, we derive a distance to SBS 1150+599A of 23.6 kpc.
We now apply several corrections. The nebular temperature is an important factor. Without metals to cool the nebula, the electron temperature could be quite high, and may approach 30,000 K. We retain the filling factor at 0.2; although there is no evidence that the nebula is anything but fully filled, the density distribution cannot be uniform (see Figure 4). The filling factor is always uncertain to some degree, but it enters into the distance calculation only very weakly. The nebular mass is probably the most important unknown. If the progenitor star is truly very metal-poor and represents an epoch early in the formation history of the galaxy, the star must have had a main sequence mass less than the Sun. In that case, the nebula is also likely to be very low mass. The most comparable object in the Galaxy is probably the PN in the globular cluster M15 (Ps 1) which has a nebular mass of M☉ (Buell et al 1997). But, adopting the mass of Ps 1 has no other independent justification.
With these corrections, and assuming a nebular mass between 0.05 and 0.3 M☉, we derive a range of Shklovsky distances of 11.5 to 23.5 kpc. The biggest factor in broadening the range of derived distances is the mass of ionized gas, and thus far, we can only assume a value for this parameter. At the smallest distance, though, the central star luminosity drops to the point where its mass becomes 0.54 M☉, a value considered below the threshold for producing a visible PN (Jacoby et al. 1997; Alves, Bond, & Livio 2000).
An alternative and new method for deriving distances to PNe is proposed here based on the surface brightnesses of PNe. In their study of LMC PNe, which are all at the same distance, Stanghellini et al (2002) noted that there exists an excellent correlation between the nebula’s H surface brightness and its linear radius. Because surface brightness is independent of distance, but linear radius depends directly on distance, a correlation between these two parameters can be used to infer the distance from simple measurements of the surface brightness and angular radius. The correlation has a dispersion of % in linear radius, and therefore, if it holds in general, should yield distances that are quite accurate.
For elliptical and round PN, such as SBS 1150+599A, the surface brightness – radius (SBR) relation follows the form:
where is the linear “photometric” radius of the nebula in parsecs, and is the H surface brightness in ergs-cm-2-s-1-arcsec-2. The “photometric” radius corresponds to half of , the diameter enclosing 85% of the total flux of the nebula, and is the total flux divided by . is the angular “photometric” radius in arcsec, which relates in the obvious way to such that the distance, , is . We note that is defined to be the diameter as measured in [O III], but because of the extreme nature of this nebula, we have substituted the diameter as measured at H. This could introduce a systematic error in the distance derivation.
For SBS 1150+599A, Log and . The distance would follow directly, but we must make one adjustment to the correlation identified by Stanghellini et al (2002) before proceeding. Because the LMC PNe used to derive the correlation have relatively normal chemical compositions, their nebular electron temperatures are generally K, whereas SBS 1150+599A is so metal-poor that its electron temperature may be as high as K. The Balmer emission drops with increasing temperature by about 0.25 dex over this range. Consequently, we must raise the measured value of Log to to place this unusual object onto the relationship. Then, we derive that pc. This radius corresponds to a distance of 47.6 kpc. However, this distance is not a comfortable one either, as now the nebular mass must be 2 M☉ to meet the nebular luminosity demand, an unlikely value for an old halo object. It seems likely that SBS 1150+599A is sufficiently bizarre that it does not obey the SBR relation. Note that the SBR relation, though, is only defined for PNe having surface brightnesses a factor of 10 or more larger, and extrapolating below the defined region is not justified.
Consequently, we do not have a reliable distance. Without any other justification than consistency, we simply adopt the Shklovsky distance as modified above, but assuming the commonly used nebular mass of 0.2 M☉. The resulting distance then, is 20.0 kpc. The Galactic latitude of SBS 1150+599A is 56 degrees, and so it is kpc above the Galactic plane. Regardless of the uncertainty in the distance, SBS 1150+599A must be well out of the plane of Milky Way, and is clearly a halo object.
At this adopted distance, the central star has . The central star magnitude serves as an additional observational constraint to be matched by the photoionization model. For a hot (K) black body, this magnitude corresponds to a luminosity of 5000 L☉. In addition, the nebular luminosity at this distance provides another model constraint and is ergs-cm-2-s-1.
4 Photoionization Model
We use the Cloudy photoionization modeling code, as recently released (Version 96 Beta 3; Ferland 2001). We assume the nebula has spherically symmetric geometry and that the central star can be represented as a black body. We have not considered the case of non-spherical geometry because the spherical models already reproduce the constraints adequately, and the true three-dimensional geometry is an unknown that cannot be constrained by the observations.
In modeling the nebula, we start by defining the ionization structure of the nebula that is implied by the flux ratios of the three neon lines. These lines provide the only insight to the ionization structure; no other elemental emission lines are seen arising from more than one ionization stage. Consequently, the weak line of [Ne III] 3868 assumes a very important role. Of the unknown parameters in the model, the ionization structure depends primarily on (1) the central star temperature, (2) the central star luminosity, and (3) the nebular density. We adopt an electron density distribution that yields a linearly falling surface brightness as a function of radius, as suggested by Figure 4, and scale this distribution such that the nebular luminosity is achieved. The absolute magnitude of the central star further constrains these parameters. Unfortunately, the uncertain distance to the nebula enters into these considerations because it affects both the nebular and stellar luminosities.
The remaining unknowns in the model are primarily the abundances, and these are constrained by the observed emission-line ratios relative to H. Fortunately, the abundances have little impact on the nebular luminosity or the ratio of the [Ne V] to [Ne III] lines. This is an important point because we can only derive abundances for the 3 elements producing emission lines: helium, neon, and oxygen. For the other important elements (sulfur, argon, nitrogen, and carbon), we can only derive upper limits beyond which an emission-line would have been seen in our spectra.
With the few lines listed in Table 1, it is not difficult to develop a model that reproduces the constraints and line ratios perfectly. In fact, there are many solutions and our first success yielded a value for O/H that was below the Solar value, and a value for Ne/H that is below Solar. That model, though, was not adjusted to meet the upper limit requirements on elements with unseen emission. Instead, we simply set the abundances of the unseen elements to be consistent with those for typical Galactic PN, but reduced in proportion to the Ne/H measured for SBS 1150+599A. Consequently, the gas electron temperature of this model was very high at 23,700K. At this temperature, very little oxygen is needed to produce the observed strength of [O III] . We could also have adopted an abundance set that is in accord with O/H instead of Ne/H, and the electron temperature would have exceeded 30,000K and O/H would have been more than smaller than Solar.
Our final model, which is probably the most conservative, is summarized in Table 2. It is based on the maximum values for S/H, Ar/H, N/H, and C/H that can be accommodated before emission from these elements would be seen in our spectra. Because this model contains the maximum number of coolants, the electron temperature is reduced to 17,600K. At this lower temperature, the value for O/H must be increased to smaller than Solar in order to match the strength of [O III] .
We caution the reader on two crucial points. First, photoionization models based on the few lines that we can observe in SBS 1150+599A are not unique. Our derived abundances for oxygen and neon can vary by factors of a few while matching the observed constraints perfectly. Secondly, we reproduced the models to meet the observational data, which itself, is uncertain. As evidence of this point, note the values in Table 1 for the fainter Balmer lines. The observed values for H, H and H are systematically smaller than the models or theory predict. The measurements of the data are reliable, but the data may be systematically too faint towards the blue. A systematic error of this kind, though, is in conflict with the good agreement seen between the observed stellar continuum and that expected from a hot star.
Nevertheless, because the ionization structure of our models depends strongly on the weak line of [Ne III] , we ran an experimental model in which the intensity of this critical line was reduced by half. The ionization structure can now be matched by increasing the central star effective temperature to 107,000K. The most significant changes that follow are (1) the neon abundance is reduced by 45%, and (2) the oxygen abundance is increased by 31% to below the Solar value. Consequently, the Ne/O ratio drops from 4.3 in our baseline model to 2.3 in the low- model. We consider these deviations as indicative of the degree of uncertainty in the analysis.
As a final note, the models indicate that the Balmer line measurements are contaminated by their neighboring He++ lines by about 5%. This effect was taken into account in the luminosity and the line ratio measurements adopted throughout.
5 Discussion
This study was motivated by the apparently very low oxygen abundance in the nebula as first reported by TSCZGP. If correct, the object is unique and warrants verification. In fact, we confirm the suspicion that SBS 1150+599A is an extremely metal-poor PN, having an oxygen abundance at least 100 smaller than that of the Sun. We can build models that lead to an oxygen abundance as low as 500 smaller than that of the Sun, as suggested by TSCZGP, but we favor the less extreme situation. Still, SBS 1150+599A appears likely to have a lower O/H than any other PN currently known, being a factor of lower than Ps 1 in the globular cluster M15 (Howard et al 1997).
Is the progenitor of SBS 1150+599A consistent with being an old metal-poor star? Assuming that the very low O/H of the nebula provides an indication of the progenitor star’s Fe/H, then the implication is that SBS 1150+599A did descend from a very low metallicity star. Its chemcial composition would be more consistent with that of an old globular cluster or halo star than the usual intermediate age thick disk population with which PNe are usually associated.
As a further test of the origin of this PN, we derive the mass of the central star by interpolating into the evolutionary tracks of Blöcker (1995) using our derived effective temperature and luminosity. The central star mass of 0.61 M☉, when combined with a nebular mass of 0.2 M☉, yields an initial system mass of 0.8 M☉. While this value is consistent with an old progenitor, the age, and the stellar and nebular masses are all dependent on a very uncertain distance. Furthermore, the central star mass is far too high to have originated from a low-mass progenitor under any reasonable initial-to-final mass relationship (Weidemann 2001). Unless the distance is too long by a factor of 2 or more, the progenitor of SBS 1150+599A must have been a single star with a zero-age mass of 1.3 M☉. Alternatively, the progenitor could have formed from a coalesced binary pair (Jacoby et al. 1997; Alves et al. 2000). Only the latter possibility is consistent with a very old star originating in the Galactic halo.
SBS 1150+599A is also likely to be an old, evolved PN. With a linear diameter of 0.87 pc, and assuming an expansion velocity of 20 km-s-1, the expansion age of this PN is 21,000 yrs.
Perhaps the most intriguing results are those for the abundances of neon and oxygen. The value of Ne/O that we find is 4.3. Typical Galactic PN have values of 0.26, and there is generally a very tight relationship between Ne/H and O/H (Henry 1989) that this object strongly violates. While Henry (1989) did not have any objects in his sample with O/H as low as in SBS 1150+599A, he did note that BoBn 1, also a halo PN, had an anomalously large value of Ne/O. Howard et al (1997) find that Ne/O for BoBn 1 is 0.8.
BoBn 1 also has a high N/O ratio (1.5). We have only an upper limit for N/H, and the value is very high, leading to the relation that N/O 52. While very likely to be a valid statement, this inequality carries little weight. A real measure of a nitrogen line would be extremely valuable, and this measurement is feasible in the UV. With these very high N/H abundances, the UV lines of [N V] and [N IV] are predicted to be stronger than H.
6 Conclusions
We have developed a fairly consistent picture in which SBS 1150+599A is an old PN derived from a progenitor in the Galactic halo. The central star must be K and the nebula must be very oxygen-poor.
The picture, though, is not completely satisfying because the observational data are so limited. Future studies should include UV observations; that region of the spectrum is likely to pay the most dividends in constraining the abundances for carbon and nitrogen. These elements control the cooling rate of the nebula, and thus, the abundance of oxygen cannot be measured accurately until that rate is determined. Alternatively, one can attempt to measure the electron temperature directly from the line ratio of [O III] to , but doing so would be a difficult observation due to the low fluxes of these lines.
Nevertheless, the evidence is very strong that SBS 1150+599A is extremely underabundant in oxygen, and possibly is the PN with the lowest oxygen abundance. There is some chance that oxygen has somehow been transformed to neon within the progenitor star, thereby explaining the very high Ne/O and N/O ratios. That scenario has been proposed by Howard et al (1997) for the anomalous halo PN BoBn 1. If so, then the composition of this PN no longer represents the original composition of its progenitor star, and the abundances measured in SBS 1150+599A become more valuable for studying stellar physics than for studying Galactic chemical history. More observational study of this unique object is clearly warranted.
References
- (1)
- (2) Acker, A., Marcout, J., Ochsenbein, F., Stenholm, B., & Tylenda, R. 1992, Garching: European Southern Observatory
- (3) Alves, D.R., Bond, H.E., & Livio, M. 2000, AJ, 120, 2044
- (4) Balayan, S.K. 1997, Afz, 40, 101
- (5) Balick, B. 1987, AJ, 94, 671
- (6) Balick, B., Rugers, M., Terzian, Y., & Chengalur, J.N. 1993, ApJ, 411, 778
- (7) Bicay, M. D., Stepanian, J. A., Chavushyan, V. H., Erastova, L. K., Ayvazyan, V. T., Seal, J., & Kojoian, G. 2000, A&AS, 147, 169
- (8) Blöcker, T. 1995, A&A, 299, 755
- (9) Buell, J.F., Henry, R.B.C., Baron, E., & Kwitter, K.B. 1997, ApJ, 483, 837
- (10) Claver, C.F. et al 2002, SPIE, in press
- (11) Clegg, R.E.S. 1992, in IAU Symp. 155, Planetary Nebulae, ed. R. Weinberger & A. Acker (Dordrecht: Kluwer), 549
- (12) Dopita, M.A., Vassiliadis, E., Meatheringham, S.J., Bohlin, R.C., Ford, H.C., Harrington, J.P., Wood, P.R., Stecher, T.P., & Maran, S.P. 1996, ApJ, 460, 320
- (13) Ferland, G.J., 2001, Hazy, a brief introduction to Cloudy 96.00
- (14) Garnavich, P.M., & Stanek, K.Z. 1999, JAAVSO, 27, 79
- (15) Grevesse, N., & Anders, E. 1989, in AIP Conf. Proc. 183, Cosmic Abundances of Matter (New York: AIP), 1
- (16) Grevesse, N., Lambert, D.L., Suval, A.J., Van Dishoeck, E.F., Farmer, C.B., & Norton, R.H. 1990, A&A, 232, 225
- (17) Grevesse, N., Lambert, D.L., Suval, A.J., Van Dishoeck, E.F., Farmer, C.B., & Norton, R.H. 1991, A&A, 242, 488
- (18) Guerrero, M.A., Chu, Y.-H., & Gruendel, R.A. 2000, ApJS, 129, 295
- (19) Henry, R.B.C. 1989, MNRAS, 241, 468
- (20) Howard, J. W., Henry, R. B. C., & McCartney, S. 1997, MNRAS, 284, 465
- (21) Jacoby, G.H., Morse, J., Fullton, L.K., Kwitter, K.B., & Henry, R.B.C. 1997, AJ, 511, 2611
- (22) Jacoby, G. H., Africano, J. L., & Quigley, R. J. 1987, PASP, 99, 672
- (23) Kaler, J.B., & Jacoby, G.H. 1989, ApJ, 345,871
- (24) Kwok, S. 2000, in The Origin and Evolution of Planetary Nebulae, (New York: Cambridge), 33
- (25) Pottasch, S.R. 1984, Planetary Nebulae (Dordrecht: Reidel), 168
- (26) Stanghellini, L., Shaw, R.A., Mutchler, M., Palen, S., Balick, B., & Blades, J.C. 2002, ApJ, in press (August)
- (27) Schlegel, D.J., Finkbeiner, D.P., & Davis, M. 1998, ApJ, 500, 525
- (28) Shklovsky, I. 1956, Astr. Zh., 33, 222
- (29) Stetson, P.B. 1987, PASP, 99, 191
- (30) Stetson, P.B. 1992, JRASC, 86, 71
- (31) Torres-Peimbert, S. & Peimbert, M. 1979, Revista Mexicana de Astronomia y Astrofisica, 4, 341
- (32) Tovmassian, G.H., Stasińska, G., Chavushyan, V.H., Zharikov, S.V., Gutierrez, C., & Prada, F. 2001, A&A, 370, 456 (TSCZGP)
- (33) Voges, W. et al. 1999, A&A, 349, 389
- (34) Weidemann, V. 2000, A&A, 363, 647
- (35)


 .
.
| Line | ID | Velocity | Observed Fluxa | Model Flux |
|---|---|---|---|---|
| Å | km-s-1 | H = 100 | H = 100 | |
| 3345.9 | [Ne V] 3346 | … | 32.0 | |
| 3424.6 | [Ne V] 3426 | … | 87.5 | |
| 3860 | [Ne III] 3868 | … | 14.5 | |
| 3966.2 | H 3970 | … | 15.9 | |
| 4098.78 | H 4102 | 25.9 | ||
| 4337.43 | H 4340 | 47.0 | ||
| 4682.72 | He II 4686 | 77.2 | ||
| 4858.13 | H 4861 | 100.0 | ||
| 5003.0 | [O III] 5007 | … | 3.1 | |
| 5407.6 | He II 5412 | 6.2 | ||
| 6558.67 | H 6563 | 276.8 |
| Parameter | SBS 1150+599A | Solara |
|---|---|---|
| Central Star Temperature | 101,000 K | |
| Central Star Luminosity | 5750 L☉ | |
| Central Star Mass | 0.61 M☉ | |
| Nebular Densityb | 21 cm-3 | |
| Nebular Temperaturec | 17,600 K | |
| Nebular Mass | 0.2 M☉ | |
| N(He)/N(H) | 0.066 | 0.098 |
| log(O/H)+12 | 6.93 | 8.93 |
| log(Ne/H)+12 | 7.47 | 8.09 |
| log(N/H)+12 | 8.65 | 8.00 |
| log(S/H)+12 | 7.00 | 7.21 |
| log(C/H)+12 | 8.30 | 8.60 |
| log(Ar/H)+12 | 5.00 | 6.56 |
| Ne/O | 4.3 | 0.15 |
| N/O | 52 | 0.12 |