From Massive Protostars to a Giant H II Region: Submillimeter Imaging of the Galactic Mini-starburst W43
Abstract
We have carried out a submillimeter continuum and spectroscopic study of the W43 main complex, a massive star-forming region, which harbors a giant H ii region. The maps reveal a filamentary structure containing fragments with masses of and typical diameters of 0.25 pc. Their large sizes, large non-thermal velocities (), and high densities () suggest that they are protoclusters and excellent sites to form massive stars. Follow-up observations are necessary, but we have already identified three protoclusters to be very good candidates for containing very young massive protostars. The starburst cluster, that excites the giant H ii region has a large impact on the molecular complex. However, it remains unclear if this first episode of star formation is triggering the formation of new massive stars, through ionization shocks crossing the closeby molecular clouds. W43 is thus an ideal laboratory to investigate massive star formation from the protostellar phase to that of giant H ii regions. Moreover, the very active star-forming complex W43 may be considered a Galactic mini-starburst region that could be used as a miniature model of starburst galaxies.
1 Introduction
High-mass (OB; ) stars are believed to form in clusters within molecular cloud complexes. Due to their high ultraviolet luminosity, massive young stellar objects (YSOs) first heat, then ionize, and disrupt their surrounding molecular cloud. Owing to their large distances to the Sun and the complex interplay between massive YSOs and the neighboring interstellar medium, the formation of high-mass stars is still poorly understood. Many studies have been devoted to embedded YSOs that have already developed an H ii region and thus are easily detectable in far-infrared and centimeter continuum surveys (see a review by Churchwell 1999). In contrast, possible precursors of ultracompact H ii regions (UCH iis), i.e. massive YSOs in their main building phase, have only been discovered recently (Hunter et al. 2000; Brand et al. 2001; Sridharan et al. 2002 and references therein). These massive protostars, also called high-mass protostellar objects (HMPOs), are inconspicuous in the IRAS bands and have no, or very little free-free emission. They can be detected in (sub)millimeter dust continuum and molecular high-density tracers and frequently display H2O/CH3OH maser emission. Therefore, submillimeter continuum imaging of molecular cloud complexes is ideal to probe clouds surrounding UCH iis and HMPOs simultaneously. Making a census of those deeply embedded phases is the first necessary step to gain insight into the processes leading to the formation of a massive star.
The W43 star-forming complex is located in the inner spiral arm of our Galaxy, at 5.5 kpc from the Sun (Wilson et al., 1970). W43 is well-known for its giant H ii region emitting Lyman continuum photons per second and a far-infrared continuum luminosity of (Smith, Biermann, & Mezger, 1978; Lester et al., 1985). The main ionizing source of W43 was discovered in near-infrared images by Lester et al. (1985) and confirmed by Blum, Damineli, & Conti (1999) as a cluster of Wolf-Rayet (WR) and OB main sequence stars. The inner 20 pc of W43 (at , ) contain this WR/OB cluster and a molecular cloud called G30.8-0.0. The W43 main complex was mapped in CO lines and parts of it in higher density tracers such as H2CO and HCO+ lines, and 1.3 mm continuum (Bieging, Wilson, & Downes, 1982; Liszt, 1995; Mooney et al., 1995). Several sources were identified by these authors but a complete and comprehensive sample of UCH ii regions and massive protostars is still lacking. Identifying such a sample is essential for the present paper, which aims at presenting a global scenario of (massive) star formation in W43. Therefore, we will carefully investigate the distribution of dense molecular clouds in the W43 main complex, in particular to identify sites of future or on-going massive star formation.
A detailed study of W43 may help constrain the properties of distant starburst galaxies. Indeed, the large luminosity and ionizing flux of the W43 giant H ii region are similar to those of NGC 3603 or M17 ( and Lyc s-1) , taken to be representative of clusters and H ii regions in starburst galaxies (e.g. Tapia et al. 2001). The NGC 3603 stellar cluster is qualified as “starburst” because it consists of several tens of WR, O, and B-type stars (e.g. Brandl et al. 1999). The W43 cluster of main sequence stars is likely to be similar but more heavily reddened ( mag versus 4 mag in NGC 3603). Since the W43 stellar cluster is closely associated with giant molecular clouds, we may be witnessing another burst of star formation. This would make the W43 main complex a Galactic mini-starburst region, i.e. a miniature model of the stellar and gas content of starburst regions in distant galaxies.
In the present paper, we report a submillimeter continuum and spectroscopic study of the W43 main complex. From the imaging and deep spectroscopic measurements presented in Sect. 2, we make a complete census of the compact and dense cloud fragments in W43 (Sect. 3). In Sect. 4, we investigate the impact of the giant H ii region on the molecular complex, the nature of these cloud fragments, and the global characteristics of the mini-starburst W43. Finally, Sect. 5 summarizes our conclusions.
2 Observations
2.1 Dust Continuum Observations
We mapped the dust continuum emission of the W43 main complex at 1.3 mm and in February and April 1999. We used the 37-channel MPIfR MAMBO bolometer array installed at the IRAM111 IRAM is supported by INSU/CNRS (France), MPG (Germany) and IGN (Spain). 30-meter telescope on Pico Veleta (Spain) to make the 1.3 mm map. We performed the observations at the CSO222 The CSO is operated by the California Institute of Technology under funding by the National Science Foundation, Contract AST-9615025. 10.4-meter radiotelescope on Mauna Kea (Hawaii), equipped with the 24-pixel SHARC bolometer camera. The passband of the MAMBO (respectively SHARC) bolometer array has an equivalent width of GHz (resp. 100 GHz) and is centered at GHz (resp. 860 GHz) (Kreysa et al., 1998; Hunter, Benford, & Serabyn, 1996).
Both 1.3 mm and images cover and were obtained by combining partially overlapping on-the-fly maps. In the dual-beam on-the-fly mapping mode, the telescope is scanned continuously in azimuth along each row, while wobbling. For each channel, the raw data corresponding to a single on-the-fly coverage consist of several rows taken at a series of elevation offsets. For MAMBO (respectively SHARC) maps, we used a scanning velocity of sec-1 (resp. sec-1), and a sampling of (resp. ) in azimuth and in elevation. The wobbler frequency was set to 2 Hz (resp. 4 Hz) and the wobbler throw in azimuth was (resp. ). The typical azimuthal size of individual maps was with MAMBO versus with SHARC. The MAMBO maps were reduced with the IRAM software for bolometer-array data (NIC; cf. Broguière, Neri, & Sievers 1995) while the SHARC data were processed with the standard CSO programs CAMERA and REGRID. The IRAM and CSO programs both use the EKH restoration algorithm (Emerson, Klein, & Haslam, 1979).
The size of the main beam was measured to be for MAMBO maps and for SHARC maps using Uranus and Mars. The absolute pointing of each telescope was found to be accurate to within . The data were taken with moderate weather conditions. The zenith atmospheric optical depth at 240 GHz (respectively 225 GHz) varied between and for MAMBO observations and was roughly for SHARC observations. Uranus and Mars were used for flux calibration and the overall, absolute calibration uncertainty is estimated to be for both MAMBO and SHARC maps.
2.2 Molecular Line Observations
In June 2000 and 2001, we mapped the HCO+(3-2) rotational line emission of the W43 main complex and conducted deep integrations at some of the most prominent dust maxima in the (3-2) transitions of HCO+ and its H13CO+ isotopomer. We used the facility 230 GHz receiver of the CSO and its 50 MHz bandwidth acousto-optical spectrometer with a spectral resolution. The CSO FWHM angular resolution for frequencies of 267.5576 GHz and 260.2555 GHz is .
We made two overlapping on-the-fly maps that cover a area. Each of these maps consists of several rows continuously scanned in right ascension and taken at a series of declination offsets. The scanning velocity was sec-1 and the sampling in both directions. The off position was taken at each declination offset, away in right ascension. Besides this map, we performed deep measurements in position switching mode, using off positions in azimuth. Pointing was checked on planets when available or W-AQL otherwise and was found to be stable to within .
The data were reduced with the IRAM software for spectral lines (CLASS), applying low order baselines and averaging individual spectra with rms weighting. Our line observations were corrected for atmospheric attenuation, ohmic losses, rearward spillover and scattering, using the standard chopping wheel technique. The 225 GHz zenith optical depth was during the maps and varying between 0.08 and 0.18 during the position switch measurements. To convert the resulting antenna temperatures () to main beam brightness temperatures (), we have divided the data by the main beam efficiency determined from observations of Mars, . The calibration accuracy is .
3 Results and Analysis
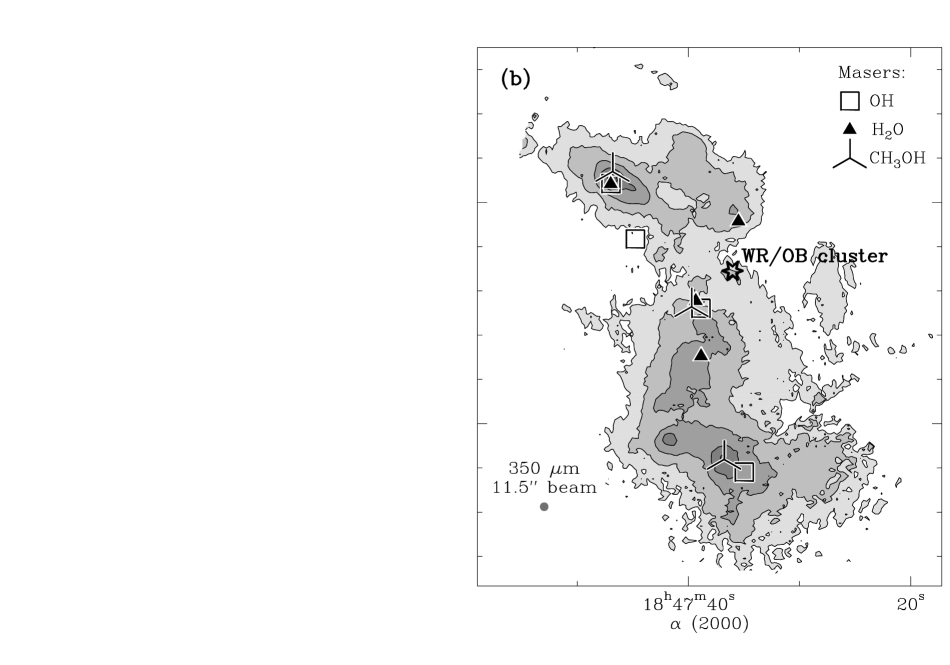
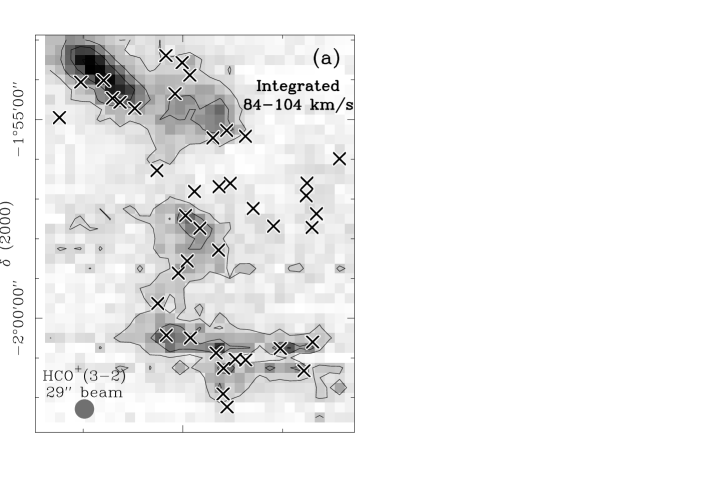
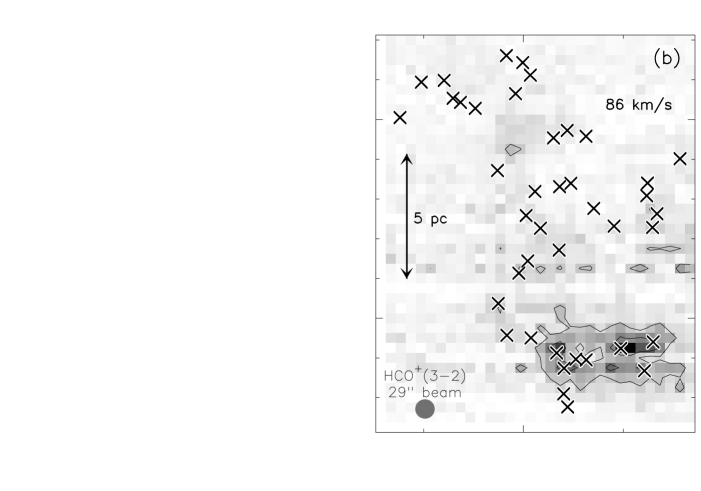
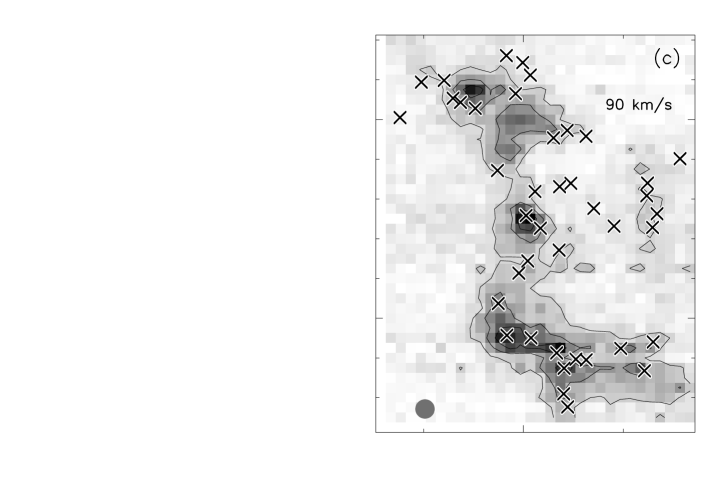
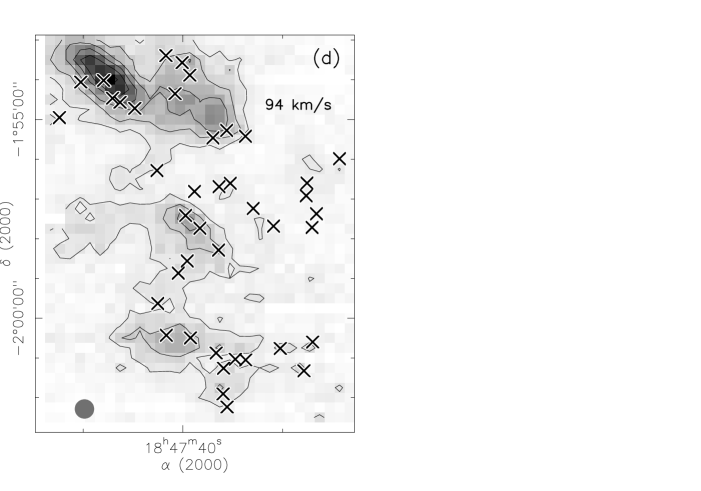
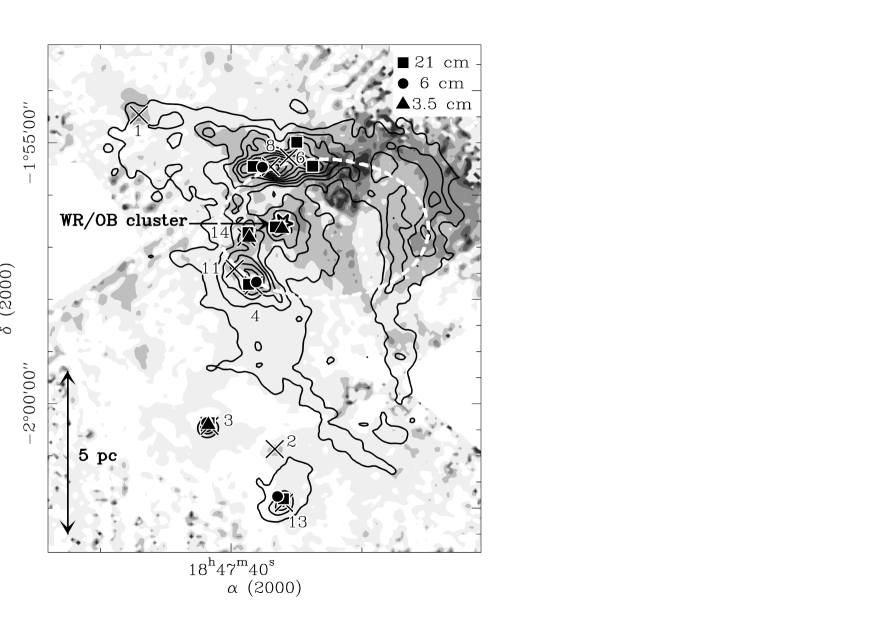
Our 1.3 mm and continuum maps are presented in Figs. 1a-b. They cover a 17 pc 20 pc area, roughly centered on the stellar WR/OB cluster. The HCO+(3-2) map covers a slightly smaller area (14 pc 16 pc) and is shown in Figs. 2a-f, where the integrated intensity is displayed along with five velocity channels ranging from to . Figs. 1a-b and 2a all show that the dense molecular gas in the W43 main complex follows a global “Z”-shaped filamentary structure. Some more compact fragments are observed within this filament. We make a complete census of these fragments in Sect. 3.1 and estimate their temperature, mass, and other characteristics in Sect. 3.2.
3.1 Census of Compact Cloud Fragments in W43
3.1.1 Cloud structure
Our immediate goal is to investigate the submillimeter continuum maps of W43 to identify cloud fragments which could form massive stars. The maps shown in Figs. 1a-b are in very good agreement with each other (except for the north-western corner, see below) and mainly trace the optically thin thermal emission of dust in molecular clouds. Examination of Figs. 1a-b reveals a wealth of cloud structures with size scales ranging from ( pc) to more than ( pc). The dynamical range within these maps is also very high: in the MAMBO map and in the SHARC map. To assess the complexity of the submillimeter emission of W43, we use the Gaussclumps program (Kramer et al., 1998), which we have adapted to continuum observations. The emission above in Fig. 1a can fairly well be described by a sum of cloud fragments with 2-D Gaussian shapes. Since most of such fragments consist of moderate-density gas (, see below), they are unlikely sites for massive star formation.
We thus need to separate compact and dense cloud fragments from their surrounding, lower density clouds. We use the method developed by Motte & André (2001a) to estimate the outer diameters of the four main submillimeter fragments (W43-MM1 to MM4 labelled in Fig. 1a). In both MAMBO and SHARC maps, we measure outer diameters of corresponding to pc. We do not expect the weaker compact fragments to have the exact same radial extent but, for simplicity, we use a lengthscale to extract all dense fragments. We stress that such a cloud decomposition is not unique as these pc cloud fragments will probably fragment further to form more than one single star. It permits one to select structures with peak density larger than , when a mJy/11″-beam 1.3 mm flux, a 20 K dust temperature and a dust mass opacity are assumed (calculated from e.g. Eq. () of Motte, André, & Neri 1998).
We measure the submillimeter flux of each compact fragment in two steps. We first filter out all spatial scales larger than from the MAMBO map and identify 51 fragments above the level. We then derive the 1.3 mm Gaussian characteristics of each fragment by applying an improved version of the technique we developed for our previous studies (Motte et al., 1998, 2001). It uses a multiresolution analysis to refine the extraction of the compact fragment from its local background emission (see Starck, Murtagh, & Bijaoui 1998; Motte & André 2001b) and the Gaussclumps program to fit its Gaussian parameters (Kramer et al., 1998). The fitted fragments are indicated as black ellipses in Fig. 1a and account for of the total 1.3 mm flux measured. We perform the same analysis on the SHARC map, where 23 of the 51 1.3 mm fragments are recovered above and within of the 1.3 mm positions.
These compact submillimeter fragments have basic characteristics listed in Table 1. Col. 1 gives their adopted names (where a small number corresponds to a high level of detection during the first step of our analysis) and Cols. 2-3 their coordinates. The Gaussian peak fluxes, FWHM sizes, and integrated fluxes measured at 1.3 mm are listed in Cols. 4-6, along with the integrated fluxes of their counterparts in Col. 7. The spectral indices (where ) we measure from the integrated fluxes and are given in Col. 8. The error bar on varies from up to for the weaker fragments.
The next step of the analysis is to ensure that the submillimeter fragments selected above are indeed dense cloud fragments. We thus need to check the contamination of submillimeter fluxes by lines and free-free emission. Contamination by CO line emission is negligible for those fragments which are dense and compact. In contrast, the “hot core” line emission displayed by several fragments (Motte et al. in prep.) contributes to the submillimeter continuum fluxes we measure. Such “hot cores” are pointlike (in a 0.3 pc beam) and embedded in dense fragments, which have a ratio of (cf. Table 1). Their emission would thus very unlikely dominate the submillimeter continuum. We consider that is an upper limit for the line contamination of the W43 submillimeter fragments.
Without a doubt, the main source of contamination of 1.3 mm fluxes is the free-free emission from H ii regions. To estimate such a contamination, we compare our 1.3 mm and images with centimeter free-free data from the literature. Strikingly, the maps of Figs. 1a-b differ in their north-western corner where the 1.3 mm arc-like structure disapears at . For a further comparison we compute the spectral index map between and 1.3 mm (see Fig. 3). Most of the map shows an index of , suggestive of thermal emission of dust at . In contrast, at the location of the giant H ii region (Lester et al., 1985; Liszt, Braun, & Greisen, 1993; Balser, Goss, & De Pree, 2001), the map has a lower index: . Since there is a good correspondance between these low values and the large-scale ionized gas (cf. Fig. 3), the 1.3 mm fluxes measured in that region are likely contaminated by free-free emission. Most of the free-free emission in W43 arises from its giant H ii region and is probably optically thin at centimeter wavelengths. Any ultra-compact H ii regions in W43 should have a free-free emission at least partly optically thick. The spectral indices computed for the two most compact centimeter sources are however indicating that their free-free emission is mostly optically thin when cm (see Sect. 3.2.4). We thus hereafter assume that all the 3.5 cm emission mapped in W43 at angular resolution is optically thin.
We estimate the contribution of free-free emission to the 1.3 mm fluxes measured in Table 1 by using the 3.5 cm map of Balser et al. (2001), which has a similar angular resolution to our continuum data ( vs. ). The 21 cm map of Liszt et al. (1993) is used when the fragments are lying outside the 3.5 cm primary beam. We filter out all spatial scales larger than and integrate the centimeter emission at the position of each 1.3 mm fragment. Then we assume a spectra typical for optically thin free-free emission to estimate the flux of the ionized gas at 1.3 mm (cf. Col. 9 in Table 1). Within the giant H ii region powered by the WR/OB cluster, the free-free contribution to the twenty 1.3 mm compact fragments (including W43-MM6, MM8, MM14, MM11, MM4, MM20, MM15 and MM25 shown in Fig. 1a) goes up to with an average value of . Outside this region, the free-free contribution is lower than , with the notable exception of W43-MM13, which coincides with a centimeter source (cf. Fig. 3). Altogether the level of free-free contamination is low for the compact continuum fragments identified in Fig. 1a.
In the following, we subtract the free-free emission estimated above from the 1.3 mm fluxes of Table 1. Three of the 51 fragments (namely W43-MM32, MM46, MM50) are falling below the limit we set for their initial detection and are removed from the sample. We thus end up with 48 1.3 mm fragments, 22 of which are also detected at . We are confident that the 48 compact fragments identified in Table 3 represent genuine dust continuum sources.
3.1.2 Cloud kinematics
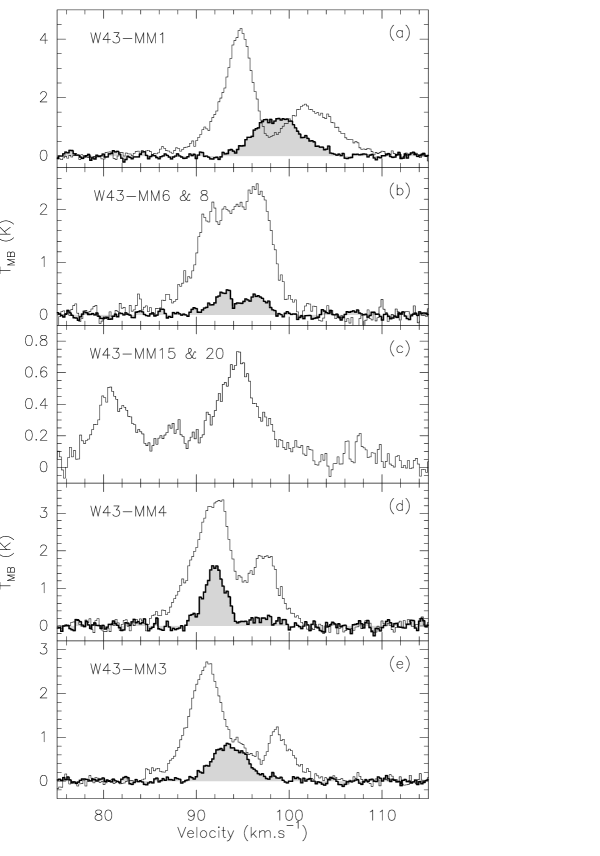
We make here a first order kinematics analysis of the dense cloud fragments observed in the W43 main molecular complex. The HCO+(3-2) emission in Fig. 2a displays the same filamentary structure as the dust continuum maps in Figs. 1a-b. We selected several compact dust fragments at various locations in the W43 main complex and made deep integrations in HCO+(3-2) and H13CO+(3-2). In Table 2, for each submillimeter fragment (Col. 1) and optically thin molecular transition (Col. 2), we separate the line into one to four velocity components (see Col. 3). We choose this decomposition to better describe the lines which are broad and structured but none of those components are perfectly fitted by a Gaussian. We give in Cols. 4-7 of Table 2 the Gaussian parameters of the fitted components, i.e. local velocity at rest, peak line temperature, integrated intensity and line width. Figs. 4a-e display the spectra taken at some of these locations. HCO+ emission has been successfully detected for each selected submillimeter fragment. Even 1.3 mm locations W43-MM15&20 and MM25, where heating from the WR/OB cluster and contamination by free-free emission is highly probable, contain high-density gas. As suggested by a careful examination of Fig. 2a , the HCO+(3-2) line emission of W43-MM1, MM2, MM3, MM9, and MM10 is optically thick (cf. Figs. 4a and 4e). The HCO+(3-2) emission of the other submillimeter fragments is probably optically thin, but their lines often display a complex shape: from multiple velocity components (W43-MM15&20, MM4, MM7, cf. Figs. 4c-d) to a single component with a broad non-Gaussian line shape (W43-MM6&8, MM25, cf. Fig. 4b). We stress that the more complex is the line, the closer in projection to the WR/OB cluster is the fragment. Despite those limitations, we will use the values of and given in Table 2 to further analyze the molecular cloud kinematics.
As illustrated in Figs. 2b-f and Figs. 4a-d, there is a velocity gradient from the southern part of the filament () to its northern part (). Liszt (1995) observed similar gradients in HCO+(1-0) and 13CO(1-0) and proposed that the southern gas is in front of W43 and the northern gas behind (see also Bieging et al. 1982). This velocity gradient roughly develops along the Galactic plane and encompasses the recombination line velocity found for the ionized gas in front of the WR/OB cluster ( according to Balser et al. 2001). It thus suggests that the starburst cluster is intimately associated with the W43 main molecular complex.
3.2 Characteristics of the Compact Cloud Fragments
We derive the basic properties of the compact ( pc) cloud fragments of W43 using their dust continuum and HCO+ line parameters given in Tables 1-2. Table 3 lists the fragment name (Col. 1), the adopted dust temperature (Col. 2), the estimated submillimeter mass (Col. 3), gas density (Col. 4), and virial mass (Col. 5). In the following, we describe the methods and assumptions used to estimate those characteristics and we search for stellar activity signatures coincident with the dense cloud fragments.
3.2.1 Dust temperature
The temperature is unlikely to be homogeneous in the W43 molecular complex because it is known to form massive stars. As a matter of fact, Lester et al. (1985) measured dust temperatures ranging from 40 K to 90 K, using and images made at the Kuiper Airborne Observatory (KAO). We expect the temperature of W43 compact fragments to be lower as they are largely embedded within clouds. The first confirmation comes from the spectral indices of the 22 fragments detected at both 1.3 mm and . When they are corrected for free-free contamination, these indices have a median value of (see Cols. 8-9 of Table 1). For a pure thermal and optically thin dust emission with a standard dust opacity index of (where ), this corresponds to the averaged dust temperature of .
In an effort to better constrain the average temperature of the W43 compact fragments we compare their spectral energy distribution (SED) to graybody models (cf. Figs. 5a-b). Their SED is built from the 1.3 mm and integrated fluxes measured in this paper (cf. Table 1) and the and fluxes read from Fig. 1 of Lester et al. (1985) for pointlike sources (in a beam). The fluxes of MSX sources located close to the submillimeter fragments or corresponding upper limits are displayed but not used (see Sect. 3.2.4). Our SED analysis shows that graybody models with dust opacity index of might be more appropriate than those with (where , cf. Fig. 5a). This result agrees with the multiwavelength submillimeter studies of other massive YSOs (e.g. Hobson et al. 1993). We therefore use graybody models with , while knowing that temperatures increase by only a few degrees when (e.g. Fig. 5a). Since mid- to far-infrared fluxes are often missing and upper limits remain high (see also Sect. 4.1.1), we only successfully constrain the dust temperature of four dense fragments: W43-MM1 (), MM2 (), MM3 (), and MM7 (). We also derive the bolometric luminosity and the submillimeter to bolometric luminosity ratio of W43-MM1 (, ), MM2 (, ), MM3 (, ), and MM7 (, ). Despite its incompleteness, the present analysis suggests that most compact cloud fragments in W43 are rather cold () and have high bolometric luminosities (). Their masses are estimated below.
3.2.2 Mass estimated from the submillimeter continuum
We believe that the submillimeter continuum emission of cloud fragments identified in Sect. 3.1.1 is mainly thermal dust emission, which is largely optically thin. For any given dust properties and gas-to-dust ratio, the 1.3 mm and fluxes are thus directly related to the total (gas dust) mass of the fragments. For present mass estimates, we use the 1.3 mm integrated fluxes (, see Table 1) because they provide more homogeneous measures. We correct those fluxes for any residual free-free contamination (cf. Col. 9 in Table 1) and derive the “submillimeter mass” (, given in Table 3), as follows:
| (1) | |||||
where is the dust opacity per unit mass column density at 1.3 mm, and () is the Planck function for a dust temperature .
The dust mass opacity (including dust properties and gas-to-dust mass ratio) is likely to vary with density, temperature, and the evolutionary state of the emitting medium (Henning, Michel, & Stognienko, 1995). Models of dust in low-mass protostellar cores (e.g. Ossenkopf & Henning 1994) suggest that a value of is well suited for cool () and high-density () cloud fragments. This value agrees with the recent cross-comparisons of dust emission surrounding an UCH ii region with its CO ice absorption and gas emission (van der Tak, 2002). We thus choose a dust opacity per unit (gas dust) mass column density of . We use this value for all the dense fragments because the average dust properties of these pc structures should not change drastically when they contain a massive protostar or an UCH ii. We estimate that the absolute value taken for the dust mass opacity is uncertain by at least a factor of 2.
The temperature to be used in Eq. (1) is the mass-weighted dust temperature of the cloud fragments, its value can be determined from the gray-body fitting of their SED. In Sect. 3.2.1, we recommend for most of the dense cloud fragments. We thus assume for the fragments deeply embedded into the “Z”-shaped filament and for those that may be less shielded against the radiation of the WR/OB cluster (see Col. 2 of Table 3).
3.2.3 Virial mass
We estimate the virial mass of the W43 compact cloud fragments assuming that they are spherical and have a density distribution: (e.g. Bertoldi & McKee 1992, cf. Table 3). We use the line width () listed in Table 2 and the diameter measured at 1.3 mm (FWHM in Table 1). We subtract the thermal component of the line width using the temperature adopted in Table 3. As the thermal component of the velocity dispersion is rather small ( when ), the error introduced by assuming that the kinetic temperature equals the dust temperature is negligible. Whenever the optically thin line consists of several velocity components, we use their median line width and indicate the number of components in Col. 5 of Table 3.
The targetted positions for HCO+ measurements generally correspond to a single submillimeter fragment embedded in a lower-density filament (cf. Sect. 3.1.1). Therefore the line width and then the virial mass derived from these measurements are upper limits for the width and mass of the submillimeter fragments alone. Follow-up maps with higher density tracers are needed to select the gas only associated with the submillimeter fragment and estimate a more accurate virial mass.
In a few cases, HCO+ lines are optically thin but reveal several velocity components. The comparison with the line spectra of the H13CO+ isotopomer can help isolate the velocity component most probably associated with the compact and dense dust fragment. This is the case of W43-MM4 and MM7 where the low velocity components (at and ) have larger H13CO+/HCO+ intensity ratios and should thus consist of higher density gas (cf. Table 2 and Fig. 4d). When we cannot state that a submillimeter fragment corresponds to a single velocity component, we simply assume that it consists of several cloud fragments with the same mass.
According to Pound & Blitz (1993), a fragment remains gravitationally bound as long as . Since the submillimeter masses are uncertain by a factor of 2 and the virial masses are upper limits, we estimate that the ratio must be at least larger than 0.2 to suggest gravitational boundedness.
3.2.4 Coincidence with signposts of stellar activity
Various published catalogues can be used to search for stellar activity within the dense cloud fragments listed in Table 3. In addition to the IRAS survey, the Midcourse Space Experiment (MSX333See http://www.ipac.caltech.edu/ipac/msx/msx.html.) provides pointlike sources observed at 8, 12, 15, and with a resolution (Egan et al., 2001). MSX G30.7196-0.0854 and G30.6882-0.0726 (or IRAS 18450-0205) are the only two infrared sources relevant to our study because they coincide with high-density clouds and have sizes (see Fig. 6 and Sect. 4.1.1). MSX G30.7196-0.0854 may be associated with W43-MM3, but its nominal position is further away than what the maximum pointing uncertainties allow. As for MSX G30.6882-0.0726, it coincides with W43-MM13 well within the maximum positional errors. The and fluxes of the associated IRAS source are confused by the far-infrared emission of the W43 giant H ii region. With HIRES444http://www.ipac.caltech.edu/ipac/iras/hires_over.html (High Resolution Processing using the Maximum Correlation Method) images, we successfully measure a flux of Jy within a beam.
Besides infrared sources, some small-diameter () radio sources are identified at 21, 6 and 3.5 cm by Zoonematkermani et al. (1990), Garwood et al. (1988), Becker et al. (1994), and Balser et al. (2001). They roughly coincide with W43-MM3, MM4, MM13, MM14 and MM20 (see Fig. 3). W43-MM3 and MM4 are clearly the most compact of these sources with diameters of . Their spectral indices measured from 21 to 6 cm and then from 6 to 3.5 cm are 0.5 and for W43-MM3 and and for W43-MM4. Their free-free emission is thus partially optically thick from 21 to 3.5 cm and becomes mostly optically thin at wavelengths shorter than 3.5 cm.
Furthermore, complete surveys of methanol, water and hydroxyl maser emission have been performed in W43 (Walsh et al., 1998; Valdettaro et al., 2001; Braz & Epchtein, 1983). The CH3OH survey made at 6.7 GHz with ATCA has position uncertainties smaller than (Walsh et al., 1998) and the H2O maser positions observed at 22 GHz with the Medicina telescope are only secure to (Valdettaro et al., 2001). The OH type-I masers detected at 1.6-1.7 GHz and compiled by Braz & Epchtein (1983) have a positional accuracy of or (south-west of W43-MM2). In Fig. 1b, W43-MM1 and MM11 are coincident with the CH3OH, H2O and OH maser sources called Main3 and Main1, respectively. W43-MM2 is associated with CH3OH and OH masers while W43-MM6 and MM7 coincide with two H2O maser sources, the second being called Main2. The position and systemic velocity of the methanol masers are well confined within the radial and velocity extent of the compact fragments ( and from their peaks, Walsh et al. 1998; see also Caswell et al. 1995). The water maser coincident with W43-MM1 peaks away from its systemic velocity. That associated with W43-MM11 has one out of two velocities recorded within of the molecular emission peak (cf. Valdettaro et al. 2001 and references therein). These infrared, centimeter and maser sources are stellar activity signposts which will help investigate the stellar content of cloud fragments listed in Table 3.
4 Discussion
We have made a complete census of cloud fragments with density greater than and size smaller than 1 pc in W43. Before we discuss their characteristics and evolutionary state (in Sect. 4.2), we investigate the likely effects of the WR/OB cluster on the W43 molecular cloud complex (in Sect. 4.1).
4.1 The Starburst Cluster Interacting with W43 Molecular Clouds
According to the near-infrared spectroscopic study of Blum et al. (1999), W43 harbors a cluster of main sequence stars that contains at least one Wolf-Rayet star and two O-type (super)giants. This young cluster is substantially more luminous () than a typical OB association and qualifies as a starburst cluster. We first describe the characteristics of the giant H ii region excited by this starburst cluster and then discuss its impact on the W43 molecular clouds.
4.1.1 The giant H ii region
Previous centimeter continuum studies showed that the far-ultraviolet photons of the WR and OB stars in the W43 cluster created a large bubble of free-free emission also called giant H ii region (see Balser et al. 2001 and references therein). The white dashed ellipse plotted in Fig. 3 outlines this bubble of ionized gas, which has a full size of pc pc. The north-eastern and south-western extensions of the W43 free-free emission may also be associated with gas ionized by the WR/OB cluster. If this idea is confirmed, the H ii region powered by the W43 starburst cluster would cover up to 13 pc.
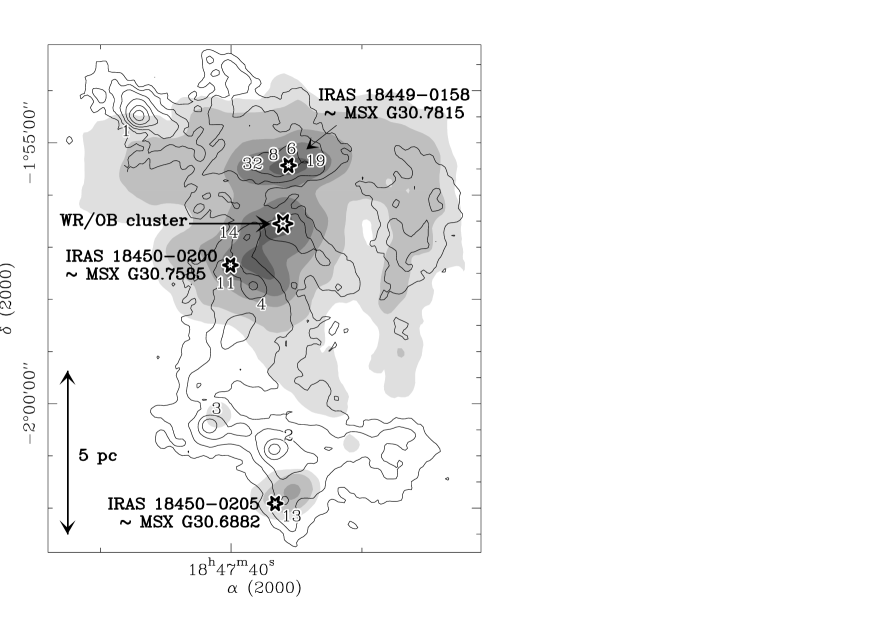
Fig. 6 displays the infrared emission mapped with MSX at . It nicely coincides with the free-free emission of the giant H ii region (compare with Fig. 3). Since very small grains (Désert, Boulanger, & Puget, 1990) survive inside H ii regions, the 8 to 21 m MSX maps may trace their strong near- to mid-infrared continuum. Indeed, this hot continuum has already been detected in a region with similarly intense radiation field (namely M17), using ISOCAM/CVF spectra at and MSX data (Cesarsky et al., 1996; Nielbock et al., 2001). The emission in Fig. 6 peaks at the location of the stellar cluster but also extends along the southern and northern clouds containing W43-MM4, MM11, MM14 and W43-MM19, MM6, MM8, MM32. Those ridges of mid-infrared emission may outline the ionization fronts also observed at centimeter and far-infrared wavelengths (cf. Lester et al. 1985). The relative positions of the ridges to the 1.3 mm dense clouds perfectly agree with the 3D model of W43 (cf. Fig. 6). The southern emission is displaced to the north of the clouds associated with W43-MM4, MM11 and MM14, suggesting that most of it is obscured by these clouds where we measure up to mag. In contrast, the northern ridge is consistent with the illumination of the clouds surface from the front and south. The luminosity and pc extent of these ridges also agree with the radiation of the cluster being intercepted within reasonable opening angles of sr. It is thus very likely that the starburst cluster, located in between these clouds (see e.g. Fig. 7a), is responsible for the large mid-infrared emission mapped in e.g. Fig. 6. Therefore, the two IRAS sources 18450-0200 and 18449-0158 (from the Point Source Catalogue) could arise at the interface between the ionized gas and the molecular cloud rather than from any embedded stellar population (see also Mathis 1990). This assumption holds when comparing the IRAS fluxes with those measured by MSX and the KAO which both have better angular resolution ( and vs. and ). The 12 and fluxes of IRAS 18450-0200 and IRAS 18449-0158 are indeed twice stronger than those of the compact sources MSX G30.7585-0.0495 and MSX G30.7815-0.0219 (Egan et al., 2001). Similarly, the 60 and IRAS fluxes are ten times those measured with the KAO (Figs. 1a-b in Lester et al. 1985). A near-infrared study will uniquely determine if these two IRAS sources are indeed associated with ionization fronts excited by the WR/OB cluster (Petr-Gotzens et al. in prep.).
The existing data suggest that the centimeter and near- to far-infrared characteristics of W43 are completely dominated by the ionization and heating from the WR/OB cluster. We hereafter investigate if the kinematics of the molecular clouds observed in Figs. 1-2 is itself shaped by this starburst cluster.
4.1.2 Impact of the starburst cluster on the clouds
To distinguish between the influence of Galactic motions and that of the starburst cluster, we need to carefully study the systemic velocity throughout the W43 cloud complex. Fig. 7a displays the measured for the compact cloud fragments of Table 2 as a function of the Galactic longitude offsets relative to that of the starburst cluster. It shows a clear velocity gradient along the Galactic plane, which is consistent with that mentioned in Sect. 3.1.2. The dashed line in Fig. 7a represents a linear fit, which gives a gradient of pc-1. Except in the improbable case where the W43 molecular cloud is along the line of sight (), this velocity gradient is too large to be explained by a simple model of spiral Galactic motions (e.g. Brand & Blitz 1993). In contrast such a gradient agrees with W43 being in the molecular ring, at a location where the velocity field is known to be complex (Liszt et al., 1993; Liszt, 1995).
In Fig. 7b, the is corrected for the Galactic gradient measured in Fig. 7a and plotted as a function of the projected distance to the WR/OB cluster. This distance is set to a negative value for cloud fragments situated south of the stellar cluster. The dispersion of the cloud fragments and the velocity dispersion of individual fragments are observed to increase in the inner 4 pc from the WR/OB cluster, outlined by a dashed ellipse in Fig. 7b. Furthermore, the dispersion from the median velocity (zero level indicated as a gray line) is larger for lower density unbounded fragments. Indeed, the four velocity components detected at location W43-MM15&20 have density lower than and are far from virial equilibrium (). Besides, the high velocity components of W43-MM4 and W43-MM7 probably correspond to the lowest density clouds at the location of these dust fragments (cf. Sect. 3.2.3). Therefore, we find that the dispersion of the fragments systemic velocities is decreasing with the distance to the WR/OB cluster and with the density of the clouds. It can be interpreted as evidence that low- to moderate-density clouds (, ) situated within a pc radius from the starburst cluster have been blown away. If we assume a typical age of yr for the WR and OB stars, the dispersion recorded on the line of sight of the cluster and supposed to correspond to the 7 pc diameter measured in Fig. 7b suggests a sweeping motion of . A similar study around the M17 giant H ii region suggests that a shell of cloud is radially expanding with (Rainey et al., 1987). Such velocities can be reached by the combined effect of stellar winds and ionization shocks originating from the starburst cluster, since models predict a rocket velocity up to (Bertoldi, 1989).
Several studies already suggested the presence of a shell expanding away from the WR/OB cluster (Liszt et al., 1993; Balser et al., 2001). We confirm this idea but propose that the densest parts of the molecular cloud complex have a systemic velocity which is given by local Galactic motions and is not affected by the interaction with the WR/OB cluster. This should be particularly true for the vast majority of the compact cloud fragments identified in Sect. 3.1.1. Their detailed structure and kinematics can, however, be sensitive to the shock wave propagating ahead of the ionization front. The kinematics of the W43 molecular cloud complex would merit a careful comparison with models of “radiation-driven implosion” (Bertoldi, 1989; Lefloch & Lazareff, 1994). Such a study will however need further molecular line observations and is clearly beyond the scope of the present paper.
4.2 Protocluster Candidates in the Mini-starburst W43
We have identified 48 cloud fragments which we think are good sites for harboring on-going massive star formation. Their general characteristics are investigated in Sect. 4.2.1 and suggest they are protoclusters, i.e. molecular clouds that will form clusters of stars. We then discuss in Sect. 4.2.2 the evolutionary state of several of these protoclusters and qualify W43 as a Galactic mini-starburst in Sect. 4.2.3.
4.2.1 Protocluster candidates
In order to determine the nature of the dense, massive, and compact cloud fragments of W43, we compare their general characteristics with those of cloud fragments observed in nearby (low- to intermediate-mass) star-forming regions. Those cloud fragments are frequently called “dense cores”, according to a treshold density () and regardless of their size, mass or substructure (e.g. Jijina, Myers, & Adams 1999). Instead, we prefer to use the terminology recently established for star-forming molecular clouds like Ophiuchi or Orion B when they are surveyed with high-density and high-resolution tracers such as the submillimeter continuum (e.g. Motte & André 2001b). The main advantage is to suggest the level of subfragmentation expected for any cloud fragment and thus its abilility to form either one or several stars. Molecular clouds which are currently forming clusters of stars are often called protoclusters, like the Ophiuchi main cloud L1688 or NGC 2068 in Orion B (e.g. Wilking & Lada 1983; Motte et al. 2001). The best studied case is the L1688 protocluster which has a mass of in pc diameter (Wilking & Lada, 1983). In those protoclusters, starless condensations are believed to represent the last stage of turbulent fragmentation (, pc), making them the precursors of individual stars (Motte et al., 1998, 2001). Dense cores are the intermediary cloud structures most probably forming a group of stars (, pc, e.g. Jijina et al. 1999).
The W43 fragments have diameters ranging from 0.09 pc to 0.56 pc and masses spanning the range to (cf. Tables 1 and 3). On average (, pc), their characteristics are thus closer to those of protoclusters than those of low-mass dense cores or condensations. In that context, most of the cloud fragments observed in W43 qualify as protocluster candidates. Higher-resolution studies are necessary to prove our interpretation but we give below additional arguments. Indeed, the HCO+ line characteristics of the W43 compact cloud fragments suggest that they are not homogeneous reservoirs of gas. Indeed, optically thin lines are broad (, cf. Table 2) and often non-Gaussian (see e.g. Figs. 4a-e). Moreover, H13CO+ which is tracing denser gas than HCO+ has narrower lines which sometimes peak at a slightly different velocity (e.g. W43-MM4, MM7, MM11). Jijina et al. (1999) showed that cloud fragments associated with clusters have larger line widths than those forming single stars. Myers (1998) also predicted the existence of pc condensations embedded within massive and turbulent cloud fragments. Because the compact fragments of W43 are indeed massive () and turbulent (), they are likely to consist of many smaller-size and denser structures orbiting within the same cloud. This interpretation argues for the protocluster nature of the submillimeter fragments we have identified.
With present observations only, we cannot draw definite conclusions on the gravitational status of W43 protoclusters (see Sect. 3.2.3). The small ratios observed for some of the most massive protocluster candidates suggest the majority of them could be far from virial equilibrium. Besides, the mean ellipticity of the W43 protoclusters (axis ratio 1:2) resembles that observed for low-mass dense cores and is definitively larger than that of gravitationally bound starless condensations (Motte et al., 2001). It thus agrees with the idea that W43 protoclusters are generally not in a gravitation-dominant regime but probably consist of material governed by turbulence. However, protocluster candidates are embedded within some hotter lower-density gas, so that the external pressure could substantially help confine the protocluster gas and maybe prevent it from dispersing. Note that the structures we define here as protocluster candidates do not need to evolve independently from their surrounding gas, in which one expects low- to intermediate-mass stars to form.
Strikingly, these protocluster candidates are very dense (mean density of , see Table 3) compared to their low-mass counterparts ( , e.g. Wilking & Lada 1983). In fact they are as dense as the low-mass starless condensations, which are believed to be the direct progenitors of single (or binary) stars (Motte et al., 1998). Such a dense cloud medium is thus regularly observed in low-mass star-forming clusters, but not over pc scale, which is ten times larger than the typical size of starless condensations. Furthermore, we stress that the density of smaller-scale fragments within those protoclusters will surely be much higher. Similar densities, sizes, masses and line widths have already been recorded for protoclusters harboring UCH iis and HMPOs (Hunter et al., 2000; Plume et al., 1999; Beuther et al., 2002). Such cloud characteristics may then enhance star formation and allow the formation of massive stars.
The unbiased survey we made in the W43 main complex should be sensitive to protoclusters either being pre-stellar or containing massive protostars or UCH ii regions. As all sources are at the same distance from the Sun and in the same cloud complex, the resulting sample is far more homogeneous than in any other previous study (e.g. Hunter et al. 2000; Sridharan et al. 2002). No doubt that follow-ups of such a complete and comprehensive sample will help understand the formation mechanism of massive stars. We present below our first attempt to determine the evolutionary state of W43 protoclusters candidates.
4.2.2 Evolutionary state of W43 protoclusters
It is questionable to try to determine the evolutionary state of protoclusters since, by definition, they contain several YSOs. However when a high-mass star is forming, it probably shapes the structure, kinematics, and chemistry of the whole protocluster via strong heating, ionization and outflow. It is thus tempting to constrain the evolution of protoclusters using the evolutionary state of its main stellar component. We discuss below the case of 6 protocluster candidates according to their characteristics and the stellar activity signposts presented in Sect. 3.2.
W43-MM1, MM2 and MM11 are methanol, water (with the exception of MM2) and hydroxyl maser sources without any infrared or centimeter detection (cf. Figs. 1b, 3 and 6). W43-MM1 and MM2 are also massive () luminous () protoclusters, which are likely to be gravitationally bound (). The gravitational status of W43-MM11 is less clear, since we measure (see Sect. 3.2.3). These protoclusters are globally cold (, e.g. Fig. 5a), but recent observations argue for the presence of embedded “hot cores” with in W43-MM1 and MM2 (Motte et al. in prep.). The submillimeter to bolometric luminosity ratio measured in Sect. 3.2.1 () is similar to that of low-mass class 0 protostars which are YSOs in their main accretion phase (André, Ward-Thompson, & Barsony, 2000). All those rare characteristics make these three protoclusters excellent candidates for containing massive protostars, i.e. massive YSOs which have not yet assembled the bulk of their final stellar mass and neither have developed H ii regions. As they are not coincident with any near- to mid-infrared sources, they likely represent even younger phases than the IRAS selected HMPOs (Brand et al., 2001; Sridharan et al., 2002). This idea is confirmed by their high mass to luminosity ratio, sometimes used as an evolutionary indicator. W43-MM1 and MM2 have higher ratios () than those measured555 In order to ensure consistency with our derivation, the mass values of Beuther et al. (2002) and Hunter et al. (2000) have been recalculated using . for HMPOs (, Sridharan et al. 2002) and UCH iis envelopes (, cf. Hunter et al. 2000).
The W43-MM3 protocluster looks very similar to W43-MM1 and MM2 in terms of mass, luminosity, average temperature and other mass or luminosity ratios (see Table 3 and Sect. 3.2.1). However, W43-MM3 is not a maser source and coincides with a bright ( Jy) radio continuum source which is partially optically thick between 21 and 3.5 cm (see Fig. 3 and Sect. 3.2.4). This compact free-free emission source is barely resolved, with a pc deconvolved diameter smaller than the 0.25 pc size measured at 1.3 mm. Despite its high luminosity (), W43-MM3 was not detected by IRAS, maybe due to confusion from the closeby giant H ii region. The inspection of Fig. 6 suggests that W43-MM3 is loosely associated with MSX G30.7196-0.0854, but this source is three times more extended than the 1.3 mm protocluster. Moreover, its spectral index measured from to indicates that the MSX source is not an embedded star/cluster (Lada 1987, see also Fig. 5b), but probably lies by chance in front of the W43-MM3 protocluster. We thus propose that W43-MM3 harbors an ultra-compact H ii region, not developed enough to efficiently heat its of dust and gas. This source illustrates the difficulty and inadequacy of the determination of the massive YSOs evolutionary state from the characteristics of their hosting protocluster and vice versa.
W43-MM4 is a massive protocluster (), which is probably gravitationally bound (, cf. Sect. 3.2.3). Its study at infrared and centimeter wavelengths is unfortunately impaired by the strong emission of the southern ionizing front (see Sect. 4.1.1). However in the 21 cm and 3.5 cm surveys of Zoonematkermani et al. (1990) and Becker et al. (1994), W43-MM4 coincides with some compact ( pc) free-free emission, which is strong ( mJy) and partially optically thick, i.e. typical of UCH ii regions. High-resolution surveys at centimeter and mid-infrared wavelengths are, however, necessary to firmly identify W43-MM4 as a protocluster hosting an UCH ii region.
The W43-MM13 protocluster has a mass of and coincides with IRAS 18450-0205 (or MSX G30.6882-0.0726) and some free-free emission peaks detected at 6 cm and 21 cm (see Figs. 6 and 3). The IRAS source is satisfying the criteria established by Wood & Churchwell (1989) for selecting UCH ii regions by their mid- to far-infrared colors (see HIRES flux in Sect. 3.2.4). However, both the MSX and centimeter sources are extended (FWHM pc at 21 cm and 0.9 pc at ), ruling out the interpretation of W43-MM13 containing an UCH ii. Since the spectral index measured from to is characteristic of a deeply embedded stellar source (Lada, 1987), we suggest that a well developed H ii region is observed behind a foreground cloud. The visible to mid-infrared radiation of such an H ii region () could easily be extinguished and reddened by the mag we measure for the cloud complex containing W43-MM13. Another alternative is that the IRAS/MSX and VLA 3 cm/21 cm sources mark a third ionizing front excited by the WR/OB cluster (see Sect. 4.1.1).
We do not have enough information to determine the nature of the remaining protoclusters of Table 3. Follow-up observations, searching for “hot core” and outflow signatures, as well as ultracompact free-free emission are in progress. Mid- to far-infrared observations with the forthcoming SIRTF and Herschel satellites will also help in determining their evolutionary state.
4.2.3 The mini-starburst region W43
As illustrated above, the main molecular complex of W43 looks very efficient in forming massive stars. Indeed, at this early stage, we have already identified five protoclusters containing at least one massive protostar or UCH ii (Sect. 4.2.2). The protoclusters in Table 3, which have high density (e.g. ) and high mass (e.g. ) are also good candidates for being sites of on-going or future massive star formation. Interestingly, our results preclude that star formation in the W43 main molecular complex is continuous with an efficiency typical of giant molecular clouds (SFE over yr, Silk 1997). Indeed with a Salpeter (1955) initial mass function, one expects to discover less than one massive YSO in the HMPO or UCH ii phases (lasting for yr) when mapping the W43 main complex. Therefore, we speculate that star formation is synchronized within the W43 main molecular complex. If the protoclusters identified above are indeed currently forming or on the verge of forming massive stars, the giant molecular cloud is likely to disperse within yr, which is the lifetime of a massive star. During this short period, stars should form with an efficiency that could be as high as SFE, or equivalently a star formation rate as high as yr-1. Such a star formation efficiency is one order of magnitude larger than that of normal giant molecular clouds. It is similar to that found for the Ophiuchi dense cores, whose size is one hundred times smaller than the W43 main molecular complex (SFE over yr, Bontemps et al. 2001). In years from now, if W43 becomes a complex of OB clusters encompassed in the same (14 pc)3 volume, this efficiency would correspond to a stellar density of stars/pc3 (assuming a Salpeter IMF). A much larger density has been recorded in the Arches cluster and the core of the NGC 3603 starburst cluster ( stars/pc3, e.g. Tapia et al. 2001; Figer et al. 1999) but over a times smaller volume. Although this result clearly needs to be confirmed, it suggests that the W43 molecular complex is experiencing a sudden burst of star formation. Therefore, W43, which is known to contain a starburst cluster of main sequence stars, probably also harbors a molecular region still actively forming massive stars. It thus very likely qualifies as a Galactic mini-starburst region, a term we coin to define a region whose cloud and stellar content could be used as a template for those in starburst galaxies.
Since W43 is undergoing a mini-starburst, it offers the unique opportunity to determine the physical processes responsible for enhancing star formation in molecular cloud complexes. Among our results we show that, despite the extremely high radiation emitted by the WR/OB cluster, the densest parts of the W43 molecular clouds remain cool. Such low temperatures () are unusual for sites of massive star formation where is measured (Hunter et al., 2000; Sridharan et al., 2002). Low temperatures coupled with high densities, could be one key element of the recipe for local mini-starbursts. Another obvious element may be the impact of the revealed cluster of WR/OB stars onto the cloud. Further studies are requested before one can make any breakthrough on the origin of such mini-starburst in our Galaxy.
5 Summary and Conclusion
W43 is a molecular and H ii complex whose ionized gas has been far better studied than its molecular component. We have imaged the W43 main cloud at submillimeter wavelengths in the 1.3 mm and continuum and HCO+(3-2) line emission. In addition, we have obtained deep HCO+(3-2) and H13CO+(3-2) spectra at selected locations. Our main findings can be summarized as follows:
-
1.
A multiresolution analysis on our submillimeter continuum maps identifies compact fragments. Our continuum observations along with the 3.5 cm image of Balser et al. (2001) show that their 1.3 mm emission is largely thermal emission from cool dust.
-
2.
These bona-fide cloud fragments have diameters varying from 0.09 pc to 0.56 pc and masses spanning the range to . Their large size and turbulent line width () suggest they are protoclusters, i.e. clouds that contain many smaller-size and denser structures and will form star clusters. Those protocluster candidates have large mean densities () reminiscent of the direct progenitors of individual low-mass stars. The W43 protocluster candidates thus constitute an excellent sample for studies of the earliest stages of massive star formation.
-
3.
The present, unbiased survey is sensitive to protoclusters either being pre-stellar or containing massive protostars or UCH ii regions. Five of the W43 protoclusters are confirmed to contain massive YSOs in their HMPO or UCH ii phase. Follow-up observations are needed to determine the evolutionary state of the remaining protocluster candidates.
-
4.
In W43, the centimeter and infrared emission from the giant H ii region dominates, preventing the detection of more compact sources that could be associated with UCH iis. Notably, at least two of the three IRAS point sources of the W43 main cloud are not stellar in nature; they are instead associated with ionization fronts possibly all excited by the closeby WR/OB cluster.
-
5.
While the low-density clouds surrounding the starburst cluster may have been blown away, the densest parts of the W43 molecular clouds seem to remain at the systemic velocity given by Galactic motions. A more precise kinematic study is necessary to determine if the ionization front associated with the giant H ii region is compressing the molecular clouds and triggering star formation.
-
6.
W43 is the site of at least two remarkably efficient episodes of massive star formation. Indeed, it is known to harbor a starburst cluster containing several WR and OB stars (). We show here that the molecular complex is currently undergoing a second mini-starburst with a star formation efficiency of yr and possibly a final stellar density of stars/pc3 over (14 pc)3. Learning about the global characteristics of this Galactic mini-starburst region should help constraining the physical processes at work in the distant starburst galaxies.
References
- André et al. (2000) André, P., Ward-Thompson, D., Barsony, M. 2000, in Protostars & Planets IV, ed. V. Mannings, A. Boss, & S. Russell (Tucson: Univ. Arizona Press), 59
- Balser et al. (2001) Balser, D. S., Goss, W. M., De Pree, C. G. 2001, AJ, 121, 371
- Becker et al. (1994) Becker, R. H., White, R. L., Helfand, D. J., Zoonematkermani, S. 1994, ApJS, 91, 347
- Bieging et al. (1982) Bieging, J. H., Wilson, T. L., Downes, D. 1982, A&AS, 49, 607
- Bertoldi (1989) Bertoldi, F. 1989, ApJ, 346, 735
- Bertoldi & McKee (1992) Bertoldi, F., McKee, C. F. 1992, ApJ, 395, 140
- Beuther et al. (2002) Beuther, H., Schilke, P., Menten, K. M., Motte, F., Sridharan, T. K., Wyrowski, F. 2002, ApJ, 566, 945
- Blum et al. (1999) Blum, R. D., Damineli, A., Conti, P. S. 1999, ApJ, 117, 1392
- Bontemps et al. (2001) Bontemps, S., André, P., Kaas, A. A., et al. 2001, A&A, 372, 173
- Brand & Blitz (1993) Brand, J., Blitz, L. 1993, A&A, 275, 67
- Brand et al. (2001) Brand, J., Cesaroni, R., Palla, F., Molinari, S. 2001, A&A, 370, 230
- Brandl et al. (1999) Brandl, B., Brandner, W., Eisenhauer, F., Moffat, A. F. J., Palla, F., Zinnecker, H. 1999, A&A, 352, L69
- Braz & Epchtein (1983) Braz, M. A., Epchtein, N. 1983, A&AS, 54, 167
- Broguière et al. (1995) Broguière, D., Neri, R., Sievers, A. 1995, NIC bolometer users guide (IRAM internal report)
- Caswell et al. (1995) Caswell, J. L., Vaile, R. A., Ellingsen, S. P., Whiteoak, J. B., Norris, R. P. 1995, MNRAS, 272, 96
- Cesarsky et al. (1996) Cesarsky, D., Lequeux, J., Abergel, A., Perault, M., Palazzi, E., Madden, S., Tran, D. 1996, A&A, 315, 309
- Churchwell (1999) Churchwell, E. 1999, in The Origin of Stars and Planetary Systems, ed. C. J. Lada & N. D. Kylafis (Kluwer Academic Publishers), 515
- Désert et al. (1990) Désert, F.-X., Boulanger, F., Puget, J.L. 1990, A&A, 237, 215
- Egan et al. (2001) Egan, M. P., Price, S. D., Moshir, M. M., Cohen, M., Tedesco, E., Murdock, T. L., Zweil, A., Burdick, S., Bonito, N., Gugliotti, G. M., Duszlak, J. 2001, VizieR On-line Data Catalog, originally published in: Air Force Research Lab. Technical Rep.
- Emerson et al. (1979) Emerson, D. T., Klein, U., Haslam, C. G. T. 1979, A&A, 76, 92
- Figer et al. (1999) Figer, D. F., Kim, S. S., Morris, M., Serabyn, E., Rich, R. M., McLean, I. S. 1999, ApJ, 525, 750
- Garwood et al. (1988) Garwood, R. W., Perley, R. A., Dickey, J. M., Murray, M. A. 1988, AJ, 96, 1655
- Henning et al. (1995) Henning, T., Michel, B., & Stognienko, R. 1995, Planet. Space Sci. (Special issue: Dust, molecules and backgrounds), 43, 1333
- Hobson et al. (1993) Hobson, M. P., Padman, R., Scott, P. F., Prestage, R. M., Ward-Thompson, D. 1993, MNRAS, 264, 1025
- Hunter et al. (1996) Hunter, T. R., Benford, D. J., Serabyn, E. 1996, PASP, 108, 1042
- Hunter et al. (2000) Hunter, T. R., Churchwell, E., Watson, C., Cox, P., Benford, D. J., Roelfsema, P. R. 2000, AJ, 119, 2711
- Jijina et al. (1999) Jijina, J., Myers, P. C., Adams, F. C. 1999, ApJS, 125, 161
- Kramer et al. (1998) Kramer, C., Stutzki, J., Rohrig, R., Corneliussen, U. 1998, A&A, 329, 249
- Kreysa et al. (1998) Kreysa, E., Gemünd, H. P., Gromke, J., Haslam, C. G., Reichertz, L., Haller, E. E., Beeman, J. W., Hansen, V., Sievers, A., Zylka, R. 1998, in SPIE 3357, Advanced Technology MMW, Radio, and Terahertz Telescopes, ed. T. G. Phillips, 319
- Lada (1987) Lada, C. J. 1987, in IAU Symp. 115, Star forming regions, ed. M. Peimbert & J. Jugaku, 1
- Lefloch & Lazareff (1994) Lefloch, B., Lazareff, B. 1994, A&A, 289, 559
- Lester et al. (1985) Lester, D. F., Dinerstein, H. L., Werner, M. W., Harvey, P. M., Evans, N. J., II, Brown, R. L. 1985, ApJ, 296, 565
- Liszt (1995) Liszt, H. S. 1995, AJ, 109, 1204
- Liszt et al. (1993) Liszt, H. S., Braun, R., Greisen, E. W. 1993, AJ, 106, 2349
- Mathis (1990) Mathis, J. S. 1990, ARA&A, 28, 37
- Mooney et al. (1995) Mooney, T., Sievers, A., Mezger, P. G., Solomon, P. M., Kreysa, E., Haslam, C. G. T., Lemke, R. 1995, A&A, 299, 869
- Motte & André (2001a) Motte, F., & André, P. 2001a, A&A, 365, 440
- Motte & André (2001b) Motte, F., & André, P. 2001b, in ASP Conf. Ser. 243, From Darkness to Light, ed. T. Montmerle & P. André (San Francisco: ASP), 301
- Motte et al. (1998) Motte, F., André, P., Neri, R. 1998, A&A, 336, 150
- Motte et al. (2001) Motte, F., André, P., Ward-Thompson, D., Bontemps, S. 2001, A&A, 372, L41
- Myers (1998) Myers, P. C. 1998, ApJ, 496, L109
- Nielbock et al. (2001) Nielbock, M., Chini, R., Jütte, M., Manthey, E. 2001, A&A, 377, 273
- Ossenkopf & Henning (1994) Ossenkopf, V., Henning, T. 1994, A&A, 291, 943
- Plume et al. (1999) Plume, R., Jaffe, D. T., Evans, N. J., II, Martín-Pintado, J., Gómez-González, J. 1997, ApJ, 476, 730
- Pound & Blitz (1993) Pound, M. W., Blitz, L. 1993, ApJ, 418, 328
- Rainey et al. (1987) Rainey, R., White, G. J., Gatley, I., Hayashi, S. S., Kaifu, N., Griffin, M. J., Monteiro, T. S., Cronin, T. S., Scivetti, A. 1987, A&A, 171, 252
- Salpeter (1955) Salpeter, E. E. 1955, ApJ, 121, 161
- Silk (1997) Silk, J. 1997, in AIP Conf. Ser. 393, Star Formation Near and Far VII, ed. S. S. Holt & L. G. Mundy (Woodbury N. Y.: AIP), 3
- Smith et al. (1978) Smith, L. F., Biermann, P., Mezger, P. G. 1978, A&A, 66, 65
- Sridharan et al. (2002) Sridharan, T. K., Beuther, H., Schilke, P., Menten, K. M., Wyrowski, F. 2002, ApJ, 566, 931
- Starck et al. (1998) Starck, J.-L., Murtagh, F., Bijaoui, A. 1998, Image Processing and Data Analysis: The Multiscale Approach, Cambridge: Cambridge Univ. Press
- Tapia et al. (2001) Tapia, M., Bohigas, J., Pérez, B., Roth, M., Ruiz, M. T. 2001, RMxAA, 37, 39
- Valdettaro et al. (2001) Valdettaro, R., Palla, F., Brand, J., Cesaroni, R., Comoretto, G., Di Franco, S., Felli, M., Natale, E., Palagi, F., Panella, D., Tofani, G. 2001, A&A, 368, 845
- van der Tak (2002) van der Tak, F. F. S. 2002, in ASP Conf. Ser. 267, Hot Star Workshop III: The Earliest Phases of Massive Star Birth, ed. P. A. Crowther (San Francisco: ASP), 33
- Walsh et al. (1998) Walsh, A. J., Burton, M. G., Hyland, A. R., Robinson, G. 1998, MNRAS, 301, 640
- Wilking & Lada (1983) Wilking, B. A., Lada, C. J 1983, ApJ, 274, 698
- Wilson et al. (1970) Wilson, T. L., Mezger, P. G., Gardner, F. F., Milne, D. K. 1970, A&A, 6, 364
- Wood & Churchwell (1989) Wood, D. O. S., Churchwell, E. 1989, ApJ, 340, 265
- Zoonematkermani et al. (1990) Zoonematkermani, S., Helfand, D. J., Becker, R. H., White, R. L., Perley, R. A. 1990, ApJS, 74, 181
| Fragment | Coordinates | FWHM a | b | / c | ||||
|---|---|---|---|---|---|---|---|---|
| name | [] | [pc pc] | [Jy] | [Jy] | [] | |||
| W43-MM1 | 18:47:47.0 | -1:54:28 | 3.870 | 6.490 | 340 | 3.1 | 0 | |
| W43-MM2 | 18:47:36.7 | -2:00:52 | 1.810 | 2.920 | 246 | 3.5 | 0⋆ | |
| W43-MM3 | 18:47:41.7 | -2:00:26 | 1.070 | 1.880 | 140 | 3.4 | 10⋆ | |
| W43-MM4 | 18:47:38.3 | -1:57:44 | 0.620 | 1.060 | 59 | 3.2 | 10 | |
| W43-MM5 | 18:47:46.3 | -1:54:34 | 0.210 | 0.210 | 0 | |||
| W43-MM6 | 18:47:35.6 | -1:55:16 | 0.290 | 0.960 | 65 | 3.3 | 10 | |
| W43-MM7 | 18:47:39.6 | -1:58:34 | 0.330 | 1.580 | 170 | 3.7 | 0 | |
| W43-MM8 | 18:47:37.0 | -1:55:28 | 0.290 | 1.190 | 33 | 2.6 | 40 | |
| W43-MM9 | 18:47:44.8 | -1:54:43 | 0.310 | 0.540 | 56 | 3.6 | 0 | |
| W43-MM10 | 18:47:39.2 | -2:00:30 | 0.280 | 0.410 | 23 | 3.2 | 0⋆ | |
| W43-MM11 | 18:47:39.7 | -1:57:25 | 0.260 | 0.370 | 11 | 2.7 | 10 | |
| W43-MM12 | 18:47:35.9 | -2:01:16 | 0.150 | 0.180 | 17 | 3.6 | 10⋆ | |
| W43-MM13 | 18:47:36.0 | -2:01:54 | 0.250 | 0.530 | 11 | 2.4 | 30⋆ | |
| W43-MM14 | 18:47:38.8 | -1:56:49 | 0.240 | 0.490 | 16 | 2.7 | 20 | |
| W43-MM15 | 18:47:35.2 | -1:56:36 | 0.240 | 0.690 | 10 | |||
| W43-MM16 | 18:47:40.1 | -1:53:34 | 0.210 | 0.470 | 0 | |||
| W43-MM17 | 18:47:42.5 | -1:59:38 | 0.220 | 0.560 | 47 | 3.5 | 0 | |
| W43-MM18 | 18:47:35.6 | -2:02:14 | 0.190 | 0.330 | 25 | 3.4 | 0⋆ | |
| W43-MM19 | 18:47:33.7 | -1:55:25 | 0.180 | 0.490 | 40 | |||
| W43-MM20 | 18:47:36.4 | -1:56:41 | 0.160 | 0.260 | 40 | |||
| W43-MM21 | 18:47:39.3 | -1:53:53 | 0.160 | 0.390 | 65 | 4.0 | 0 | |
| W43-MM22 | 18:47:27.0 | -2:00:36 | 0.170 | 0.610 | 31 | 3.1 | 10⋆ | |
| W43-MM23 | 18:47:41.7 | -1:53:23 | 0.150 | 0.250 | 0 | |||
| W43-MM24 | 18:47:55.9 | -1:53:30 | 0.160 | 0.670 | 0⋆ | |||
| W43-MM25 | 18:47:27.6 | -1:56:55 | 0.110 | 0.170 | 10 | |||
| W43-MM26 | 18:47:40.8 | -1:54:21 | 0.150 | 0.410 | 37 | 3.5 | 0 | |
| W43-MM27 | 18:47:42.6 | -1:56:17 | 0.130 | 0.210 | 15 | 3.4 | 0 | |
| W43-MM28 | 18:47:33.7 | -2:01:03 | 0.130 | 0.190 | 0⋆ | |||
| W43-MM29 | 18:47:52.4 | -1:54:57 | 0.140 | 0.180 | 10⋆ | |||
| W43-MM30 | 18:47:30.2 | -2:00:46 | 0.140 | 0.560 | 22 | 2.9 | 0⋆ | |
| W43-MM31 | 18:47:40.5 | -1:58:52 | 0.120 | 0.240 | 14 | 3.2 | 0 | |
| W43-MM32 | 18:47:38.5 | -1:55:28 | 0.120 | 0.210 | 12 | 3.2 | 70 | |
| W43-MM33 | 18:47:50.2 | -1:54:04 | 0.110 | 0.200 | 0⋆ | |||
| W43-MM34 | 18:47:27.9 | -2:01:19 | 0.090 | 0.150 | 10⋆ | |||
| W43-MM35 | 18:47:32.9 | -1:57:14 | 0.100 | 0.340 | 0 | |||
| W43-MM36 | 18:47:27.1 | -1:57:43 | 0.090 | 0.120 | 0 | |||
| W43-MM37 | 18:47:27.6 | -1:56:36 | 0.110 | 0.140 | 10 | |||
| W43-MM38 | 18:47:24.3 | -1:55:59 | 0.100 | 0.450 | 10 | |||
| W43-MM39 | 18:47:42.3 | -1:52:11 | 0.090 | 0.230 | 0⋆ | |||
| W43-MM40 | 18:47:26.6 | -1:57:22 | 0.090 | 0.190 | 0 | |||
| W43-MM41 | 18:47:25.3 | -1:56:55 | 0.090 | 0.270 | 10 | |||
| W43-MM42 | 18:47:41.3 | -1:59:23 | 0.070 | 0.110 | 0 | |||
| W43-MM43 | 18:47:27.4 | -1:56:08 | 0.080 | 0.170 | 10 | |||
| W43-MM44 | 18:47:36.4 | -1:58:17 | 0.080 | 0.170 | 22 | 3.8 | 0 | |
| W43-MM45 | 18:47:34.4 | -1:57:02 | 0.070 | 0.070 | 0 | |||
| W43-MM46 | 18:47:56.8 | -1:55:02 | 0.070 | 0.070 | 10⋆ | |||
| W43-MM47 | 18:47:30.9 | -1:57:41 | 0.070 | 0.140 | 0 | |||
| W43-MM48 | 18:47:38.1 | -1:59:10 | 0.070 | 0.120 | 0 | |||
| W43-MM49 | 18:47:47.9 | -1:54:01 | 0.090 | 0.090 | 0 | |||
| W43-MM50 | 18:47:25.1 | -1:55:24 | 0.060 | 0.170 | 20 | |||
| W43-MM51 | 18:47:34.7 | -2:01:02 | 0.070 | 0.070 | ⋆ | |||
| Fragment | Molecular | Component | ||||
|---|---|---|---|---|---|---|
| name | transition | number | [km s-1] | [K] | [K km s-1] | [km s-1] |
| W43-MM1 | H13CO+(3-2) | 1 | 98.8 | 8.2 | 5.9 | |
| W43-MM2 | H13CO+(3-2) | 1 | 90.8 | 4.6 | 4.2 | |
| W43-MM3 | H13CO+(3-2) | 1 | 93.5 | 3.8 | 4.4 | |
| W43-MM4 | HCO+(3-2) | 1 | 91.8 | 17.5 | 5.1 | |
| 2 | 97.6 | 6.0 | 3.1 | |||
| H13CO+(3-2) | 1 | 92.0 | 4.4 | 2.7 | ||
| 2 | 97.3 | 0.7 | 3.2 | |||
| W43-MM6&8 | HCO+(3-2) | 1 | 94.4 | 20.9 | 8.3 | |
| H13CO+(3-2) | 1 | 94.3 | 2.4 | 6.3 | ||
| W43-MM7 | HCO+(3-2) | 1 | 90.6 | 3.9 | 4.4 | |
| 2 | 97.4 | 6.7 | 3.7 | |||
| H13CO+(3-2) | 1 | 91.9 | 0.7 | 3.7 | ||
| 2 | 96.0 | 0.7 | 2.2 | |||
| W43-MM9 | H13CO+(3-2) | 1 | 96.0 | 3.6 | 5.5 | |
| W43-MM10 | H13CO+(3-2) | 1 | 92.9 | 2.3 | 3.7 | |
| W43-MM11 | HCO+(3-2) | 1 | 91.5 | 14.4 | 6.7 | |
| H13CO+(3-2) | 1 | 91.8 | 3.2 | 3.8 | ||
| W43-MM14 | HCO+(3-2) | 1 | 89.9 | 6.6 | 6.1 | |
| W43-MM15&20 | HCO+(3-2) | 1 | 81.0 | 2.4 | 4.8 | |
| 2 | 87.0 | 0.9 | 3.5 | |||
| 3 | 94.4 | 4.2 | 6.8 | |||
| 4 | 107.7 | 0.7 | 6.0 | |||
| W43-MM25 | HCO+(3-2) | 1 | 92.3 | 3.5 | 4.9 |
| Fragment | a | nb | ||
|---|---|---|---|---|
| name | [K] | [] | [] | [] |
| W43-MM1 | 20 | 3590 | 1040 | |
| W43-MM2 | 20 | 1620 | 490 | |
| W43-MM3 | 20 | 960 | 610 | |
| W43-MM4 | 20 | 520 | ||
| W43-MM5 | 20 | 110 | ||
| W43-MM6 | 20 | 500 | 2930⋆ | |
| W43-MM7 | 20 | 870 | ||
| W43-MM8 | 20 | 390 | 2930⋆ | |
| W43-MM9 | 20 | 290 | 920 | |
| W43-MM10 | 20 | 230 | 270 | |
| W43-MM11 | 20 | 190 | 530 | |
| W43-MM12 | 20 | 90 | ||
| W43-MM13 | 20 | 200 | ||
| W43-MM14 | 20 | 230 | 1260 | |
| W43-MM15 | 30 | 200 | ||
| W43-MM16 | 20 | 260 | ||
| W43-MM17 | 20 | 310 | ||
| W43-MM18 | 20 | 180 | ||
| W43-MM19 | 20 | 180 | ||
| W43-MM20 | 30 | 50 | ||
| W43-MM21 | 20 | 210 | ||
| W43-MM22 | 20 | 320 | ||
| W43-MM23 | 20 | 140 | ||
| W43-MM24 | 20 | 370 | ||
| W43-MM25 | 30 | 50 | 490 | |
| W43-MM26 | 20 | 230 | ||
| W43-MM27 | 20 | 110 | ||
| W43-MM28 | 20 | 110 | ||
| W43-MM29 | 20 | 90 | ||
| W43-MM30 | 20 | 300 | ||
| W43-MM31 | 20 | 130 | ||
| W43-MM33 | 20 | 110 | ||
| W43-MM34 | 20 | 70 | ||
| W43-MM35 | 30 | 110 | ||
| W43-MM36 | 30 | 40 | ||
| W43-MM37 | 30 | 40 | ||
| W43-MM38 | 30 | 140 | ||
| W43-MM39 | 20 | 120 | ||
| W43-MM40 | 30 | 60 | ||
| W43-MM41 | 30 | 80 | ||
| W43-MM42 | 20 | 60 | ||
| W43-MM43 | 30 | 50 | ||
| W43-MM44 | 20 | 100 | ||
| W43-MM45 | 30 | 20 | ||
| W43-MM47 | 30 | 50 | ||
| W43-MM48 | 20 | 60 | ||
| W43-MM49 | 20 | 50 | ||
| W43-MM51 | 20 | 40 |