Radio Observations of Supernova Remnants
Abstract
Supernovae release an enormous amount of energy into the interstellar medium. Their remnants can observationally be traced up to several ten-thousand years. So far more than 230 Galactic supernova remnants (SNRs) have been identified in the radio range. Detailed studies of the different types of SNRs give insight into the interaction of the blast wave with the interstellar medium. Shock accelerated particles are observed, but also neutron stars left from the supernova explosion make their contribution. X-ray observations in conjunction with radio data constrain models of supernova evolution.
A brief review of the origin and evolution of SNRs is given, which are compared with supernova statistics and observational limitations. In addition the morphology and characteristics of the different types of SNRs are described, including some recent results and illustrated by SNRs images mostly obtained with the Effelsberg 100-m telescope.
1 Introduction
Supernova explosions (SNe) belong to the most spectacular events in space. Historical SNe could be traced by the naked eye. Systematic observations of galaxies reveal several events every year, where the SN is of comparable brightness to the entire galaxy for days up to weeks. SNRs belong to the strongest radio sources observed. The first identification of a SNR in the radio range was published by Bolton et al. ([1949]), associating the Crab nebula with the radio source Taurus A. Subsequently many more SNRs have been identified and studied in great detail at radio wavelength, which were complemented and extended in recent years by X-ray studies as reviewed by Bernd Aschenbach (this volume). SNe and SNRs have a major influence on the properties of the interstellar medium (ISM) and by their coordinated impact on the evolution of galaxies as a whole. They enrich the ISM by heavy elements, release about ergs and their blast waves shape and heat the ISM, compress the magnetic field and accelerate in their shock waves quite efficiently energetic cosmic rays as observed throughout the Galaxy. They were suggested to trigger star formation and neutron stars are left from SN events.
2 Supernova events
SN have been classified by their optical spectra: SNI with Balmer lines and SNII without Balmer lines. Meanwhile a number of sub-groups have been introduced. Important are their explosion mechanisms depending on the mass of the progenitor stars, as there are thermo-nuclear burning and core collapse events. A core collapse needs a more massive star (SNIb/c, SNII-P) than SN from thermo-nuclear burning (SNIa, SNII-L). Core collapse events leave a neutron star, while from thermo-nuclear burning a pure blast wave results.
SN rates depend on star formation and therefore the different SN rates depend on the type of galaxies (Cappellaro et al. [1999]). From these results a SN rate in the Milky Way is expected to be in the range of one SN in about 30 to 50 years. About 80% of SN should be core collapse events and only 20% are expected to release pure blast waves showing up as radio shells.
3 SNR catalogues, statistics and completeness
There are two useful SNR compilations accessible through the web. One is David Green’s catalogue (http://www.mrao.cam.ac.uk/surveys/snrs), where in its December 2001 version data and references for 231 SNRs are compiled including information also from optical, infrared and X-ray observations. Another useful database is that maintained by Sergei Trushkin (http://cats.sao.com) with radio flux densities, spectra and references. A limited number of SNRs is seen at optical, infrared and X-ray wavelength. Increased sensitivity resulted in more detections. In particular in the X-ray range based on the ROSAT all-sky survey a large number of SNR candidates have been identified (Busser [1998]). Thus it seems possible that the present fraction of 30% of SNRs showing up at X-rays will be increased, although the low integration times in the ROSAT survey, its relatively soft energy range and significant absorption for objects at larger distances in the Galactic plane are limitations. Meanwhile for some cases subsequent radio observations could prove the SN origin of ROSAT candidates (see Schaudel et al., this volume).
The data in the catalogues are either from dedicated studies or from radio continuum surveys. To what extent are the collected data complete? From statistics about 40 SN should have occurred in the Galaxy within the last two thousand years, although just eight are detected. As expected the two strongest SNRs, which are also the strongest sources in the sky, are Cas A and Tau A from A.D.1680 and A.D.1054, respectively. It is unlikely that the present sensitivity of radio surveys is insufficient to detect such sources throughout the Galaxy when exploding in a typical interstellar environment. Certainly massive stars are clustered and in case they explode within very dense molecular clouds the lifetime of SNRs is reduced substantially. Compact H ii regions have a similar spectrum compared to plerions (as discussed in section 7), although the thermal emission from H ii regions is unpolarized. However, confusion problems may be present.
For elder SNRs, which are expected to be intrinsically fainter than young SNRs, the fraction of undetected SNRs may be similar or even larger. From the 231 SNRs listed by Green just 9 SNRs are pure plerions and 23 are classified as combined-type objects, e.g. a shell-type SNR with a synchrotron nebula inside being powered by the neutron star. These two groups make up about 15% of all known SNRs, while from SN events about 80% are expected to leave a neutron star and their remnants should be plerions or combined-type SNRs. Beside the selection effects due to very dense material, which largely reduces the SNR lifetime, a number of additional effects have to be considered, which make the available SNR catalogues much likely rather incomplete. The blast wave of SNRs expanding in a hot and thin interstellar medium may reach quite a large size until enough material is swept up to interact with. Faint objects with a diameter of several degrees are difficult to identify in practice, even when offset from the Galactic plane. The task is even more difficult when a regular shell is distorted by fluctuations in the interstellar medium, which are quite likely to be present. In the Galactic plane itself, with a high concentration of sources and diffuse emission, confusion effects are severe and sufficient high intensity and/or an undistorted morphology of the SNR is required to be detected. High depolarization at lower frequencies limits the search for polarized Galactic sources in addition.
4 Identification of SNRs
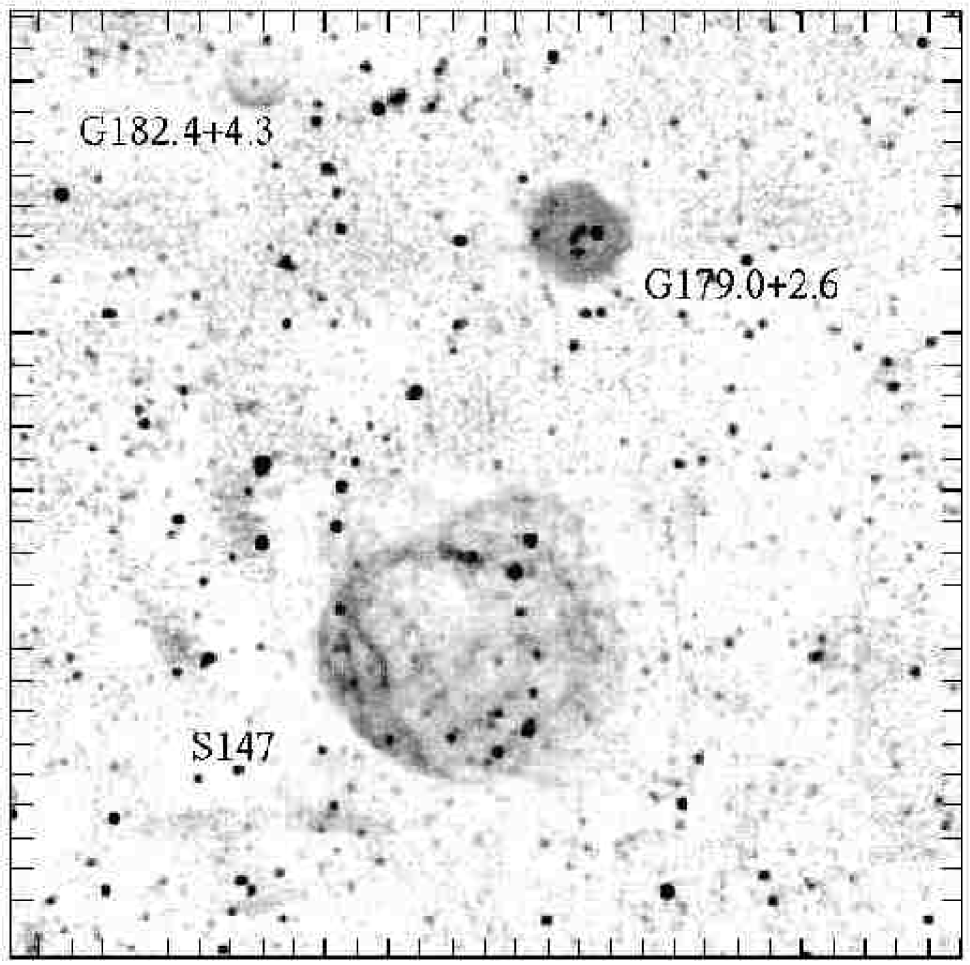
Radio continuum surveys are the main source for identifying new SNRs. The Effelsberg surveys of the Galactic plane at 1.4 GHz and 2.7 GHz wavelength were quite successful. References and the data are accessible through the web: http://www.mpifr-bonn.mpg.de/survey.html. Figure 1 shows a section from the 2.7 GHz survey towards the Galactic anti-center, where the well-known SNR S147 is located, which shows a rather similar morphology at radio and optical wavelength. Two fainter SNRs as indicated in Fig. 1 could be identified (Fürst & Reich [1986a], Kothes et al. [1998]). Also the more recent Molonglo survey at 860 MHz covering the southern Galactic plane led to a large number of new identifications (Whiteoak & Green [1996]). Of course, the newly detected objects are on average fainter than previously known sources. Surveys at arcmin angular resolution are not able to identify very compact, barely resolved sources and synthesis telescope surveys are required like the VLA 1.4 GHz NVSS (Condon et al. [1989]) or the 408 MHz and 1.4 GHz CGPS survey carried out at DRAO (Taylor et al. [2002]). Also the 327 MHz Westerbork survey needs to be mentioned in that context (Taylor et al. [1996]). However, synthesis telescope surveys have the disadvantage of being insensitive to large-scale structures and despite their low confusion limit are often not able to measure extended objects reliably.
Morphology, e.g. shell-type sources, linear polarization and non-thermal spectral indices are the classical tools to identify new SNRs. The technique of comparing radio maps from the Effelsberg surveys with those from the IRAS 60m or 100m surveys, which have similar angular resolutions, was quite successful in identifying new SNRs, since the ratio of infrared to radio flux for H ii regions is about an order of magnitude stronger than that for SNRs (Fürst et al. [1987]). Although significant variations in the infrared to radio ratio of H ii regions are evident, there is a clear distinction compared to SNRs, which is in addition independent of the type of SNR.
5 Shell-type SNRs
The vast majority of identified SNRs are of shell-type. This morphology is expected when releasing a strong blast wave with an initial expansion velocity of the order of 20000 km/sec. An estimated energy of about ergs is released into the interstellar space. In his classical paper Woltjer ([1972]) described the following phases of the evolution of a shell-type SNR with an initial energy ergs into a homogeneous interstellar medium with density .
Free expansion: the blast wave expands with its initial velocity and the radius of the SNR increases linear with time. This phase ends until about 1 to 10 M⊙ of material are swept up from the ambient medium in the SNR shell.
Adiabatic expansion or Sedov phase: the energy of the SNR is conserved. The radius increases as , with t in units of years. The expansion velocity of the SNR decreases accordingly. The density in the shell is and its thickness is about 10% of . This phase of SNR evolution ends when about half of its initial energy is released. According to Cox ([1972]) this phase ends when the age t of the SNR is , its radius is and its expansion velocity .
Finally the SNR enters the radiative phase until its initial energy is released to the ISM. In this phase radius and expansion velocity are and . The SNR merges with the interstellar medium at and .
Although this evolution scenario describes the phases of SNR evolution in principle correctly as proven by observations, it is certainly a simplification. The assumption of a constant density of the ISM during all phases of SNR evolution is not realistic. The effect of the stellar wind from the massive progenitor star modifies the ISM and the young SNR evolves in a quite thin medium and later will encounter the dense material previously swept up by the stellar wind (McKee et al. [1984]). Inhomogeneities of the ISM may distort a regular SNR shell, gradients in density may cause an elliptical shape and low density bubbles may lead to “break-out” phenomena. Also the structure and regularity of the ambient interstellar magnetic field shapes SNRs (van der Laan [1962]) and barrel-shaped structures might result. These in turn indicate the direction and homogeneity of the ambient magnetic field.
5.1 Synchrotron emission
SNRs are strong emitter of synchrotron emission and their spectra can well be described by a power law , with S the observed flux density and the observing frequency. The SNR blast wave sweeps up and compresses the ambient magnetic field that an enhanced volume emissivity results. In this case the spectrum of a SNR reflects the cosmic ray electron spectrum, which steepens towards higher energies, and the spectral index varies accordingly. The strong magnetic field shifts spectral variations towards higher frequencies. In addition the strong shock at the SNR blast wave also induces turbulences, which are able to accelerate particles up to very high energies. Known processes are Fermi I and Fermi II acceleration.
The majority of SNRs are in the adiabatic phase and have spectra around . This is expected for a strong shock and a compression factor of 4. Their magnetic field is tangential. Young (historical) SNRs show steeper spectra ( to 0.8) on average. Their magnetic field is radial.
5.2 Very young SNRs
Sensitivities in the mJy range are required to observe SN in nearby galaxies and a number of SN events have been measured in recent years. A quite well-studied example is SN1993J (a IIb type) in M81. The first radio detection was about 4 days after the explosion, when about 0.8 mJy were seen at 22 GHz. A steady rise of the flux density to about 1.7 mJy about 50 days later was noted. Afterwards the flux density slowly declined. At lower frequencies radio emission was seen delayed as is expected for an optically thick source. The optical thickness decreases with expansion. Pérez-Torres et al. ([2001]) fitted the observed radio light curves for a number of frequencies and in fact found evidence for synchrotron self-absorption, however, external free-free absorption was required in addition.
Today’s high sensitivity VLBI technique allows to follow also the spatial evolution of young SNRs. Marcaide et al. ([1997]) analyzed a sequence of VLBI images for the first 42 months of SN1993J and found an increase of its radius with time as , which is close to – although definitely not identical with – a linear expansion of the blast wave. Although the images show some intensity variations in the shell Marcaide et al. ([1997]) suggest some residual effect in the image restoration, but take its almost circular shape as evidence for a symmetric explosion.
5.3 Historical SNRs
Until recently historical SNRs resulting from SN events within the last 2000 years were mostly identified via optical flaring events noted in ancient records. There are the shell-type sources SN 1006, Tycho and Kepler. The plerions Tau A and 3C58 and the combined-type SNR G11.20.3. In addition the shell-type SNRs Cas A and RXJ0852.04622 belong to this group, where the detection of the short living with a mean lifetime of 90.4 years proves their young age. Cas A was previously believed to originate from a SN event in 1680, but no clear optical record exists. RXJ0852.04622 is not an outstanding radio source, but has been clearly detected in a follow-up search in a highly confused region of the sky (Duncan et al. [1996]).
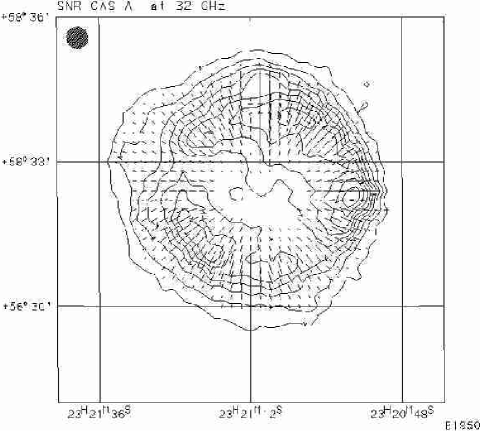
In Figure 2 we show a 32 GHz image of Cas A obtained with the Effelsberg 100-m telescope. Although its spectrum is quite steep with a spectral index of , it is nevertheless one of the strongest sources at mm-wavelength. As expected its magnetic field is almost perfectly radial. Along its outer northern rim Gotthelf et al. ([2001]) recently found evidence for a weak tangential component at its outer shock, indicating that Cas A is leaving free expansion and begins to enter the Sedov phase. The considerable total intensity variations along the shell indicate some influence of an inhomogeneous interacting medium.
5.4 Adiabatic phase
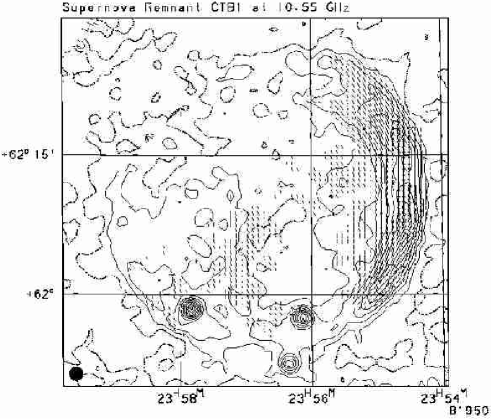
As mentioned earlier most of the detected SNRs are in the adiabatic phase with a spectral index close to . Figure 3 shows an image of CTB 1 at 10.55 GHz (Schmidt et al. [1993]) with a spectral index of . This SNR is located at a distance of about 2 kpc as found from associated neutral hydrogen (Landecker et al. [1982]) and has a diameter of about 21 pc. A well-defined shell with a tangential magnetic field is seen along its western periphery. In the south and south-east the shell is still visible, but less pronounced and is almost missing in the north-eastern quadrant. Likely the ISM density is lower in this region, which is supported by X-ray emission extending beyond the circular shell periphery and indicating some kind of ‘break-out’, where the blast wave expands faster and less material is swept up.
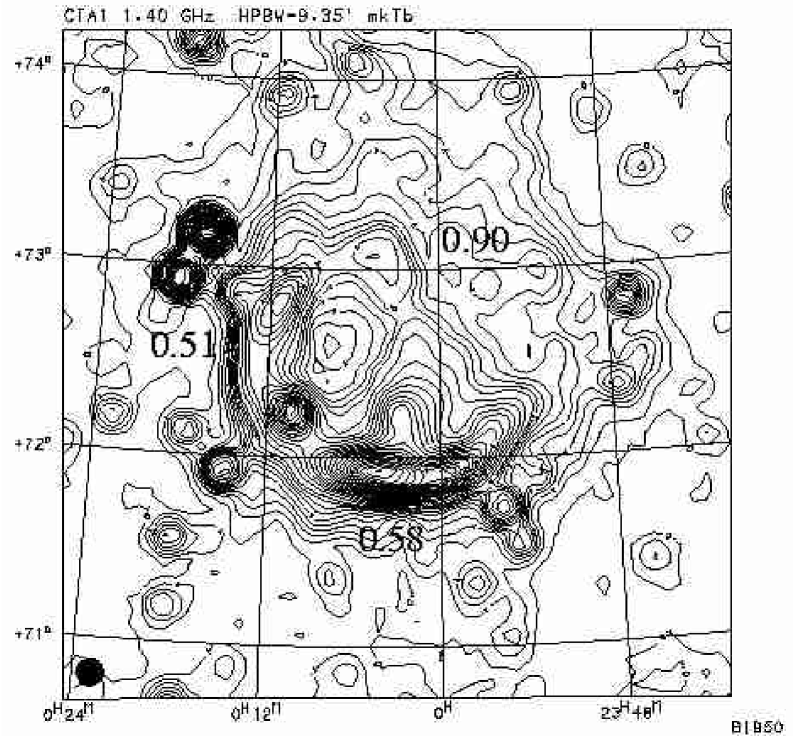
Another example of the ‘break-out’ phenomenon is indicated for CTA 1, a high latitude SNR at an estimated distance of about 1.4 kpc. CTA 1 has a flat-spectrum non-thermal X-ray core, in addition thermal X-ray emission related to the blast wave of the SNR and seems to be associated to the -ray source J000702+7302.9 (Slane et al. [1997]). Thus CTA 1 has features not in common to the majority of adiabatic SNRs and may be classified as composite SNR from its X-ray morphology. However, details of its radio emission can well be studied due to its location out of the plane. A 1.4 GHz map (Pineault et al. [1997]) is displayed in Fig. 5, where also the spectral indices in the shell and in the ‘break-out’ region are indicated. There are significant spectral differences of the order of between the intense shells and the diffuse emission extending towards the north-west. Pineault et al. ([1997] discuss this effect in terms of Fermi acceleration in shocks and found it possible to account the steepening of the spectrum by expansion of the SNR into a low density region with small compression ratio.
SNRs in the adiabatic phase show a number of effects from their interaction with the ISM, thus reflecting the properties of their environment, which might be additionally largely shaped by the effect of the stellar wind from the progenitor star. Some of these effects are briefly discussed in turn:
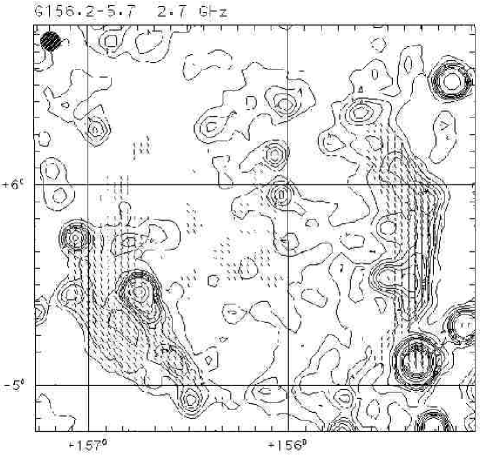
The bi-symmetric morphology and the tangential magnetic field in the shell has been used to derive the orientation of the interstellar magnetic field. Objects with the most clear morphology have the most uniform environment. The inclination of the magnetic field to the Galactic plane is small in most cases as expected for a magnetic field orientation along the spiral arms. However, some SNRs show larger deviations. The highly polarized low surface-brightness SNR G156.2+5.7 (Fig. 4), for instance, is inclined by about . Although its distance is not well constrained (1 kpc to 3 kpc), its size ranges between 33 pc and 95 pc and therefore the inferred regular magnetic field orientation holds for a region similar or larger in size.
Rotation measure (RM) observations reveal the direction of the magnetic field in the SNR shell of thickness l along the line of sight. RM is calculated: , where is the thermal electron density. Polarization angles at three frequencies are required to get an RM without ambiguity and with the correct sign, where . Again, in most cases the magnetic field direction agrees with the global field as inferred from averaging RMs of extragalactic sources and pulsars. But there are exceptions as already noted by Fürst & Reich ([1990]). Recently, Uyanıker et al. ([2002]) made a detailed analysis of the polarization data of G93.70.3 (CTB104A), where a RM gradient across the source was measured. This does not agree with the direction of the global magnetic field at the distance of the SNR of about 1.5 kpc, but agrees with a similar anomaly in the RM data of pulsars. The size of the SNR of about 35 pc is quite likely a rather conservative lower limit of this RM anomaly.
SNRs are supposed to trigger star formation, but just few observations have been made to settle that topic. Molecular clouds interacting with SNRs are the most promising cases where the blast wave may lead to large density enhancements. In a study of G54.40.3 Junkes et al. ([1992]) found evidence for a massive molecular shell surrounding the SNR. While the average density is about , a number of higher density clumps (density are embedded. A detailed analysis showed that the SNR blast wave is likely not responsible, but the stellar wind of the progenitor star has formed the molecular shell.
Shocked molecular gas in interacting clouds is direct evidence for the interaction of the blast wave. The prototype SNR for associated shocked molecular gas is IC443, but also other SNRs show shocked gas. The association of -ray sources with interacting SNRs is clearly established and reflects the absorption of high energy cosmic rays just accelerated in the SNR shock-front with dense gas.
For a larger number of SNRs OH maser emission was clearly detected. These observations indicate small condensations within the SNR shell, where the magnetic field strength ranges up to about 0.5 mGauss (Claussen et al. [1997]).
5.5 Evolved SNRs
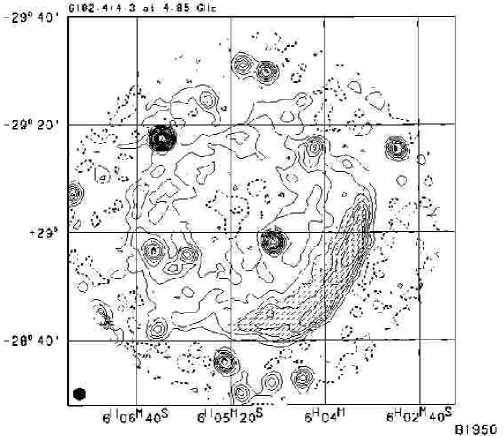
When the SNR enters the radiative phase its shell is highly compressed, although its interior remains hot as its cooling time is longer and therefore is still detectable by X-ray observations. S147 (see Fig. 1) is an example of this class of SNRs. Its filamentary radio morphology is also seen optically with a perfect correspondence for many substructures (Fürst & Reich [1986b]). Evolved SNRs become faint and their surface brightness , which is calculated from , becomes rather low. Here S is the observed flux density and is the measured diameter of the SNR. For convenience is at most calculated for 1 GHz flux densities. is distance-independent and the –diameter relation was used for distance estimates, assuming the density of the ISM to be fairly uniform. This turns out to be not relevant, and in consequence large density differences reflect in at a certain diameter. However, Berkhuijsen ([1983]) combined Galactic SNR data with well-defined distances and surface-brightness data from SNRs in nearby galaxies. She concluded that for a given a maximum diameter can be inferred. Accordingly S147 has a rather low surface brightness of . However, the surface brightness of G179.3+2.6 () and G182.4+4.3 () (see Fig. 1) is even lower, although they do not show the properties of evolved SNRs like S147 (Fürst & Reich [1986a], Kothes et al. [1998]). It is most likely that G182.4+4.3 is in the adiabatic phase of expansion. Figure 6 displays a 4.85 GHz Effelsberg image showing a tangential magnetic field and also its spectral index of is in agreement with SNRs in the adiabatic phase. It is remarkable that its size of about 45 pc is not much smaller compared to that of S147 (42 pc to 82 pc), despite the large systematic uncertainties for S147.
Evolved SNRs with a compressed magnetic field where no particle acceleration takes place any longer reflect the Galactic electron spectrum with its known bends in their spectra, although the compressed magnetic field shifts the observing frequencies. S147 shows all these characteristics (Fürst & Reich [1986b]). Its integrated flux-density spectrum bends at about 1 GHz. However, the spectrum of its filaments is flatter than that of the diffuse emission. Due to the more compressed magnetic field in the filaments radiation from low-energy electrons with a flatter energy spectrum are seen. In the diffuse part of the source the lower magnetic field strength traces emission from electrons with higher energies, which have a steeper energy spectrum.
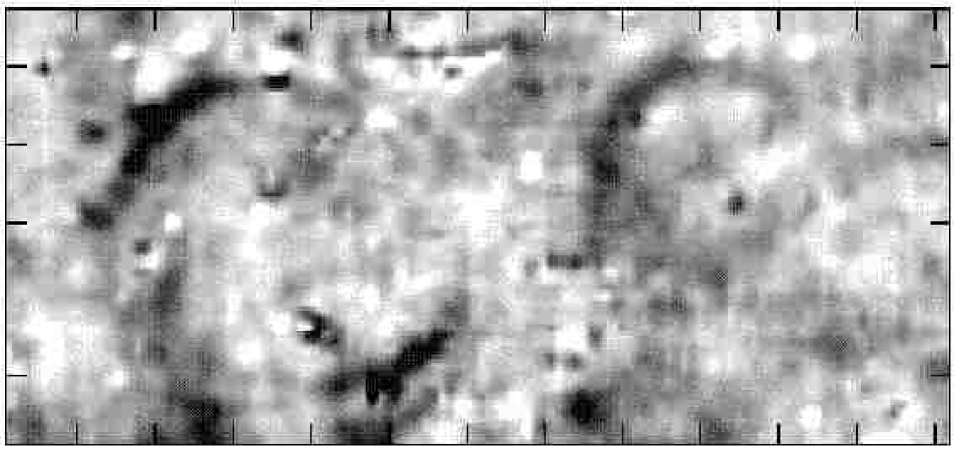
Despite the remaining uncertainty in classifying a SNR from its low surface brightness, more identifications of these weak sources are of interest to understand SNR evolution and their impact on the ISM. Faint large-diameter objects are filtered out by synthesis telescope observations, while the sensitivity of single-dish observations is limited by confusion of faint unresolved extragalactic sources in their larger beams. An improvement seems possible, when deep-source surveys and single-dish surveys exist at the same frequency and the source contribution can be well subtracted from the single-dish map. An example of such an attempt is shown in Fig. 7, where the noise in the original 1.4 GHz Effelsberg map (Uyanıker et al. [1999]) was significantly lowered by subtracting all compact sources visible in the NVSS (Condon et al. [1989]). Two shells or partial shells are visible in Fig. 7 with diameter of about or . The surface brightness is estimated to about and .
6 Pulsar–SNR associations
Although Pulsar (PSR)–SNR associations are expected to be quite common, as they result from a core collapse event, the number of identifications is still small. Before 1980 just Tau A and the Vela SNR were known to have an associated PSR. Since then a number of new detections were made. Until now about 20 associations were identified based on sensitive X-ray as well as on radio observations. Proven associations show young neutron stars, allowing to determine their properties including beaming and birth rate. Better age and distance estimates become possible. PSR distances are inferred from H i absorption, their RM and dispersion measure (DM), while SNR distances are estimated from H i absorption, associated H i clouds or molecular emission structures.
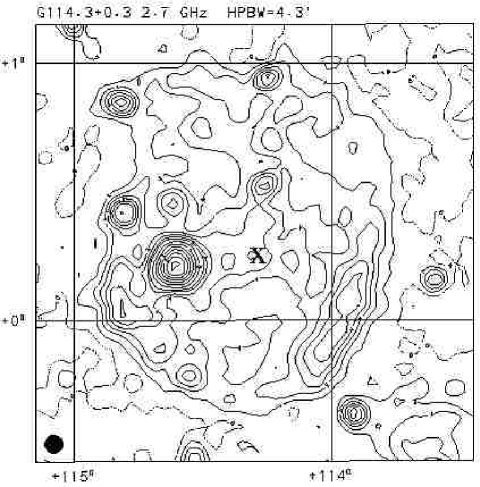
S147, as discussed in the previous section as an example of an evolved SNR, has a 143 msec PSR detected in 1996 at about from the center of the SNR (Anderson et al. [1996]). Another example is G114.3+0.3/PSR2334+61 as shown in Fig. 8. This low surface brightness object has a 0.5 sec PSR close to its center. From combining all available information Fürst et al. ([1993]) concluded that a distance of 2.2 kpc and an age of years is most likely for this association. The inferred transverse velocity of the PSR from the geometric center of the SNR is about 125 km/s, well within the range of PSR velocities.
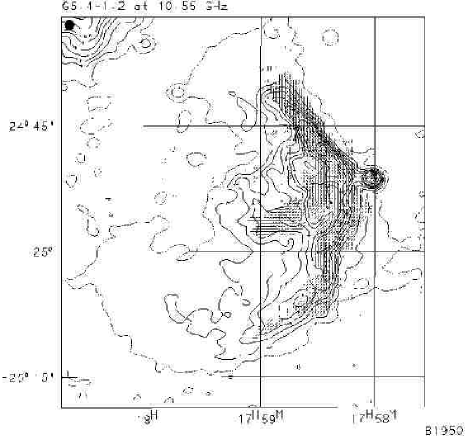
A rather interesting case is the association SNR G5.41.2/PSR B175724. In Figure 9 an image at 10.55 GHz is displayed, where the PSR has overtaken the SNR shell with high velocity. Its cometary tail powered by the pulsar wind is directed towards the SNR center. Gaensler & Frail ([2000]) were able to limit the proper motion of the PSR from multi-epoch VLA measurements. This results in an age estimate 3 to 10 times larger than its ‘characteristic age’, which relates the PSR age to the measured derivative of the rotational frequency.
Recently Kothes et al. ([2001]) observed the association G106.3+2.7/PSR J2229+6114 and found a highly polarized flat-spectrum structure, the ‘boomerang’ ahead of the PSR. This bow-shock structure results from an interaction of the PSR wind with surrounding cold and dense material, likely previously swept up from the stellar wind of the progenitor star of G106.3+2.7.
Kothes ([1998]) found a very close correlation between of PSR nebula, their diameter and the PSR energy loss rate : . This correlation holds for about four orders of magnitude of and must be accounted for by evolutionary models. The correlation seems also useful in predicting PSR parameters from the observed properties of its synchrotron nebula.
7 Plerions and combined-type SNRs
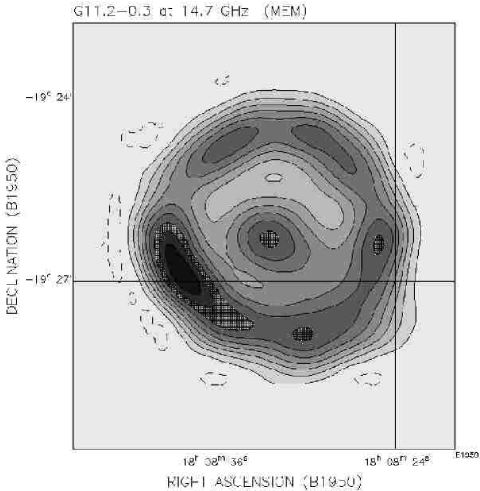
Even in cases where the PSR cannot be detected, its wind of relativistic particles may become pressure-confined and subsequently form isotropically radiating nebula. This classifies the SNR as resulting from a core collapse event. The identification of these flat-spectrum cores within steep non-thermal emission from the SNR shell requires low and high frequency observations to separate both components. An example of this class of objects is G11.20.3, believed to be the SNR from the A.D. 386 supernova. An image is displayed in Fig. 10 (Kothes & Reich [2001]). Recently a 65 msec X-ray pulsar was detected by Torii et al. ([1997]), which was later proved by sensitive CHANDRA observations to be precisely in the center of G11.20.3 (Kaspi et al. [2001]). Thus the supplying source of relativistic particles is identified. Also in this case the characteristic age of about 24000 years largely disagrees with its true age.
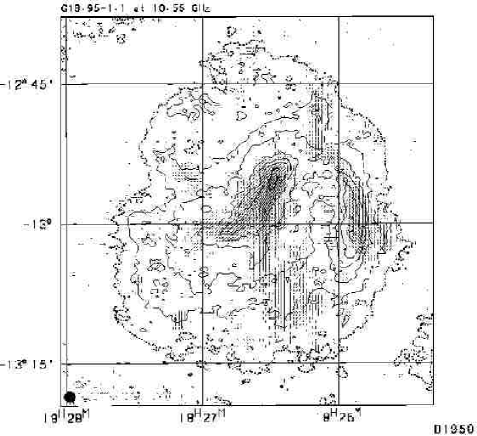
Another somewhat different example of a combined-type SNR, where – despite of dedicated searches – so far no PSR has been identified, is G18.951.1 as shown in Fig. 11. This object exhibits a number of differences compared to G11.20.3 or other combined-type SNR, as it is dominated by flat-spectrum centrally-peaked diffuse emission with filaments running outwards from a central bar-like feature. Its shell is only partial formed. Fürst et al. ([1997]) compared the Effelsberg 10.55 GHz radio image and the X-ray image obtained with the PSPC of ROSAT. A remarkable similarity of the diffuse emission in the radio and X-ray band was noted, suggesting that the synchrotron emissivity and the thermal emissivity are closely related. In case of pressure equilibrium it could be shown that the tangential magnetic field component decreases radially much faster than the total magnetic field strength. A wound-up magnetic field is suggested. For G18.951.1 and also other sources, a simple model of an isotropically expanding PSR-driven synchrotron bubble seems insufficient to account for the observations.
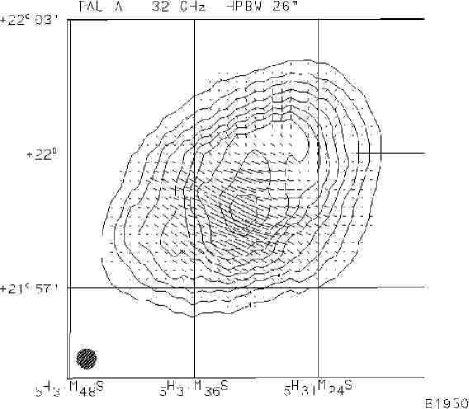
Plerions or Crab-like SNRs, which show up as pure filled-center objects, have Tau A – the Crab nebula – as the prototype source. An image of Tau A is displayed in Fig. 12. Plerions emit flat-spectrum synchrotron emission and are significantly polarized. Despite very deep searches for some objects no radio shell could be identified reflecting the impact of the blast wave from the SN explosion with the ISM. Nevertheless plerions might be considered as a subgroup of combined-type SNRs with quite bright flat-spectrum emission and therefore their low-frequency spectra are better to determine compared to the confused cores of combined-type SNRs. Woltjer et al. ([1997]) discussed the properties of plerions in comparison to Tau A, which has a radio and X-ray luminosity of about two orders of magnitude larger than all other members of the group. While Tau A can well be described by the PSR-powered expanding sphere model of Pacini & Salvati ([1973]), which correctly predicts a spectral steepening of in the infrared due to synchrotron aging, most of the other plerions have spectral breaks in the range of 20 GHz to 50 GHz. This is incompatible with synchrotron aging, and Woltjer et al. ([1997]) considered cases of a non-standard evolution of the PSR injection.
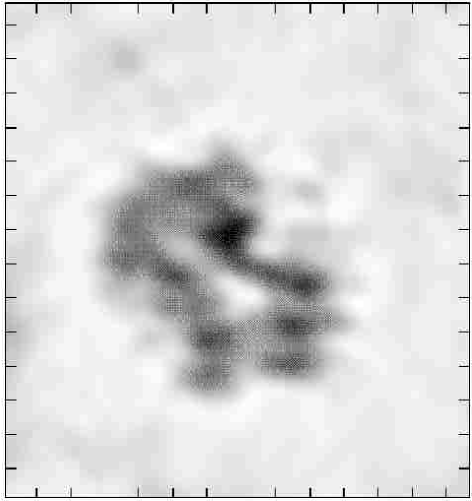
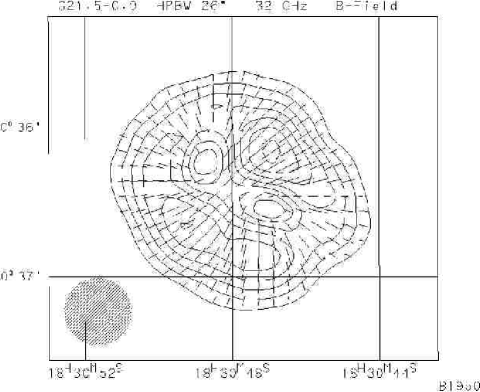
A well-studied case of a plerion is G21.50.9, which was observed with high angular resolution by Fürst et al. ([1988]) using the Nobeyama Array at 22.3 GHz. 80% of its emission originates from a diffuse slightly elliptical centrally peaked component and 20% comes from a double-cone structure as shown in Fig. 13. A PSR is not visible in the radio, but a non-pulsating X-ray emitting compact source is observed (Slane et al. [2000], Warwick et al. [2001]). This source is obviously related to the unseen PSR. The double-cone structure strongly suggests a two-sided collimated outflow from the central PSR along a precessing beam. The diffuse emission shows a very regular radial magnetic field structure as is clearly visible in the Effelsberg 32 GHz image of polarized intensity. Fitting the radial emissivity of G21.50.9 Fürst et al. ([1988]) found as the best solution a constant electron density with a radial linear decrease of the magnetic field, although it must be noted that the fit is not perfect. In any case, G21.50.9 defies the explanation in terms of an expanding synchrotron nebula. Recent X-ray observations reveal weak non-thermal diffuse emission extending fairly symmetric beyond the previously known boundaries to about (Slane et al. [2000], Warwick et al. [2001]). The emission is associated with spectral softening of the emission.
G21.50.9 was detected in the infrared by Gallant & Tuffs ([1998]). They tried to describe available radio, infrared and X-ray data with a broken power-law spectrum with a steeping from to , where the break frequency is at about 200 GHz to 300 GHz. New radio observations with the Effelsberg, Nobeyama and HHT telescopes between 43 GHz and 345 GHz indicate a break frequency at about 20 GHz and a steepening by about (Reich et al., in prep.), thus incompatible with a single spectral break when including infrared as well as X-ray emission. Since synchrotron aging cannot account for such a spectrum, intrinsic properties of the electron spectrum or an unsteady evolution needs to be considered.
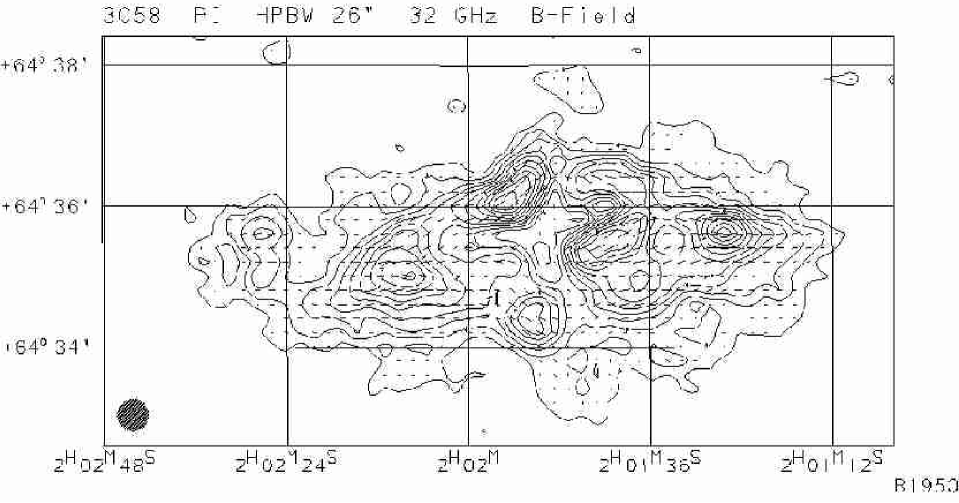
Another plerion known since long to be different from Tau A is 3C58. Its diffuse emission with little small-scale structure is elliptical in shape and shows almost no spatial variations in its spectrum. 3C58 originates from the A.D. 1181 SN event and is located at about 3.2 kpc distance. Recently Camilo et al. ([2002]) detected a very weak 65 ms radio PSR at the center of the SNR. The flux density of 3C58 was reported to increase by about 0.3%/year (Aller & Reynolds [1985], Aller et al. [1986], Green [1987]), which is difficult to understand within current models. 3C58 shows a break in its spectrum around 50 GHz (Salter et al. [1989]), which is confirmed by infrared data (Green & Scheuer [1992]). An image of the distribution of polarized intensity is shown in Fig. 15, where despite of its rather smooth total-intensity distribution, very patchy polarization is visible. Compared to G21.50.9 this reflects a large difference in its internal magnetic field structure from an undisturbed radial magnetic field. The 32 GHz image is rather similar to the 1.4 GHz image of polarized intensities by Wilson & Weiler ([1976]) at about the same angular resolution. This indicates little internal depolarization and the observed polarization structure reflects regular magnetic field cells of the order of 10% of the size of the SNR. However, this does not imply a strongly enhanced magnetic field in these regions because enhanced total intensities are not observed.
8 More radio observations
High-frequency, high-resolution observations with polarization are of particular importance for the identification of combined-type and plerionic SNRs. It should be stressed again that despite all efforts the number of known sources is quite small. High-sensitivity observations are required for the fainter sources of this class in order to constrain their parameters in a comparable way. Faint flat-spectrum cores seen in projection against steep-spectrum shell emission is difficult to extract. The decomposition of diffuse and small-scale emission provides hints towards the particle injection process and the internal magnetic field structure. Details of the spectral break, its relation to the different components and their spatial variation are of interest to model the source evolution or to constrain the particle injection spectrum including its time dependence. Together with X-ray data from CHANDRA and XMM models of the observational properties of this class of SNRs will be substantially improved.
Despite the large number of known shell-type SNRs, there are still ongoing identifications, in particular for large-diameter low-surface brightness objects. To make such identifications at high frequencies is difficult and rather time-consuming. A combination of synthesis-telescope data with single-dish observations to reduce the confusion limitations from extragalactic background sources is one way to be successful at low frequencies.
Acknowledgements.
I like to thank Roland Kothes, Bülent Uyanıker and in particular Ernst Fürst for many years of common SNR research. Patricia Reich and Ernst Fürst critically read the manuscript. The support of SNR observations at the Effelsberg 100-m telescope by Richard Wielebinski is acknowledged.References
- [1985] Aller H.D., Reynolds S.P., 1985, in ”The Crab Nebula and Related Supernova Remnants”, eds. M.C. Kafatos, B.C. Richards, Cambridge, p. 75
- [1986] Aller H.D., Aller M.F., Reynolds S.P., 1986, BAAS 18, 1052
- [1996] Anderson S.B., Cadwell B.J., Jacoby B.A., Wolszczan A., Foster R.S., Kramer M., 1996, ApJ 468, L55
- [1983] Berkhuijsen, E.M., 1983, AA 120, 147
- [1949] Bolton J.G., Stanley G.J., Slee, O.B., 1949, Austr. J. Sci. Res. 2A, 139
- [1998] Busser J.-U., 1998, PhD Thesis, Munich University
- [1999] Cappellaro E., Evans R., Turatto M., 1999, AA 351, 459
- [2002] Camilo F., Stairs I.H., Lorimer D.R., et al., 2002, ApJ (in press)
- [1997] Claussen M.., Frail D.A., Goss W.M., Gaume, R.A., 1997, AJ 489, 143
- [1989] Condon J.J., Broderick J.J., Seielstad G.A., 1989, AJ 97, 1064
- [1972] Cox D.P., 1972, ApJ 178, 159
- [1996] Duncan A.R., Stewart R.T., Haynes R.F., Jones K.L., 1996, MNRAS 280, 252
- [1986a] Fürst E., Reich W., 1986a, AA 154, 303
- [1986b] Fürst E., Reich W., 1986b, AA 163, 185
- [1990] Fürst E., Reich W., 1990, in ”Galactic and Intergalactic Magnetic Fileds”, eds. R. Beck, P.P. Kronberg, R. Wielebinski, IAU Symposium 140, Kluwer, p. 73
- [1987] Fürst E., Reich W., Sofue Y., 1987, AAS 85, 691
- [1988] Fürst E., Handa T., Morita K., Reich P., Reich W., Sofue Y., 1988, PASJ 40, 347
- [1993] Fürst E., Reich W., Seiradakis, J.H., 1993, AA 276, 470
- [1997] Fürst E., Reich W., Aschenbach B., 1997, AA 319, 655
- [1998] Gallant Y.A., Tuffs R.., 1998, Mem.S.A.It. 69, 963
- [2000] Gaensler, B.M., Frail D.A., 2000, Nature 406, 158
- [1987] Green D.A., 1987, MNRAS 225, 11P
- [1992] Green D.A., Scheuer P.A.G., 1992, MNRAS 258, 833
- [2001] Gotthelf E.V., Koralesky B., Rudnick L., Jones T.W., Wang U., Petre R., 2001, ApJ 552, L39
- [1992] Junkes N., Fürst E., Reich W., 1992, AA 261, 289
- [2001] Kaspi V.M., Roberts, M.E., Vasisht G., Gotthelf E.V., Pivovaroff M., Kawai N., 2001, ApJ 560, 371
- [1998] Kothes R., 1998, Mem.S.A.It. 69, 971
- [1998] Kothes R., Fürst E., Reich W., 1998, AA 331, 661
- [2001] Kothes R., Reich W., 2001, AA 372, 627
- [2001] Kothes R., Uyanıker B., Pinault S., 2001, ApJ 560, 236
- [1982] Landecker T.L., Roger R.S., Dewdney P.E., 1982, AJ 87, 1379
- [1997] Marcaide J.M., Alberdi A., Ros E., et al., 1997, ApJ 486, L31
- [1984] McKee C.F., Van Buren D., Larareff B., 1984, ApJ 278, L115
- [1973] Pacini F., Salvati M., 1973, ApJ 186, 249
- [2001] Pérez-Torres M.A., Alberdi A., Marcaide J.M., 2001, AA 374, 997
- [1997] Pineault S., Landecker T.L., Swerdlyk C.M., Reich W., 1997, AA 324, 1152
- [1992] Reich W., Fürst E., Arnal M., 1992, AA 256, 214
- [1998] Reich W., Fürst E., Kothes, R., 1998, Mem.S.A.It. 69, 933
- [1989] Salter C.J., Reynolds S.P., Hoog D.E., Payne J.M., Rhodes P.J., 1989, ApJ 338, 171
- [1993] Schmidt A., Wongsowijoto S., Lochner O. et al., 1993, Kleinheubacher Berichte 36, 99 and Technischer Report No. 73 of MPIfR Bonn
- [1997] Slane P., Seward F.D., Bandiera R., Torii K., Tsunemi H., 1997, ApJ 485, 221
- [2000] Slane P., Gaensler B.M., Dame T.M., Seward F.D., 2000, ApJ 533, L29
- [1996] Taylor A.R., Goss W.M., Coleman P.H., van Leeuwen J., Wallace B.J., 1996, ApJS 107, 239
- [2002] Taylor A.R., Dewdney P.E., Landecker T.L., et al., 2002, AJ (submitted)
- [1997] Torii K., Tsunemi H., Dotani T., Mitsuda K., 1997, ApJ 489, L145
- [1999] Uyanıker B., Fürst E., Reich W., Reich P., Wielebinski R., 1999, AAS 132, 401
- [2002] Uyanıker B., Kothes, R., Brunt C.M., 2002, ApJ 565, 1022
- [1962] van der Laan H., 1962, MNRAS 124, 179
- [2001] Warwick R.S., Bernard, J.-P., Bocchino F., et al., 2001, AA 365, L248
- [1996] Whiteoak J.B.Z., Green A.J., 1996, AAS 118, 329
- [1976] Wilson A.S., Weiler K., 1976, AA 49, 357
- [1972] Woltjer L., 1972, Ann. Rev. AA 10, 129
- [1997] Woltjer L., Salvati, M., Pacini, F., Bandiera, R., 1997, AA 325, 295