Abundant molecular gas in the intergalactic medium of Stephan’s Quintet
Stephan’s Quintet (SQ) is a system consisting of at least four interacting galaxies which is well known for its complex dynamical and star formation history. It possesses a rich intergalactic medium (IGM), where hydrogen clouds, both atomic and molecular, associated with two starbursts (refered to as SQ A and B) have been found. In order to study the extent, origin and fate of the intergalactic molecular gas and its relation to the formation of stars outside galaxies and Tidal Dwarf Galaxies (TDGs), we mapped with the IRAM 30m antenna the carbon monoxide (CO) towards several regions of the IGM in SQ. In both SQ A and B, we detected unusually large amounts of molecular gas ( M⊙ and M⊙, respectively). In contrast, no significant CO detection was achieved towards HII regions south of the pair NGC 7318a/b despite their high H luminosities. The molecular gas is very extended in both SQ A and SQ B, over areas of between 15 and 25 kpc. The CO clouds seem to have otherwise different properties and may be of a different nature. The integrated CO line of SQ A is in particular much wider than in SQ B. Its CO spectrum shows emission at two velocities (6000 and 6700 km s-1) that are coincident with two HI lines. The strongest emission at 6000 km s-1 is however spatially offset from the HI emission and situated on a ridge south-east of the starburst region. In SQ B the CO emission coincides with that of tracers of star formation (H, 15 m and radio continuum). The CO peak lies slightly offset from the HI peak towards a steep HI gradient. This is indicating that the molecular gas is forming in-situ, possibly in a region of compressed HI, with subsequent star formation. The star forming region at SQ B is the object in SQ that most resembles a TDG.
Key Words.:
Stars: formation – ISM: molecules – Galaxies: clusters: individual (Stephan’s Quintet) – Galaxies: individual (NGC 7319, NGC 7318b) – Galaxies: interaction – Galaxies: ISM – intergalactic medium1 Introduction
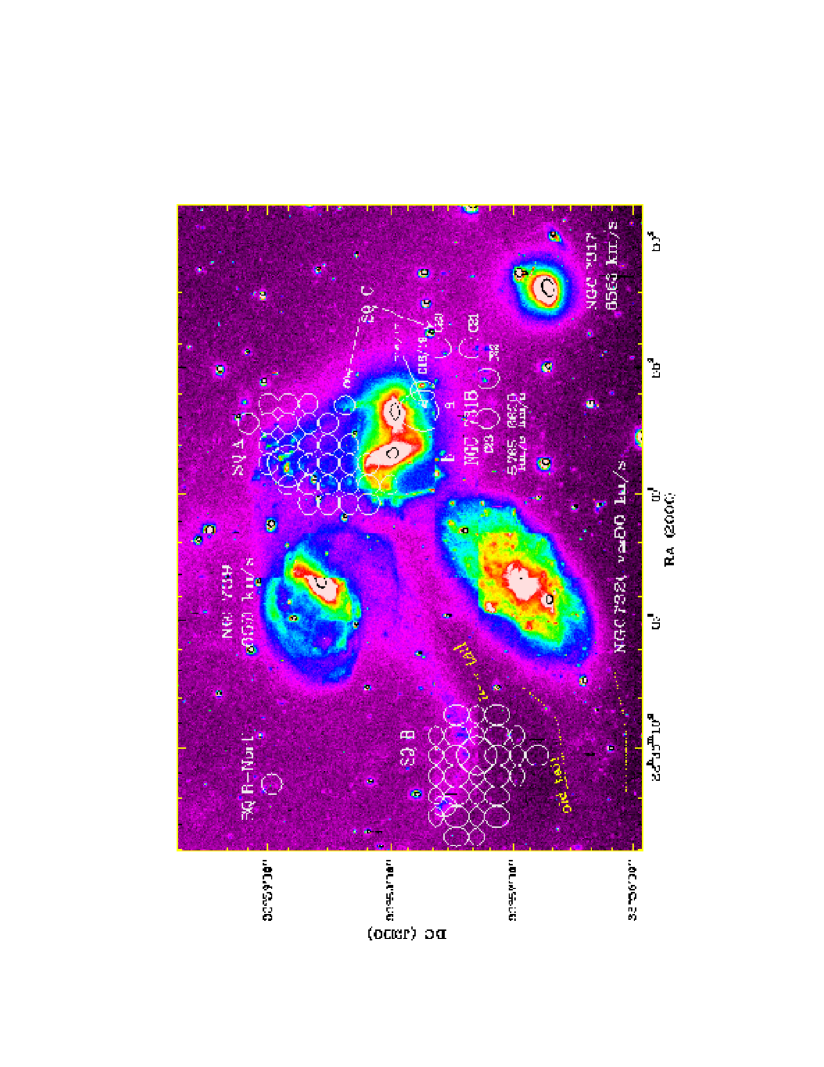
Stephan’s Quintet (Hickson Compact Group 92; hereafter SQ) is one of the best studied examples of a Hickson Compact Group. It contains four interacting galaxies, NGC 7319, NGC 7318a, NGC 7318b, and NGC 7317. A fifth galaxy, NGC 7320, happens to be a foreground object. An optical image of the group is presented in Fig. 1, (see also the excellent image in Arp & Lorre 1976). One of its most striking properties is that the major part of the gas is in the intragroup medium, most likely the result of interactions in the past and present.
A plausible scenario for the dynamical history of SQ is presented by Moles et al. (1997). They suggest that a few times 108 yr ago the group experienced a collision with NGC 7320c, a galaxy 4 arcmin to the east of NGC 7319 but with a very similar recession velocity (6583 km s-1, Sulentic et al. 2001) to the other galaxies in SQ. This collision removed most of the gas of NGC 7319 towards the west and east, and produced the eastern tidal tail which connects to NGC 7319. Presently, the group is experiencing another collision with the “intruder” galaxy NGC 7318b which strongly affects the interstellar medium (ISM) removed during the first collision. NGC 7318b has a recession velocity of 5765 km s-1, in contrast to the other members of the group which have velocities close to 6600 km s-1. Sulentic et al. (2001), in a multi-wavelength study of the group, confirm this scenario and suggest that the group has been visited twice by NGC 7320c. The first collision created the very faint tidal arm east of the interloper NGC 7320, whereas the second interaction produced the tidal arm which stretches from NGC 7319 eastwards.
This violent dynamical history has induced star formation at various places outside the individual galaxies. ISOCAM mid-infrared and H observations have revealed a starburst region (object A in Xu et al. 1999, hereafter called SQ A) at the intersection of two faint optical arms stemming north from NGC 7318a/b. Several knots of star formation are visible in the tidal arm extending from NGC 7319 to the east. At this position, identified as B by Xu et al. (1999) and hereafter called SQ B, there is also mid-infrared and H emission, although much weaker than in SQ A.
Using HST observations, Gallagher et al. (2001) found 115 candidate star clusters, most of them distributed among the tidal debris of SQ. From color-color diagrams they estimated their ages ranging from 2–3 Myr up to several Gyr. The distribution of ages sheds light on the star formation history in SQ: The youngest star clusters (with ages of less than 10 Myr) are found in SQ A and south of NGC 7318a/b, while somewhat older star clusters, with ages between 10 and 500 Myr are in the young tidal tail and around NGC 7319. This is consistent with the picture that the eastern tidal tail was produced in a previous interaction whereas the collision and star formation around SQ A is ongoing. Mendes de Oliveira et al. (2001) have carried out Fabry-Perot observations of the H emission in SQ A and south of NGC 7318a/b, from which they determined the velocity curves for several H emitting regions. SQ B was not covered by their observations. They identified seven Tidal Dwarf Galaxy (TDG) candidates, selected as objects exhibiting a velocity gradient compatible with rotation and possessing an ratio consistent with that of a dwarf galaxy.
Abundant atomic hydrogen is present to the east of the 3 central galaxies, around SQ A and south of NGC 7318a (Shostak et al. 1984, Williams et al. 2002, see their Fig. 5). Williams et al. (2002) suggest that the atomic gas towards the east of SQ consists of two tidal features, each connected to one of the optical tidal arms (the old and the new one, see Fig. 1). Molecular gas has been found at the position of SQ A by Gao & Xu (2000) with BIMA and by Smith & Struck (2001) with the NRAO 12m radio telescope. Both the molecular and the atomic gas in this location present two velocity components, centered at about 6000 and 6700 km s-1, which implies that they originate from different galaxies. Braine et al. (2001) in a study of the CO emission of TDGs detected 2.9108 M⊙ of molecular gas at SQ B. In order to follow up on these detections and to elucidate the extent, origin and fate of the CO in the intergalactic medium (IGM) in SQ, we embarked on a single dish survey, the results of which we report in this paper.
Details of our observations can be found in Section 2. In Section 3 we present the results of these observations, as well as a comparison between the molecular gas and emission at other wavelengths. We discuss our findings in Section 4 and summarize our conclusions in Section 5. Following Williams et al. (2002), who assumed a recession velocity of 6400 km s-1 and =75 km s-1 Mpc-1, we adopt a distance of 85 Mpc, in which case 10′′ correspond to 4.1 kpc.
2 Observations
We observed the CO(1–0) and CO(2–1) lines at 115 and 230 GHz in SQ in July 2001 with the IRAM 30-meter telescope on Pico Veleta. Dual polarization receivers were used at both frequencies with the 512 1 MHz filterbanks on the CO(1–0) line and the autocorrelator or 256 4 MHz filterbanks on the CO(2–1). The observations were done in wobbler switching mode with a wobbler throw of 120′′ in azimuthal direction. Pointing was monitored on nearby quasars every 60 – 90 minutes, the rms offset being ′′. At the beginning of the observations and every time the frequency was changed, the frequency tuning was checked by observing Sagittarius B2. System temperatures were generally quite good, 150–200 K at 115 GHz and 200–300 K at 230 GHz on the scale. The IRAM forward efficiency, , was 0.95 and 0.91 at 115 and 230 GHz and the beam efficiency, , was 0.75 and 0.54, respectively. Our half-power beam size was 21′′ at 115 GHz and 11′′ at 230 GHz. All CO spectra and luminosities are presented on the main beam temperature scale () which is defined as . For the data reduction, the spectra were summed over the individual positions and a constant continuum level was subtracted.
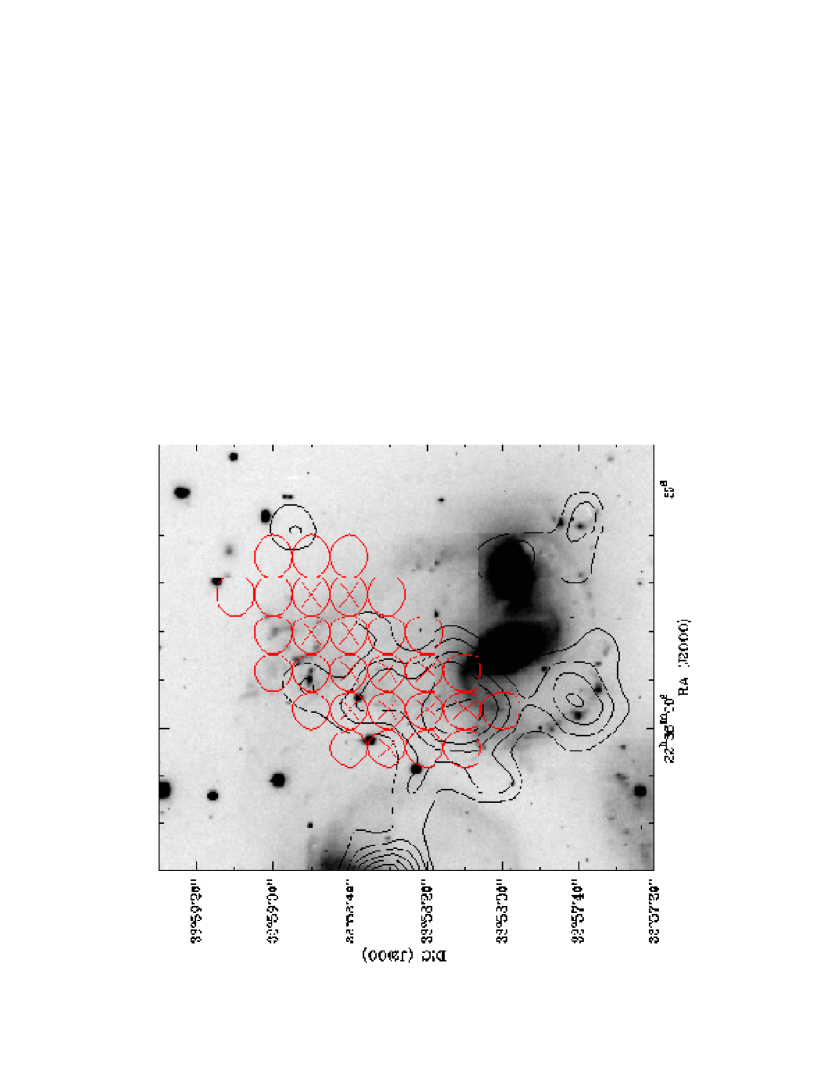
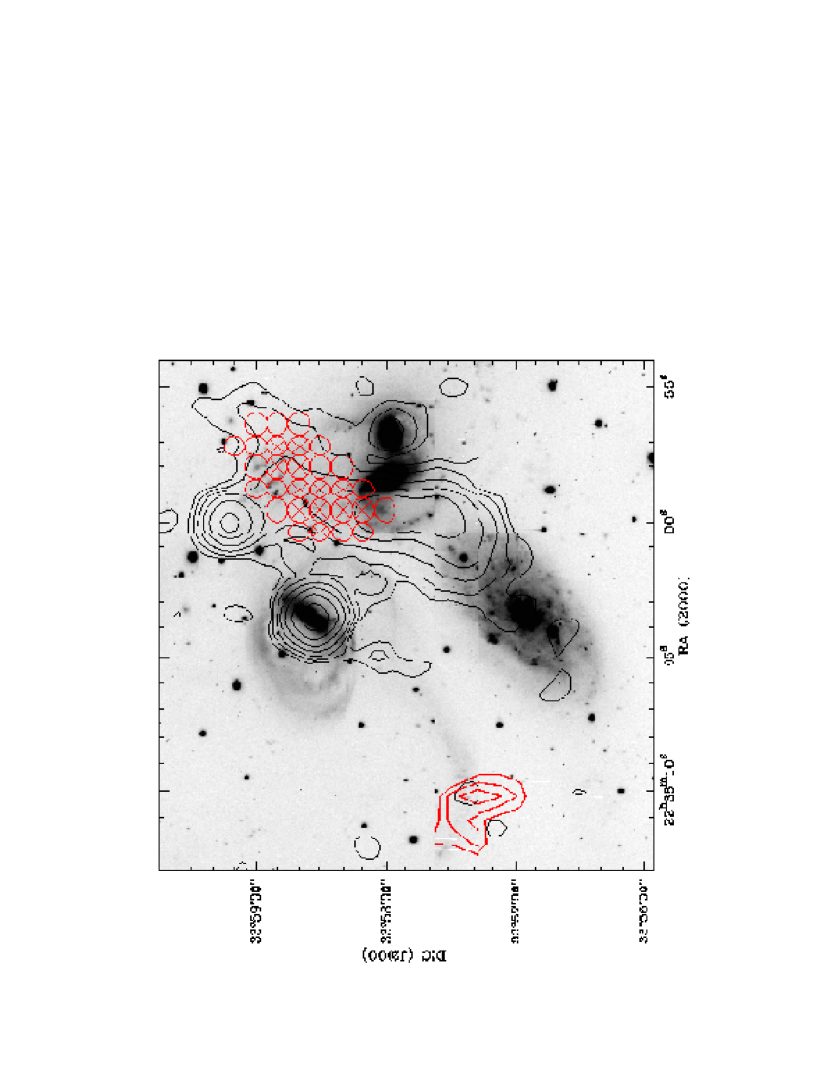
We observed three different regions of Stephan’s Quintet: (i) the region around starburst SQ A, where strong mid-infrared and H emission had been detected (Xu et al. 1999), (ii) the area around a star forming region in the eastern tidal arm of NGC 7319 (SQ B), as well as one position (SQ B-North) at the northern tip of the HI cloud covering SQ B (Williams et al. 2002), and (iii) several positions to the south and north of NGC 7318a/b, observed by Mendes de Oliveira et al. (2001) in H. We call these positions SQ C where is the number that Mendes de Oliveira et al. (2001) gave to the corresponding region. The locations of our pointings are shown in Fig. 1.
In SQ A and SQ B the spacing of the individual pointings is 10′′ so that the CO(2–1) map is undersampled. Note that our observations are centered at the positions called SQ A and SQ B as in Xu et al. (1999) but that they comprise a much larger area.
3 Results
3.1 Molecular gas distribution


In Fig. 2 and Fig. 3 we present a mosaic of the CO(1–0) spectra observed around SQ A and SQ B. The noise in the spectra is about 6 mK (SQ A) and 5 mK (SQ B) at a velocity resolution of 2.66 km s-1. The CO(2–1) emission was also detected at several positions where the CO(1–0) line was visible (see Fig. 4). The quality of the CO(2–1) map of SQ A is much poorer, so that no useful information can be derived from the individual spectra. Therefore we do not show it here. In Table 1 the integrated intensities and the derived molecular gas masses for the two regions are listed. All molecular gas masses in this paper are calculated using the galactic conversion factor of N(H2)/I cm -2(K km s-1)-1, yielding:
| (1) |
where is the velocity integrated CO line intensity expressed in K km s-1, is the distance in Mpc and is the area covered by the observations in arcsec2 (i.e. for a single pointing with a Gaussian beam of FWHM ). We direct the reader to Braine et al. (2001) for a more detailed derivation of the molecular gas mass. When referring to molecular data from other authors, we scale their values to this conversion factor throughout this paper.
The CO emission in SQ A is very extended. CO lines at a central velocity of about 6000 km s-1 are visible in individual spectra over an area of about 40 50′′ (Fig. 2). The total molecular gas mass at this velocity, derived by integrating over the entire area observed, is M⊙. If we were to limit the integration to the positions where the CO(1-0) line is clearly visible, we would obtain an integrated intensity of K km s-1 and a total molecular gas mass of M⊙. The error in these masses is about 10%, partly due to the error in the integrated intensity (5%) and partly due to the error in the total area which we estimate to be about 5 – 10%. Thus, by summing over those spectra with clearly detected signal we apparently miss a faint, extended component which accounts for % of the total mass present. In the integrated CO spectrum a weaker component at 6700 km s-1 is visible as well (Fig. 5). This component is not apparent in the individual spectra, and therefore we do not include this velocity range in Fig. 2. Its total molecular mass, integrated over the whole area, is M⊙.
In SQ B the molecular gas has been detected over a region of about 60 40′′ (Fig. 3). It is associated with the optically visible star forming region – the maximum of the CO emission coincides with it – but is more extended. The CO emission includes the region at the very tip of the optical tidal tail where weaker H and a stellar condensation with blue colour (; Sulentic et al. 2001) has been found. The total molecular gas mass in this area ( M⊙, see Tab. 1) is more than twice as much as that found by Braine et al. (2001) who observed only the central position.
We did not detect CO at the majority of the positions of the TDG candidates observed by Mendes de Oliveira et al. (2001) south and north of NGC 7318a/b. We got a marginal detection of K km s-1 when averaging the positions SQ C16/17 and SQ C18/19 which we used as an upper limit. No CO was detected in the northern part of the eastern HI tail (SQ B-North). This position was chosen because it coincides with a local peak of the HI emission and shows H emission (Sulentic et al. 2001). The rms noise of the positions with non-detections are 3–4 mK for CO(1-0) and 4–6 mK for CO(2-1), at a velocity resolution of 5 km s-1.
| Region | Size(M) | M(1) | MHI(2) | M/MHI | L(H) | SFR(3) | M/SFR | |
|---|---|---|---|---|---|---|---|---|
| [K km s-1] | [arcsec2] | [108 M⊙] | [108M⊙] | [1040erg s-1] | [M⊙/yr] | 108 yr | ||
| SQ A(6000)(4) | 0.840.04 | 6080 | 22 | 16 | 1.4 | 8.8/26.4(8) | 1.16/3.48 | 19/6 |
| SQ A(6700)(5) | 0.330.05 | 6080 | 8.6 | 9 | 0.95 | 2.2/6.6(8) | 0.29/0.86 | 30/10 |
| SQ B(tot)(6) | 0.54 0.02 | 6040 | 7.0 | 14 | 0.5 | 1.2(8) | 0.16 | 44 |
| SQ B(cent)(7) | 1.10.1 | 2121 | 2.9(10) | 5 | 0.6 | 1.2(8) | 0.16 | 18 |
| SQ B-North | 0.09 | 2121 | 0.24 | 2.5 | 0.10 | 0.5(8) | 0.06 | 4.0 |
| SQ C8 | 0.09 | 2121 | 0.24 | 0.7 | 0.34 | 0.8(9) | 0.10 | 2.4 |
| SQ C16/17-18/19 | 0.5 | 3121 | 1.76 | 5.5 | 0.33 | 8.8(9) | 1.14 | 1.6 |
| SQ C20 | 0.07 | 2121 | 0.19 | 0.3 | 0.63 | 0.9(9) | 0.12 | 1.6 |
| SQ C21 | 0.07 | 2121 | 0.19 | 1.1 | 0.17 | 1.5(9) | 0.20 | 1.0 |
| SQ C22 | 0.05 | 2121 | 0.14 | 1.6 | 0.09 | 1.3(9) | 0.17 | 0.8 |
| SQ C23 | 0.07 | 2121 | 0.19 | 1.6 | 0.12 | 0.4(9) | 0.05 | 3.8 |
(1) Calculated using the Galactic conversion factor of N(H2)/I cm -2(K km s-1)-1.
The upper limits are calculated as , where is the rms noise, the velocity resolution (here 5.3 km s-1) and the line width, adopted to be equal to the HI line widths in this region of about 100 km s-1(Williams et al. 2002).
(2) From HI data of Williams et al. (2002).
(3) Calculated from the H luminosity according to (Hunter & Gallagher 1986).
(4) Only the gas components at 6000 km s-1.
(5) Only the gas component at 6700 km s-1. The spatial extent cannot be quantified because the signal is too weak to show up in individual spectra. The value listed here refers to the area over which the line was integrated.
(6) Values for the CO and HI for the entire area with CO emission.
(7) Values for the CO and HI for the area within the central beam, coinciding with the H emission.
(8) From H data of Xu et al. (1999). The first value refers to the luminosity in the starburst region, the second value to the total luminosity in the region where CO was mapped.
3.2 Kinematics and excitation
In Fig. 5 and Fig. 6 we show the average CO(1–0) spectra in both regions, overlaid over the HI emission (Williams et al. 2002), averaged over the same region. The line shapes in both regions are different: In SQ A the CO line is very broad, with a FWHM of km s-1 and line wings extending out to more than 200 km s-1, showing that in this region large velocity gradients are present, whereas the line width in SQ B is much narrower, with a FWHM of km s-1.
The HI gas of SQ A has two distinct velocity components, one at 6000 and another at 6700 km s-1. The CO and HI lines generally agree well, with the exception of a slight velocity offset between the low-velocity component of the HI line, centered at 6000 km s-1, and the CO line, centered at 6030–6040 km s-1. Nevertheless, the line width, shapes and the relative intensity of the components at 6000 and at 6700 km s-1 are the same for the HI and CO spectra. Smith & Struck (2001) find, using the NRAO 12m telescope, that both velocity components have similar strengths. The reason for why they underestimate the strength of the line at 6000 km s-1is most likely because they cover a smaller area. This can be seen when comparing the molecular gas masses that they derive for their components. Whereas their value for the component at 6700 km s-1, M M⊙, agrees well with ours, their value for the component at 6000 km s-1, M M⊙, is much lower. This can be understood if the 6700 km s-1 component is more centrally concentrated, as is the case for the HI emission (Williams et al. 2002), and as a result is covered by their beam, but the 6000 km s-1 component is not. From their Fig. 1g it is indeed obvious that their beam is smaller than the area mapped by us.
The CO emission in SQ B has a central velocity of 6625 km s-1. There is very good agreement between the CO and HI lines (from Williams et al. 2002) with respect to the line width, central positions and special features, such as the blue wing.


To better understand the dynamical behavior of the CO emitting gas we created several position-velocity diagrams using our data. Our analysis of SQ B only gave marginal indications for a weak velocity gradient of about km s-1 along the east-west direction. In SQ A we did find evidence for a slope in velocity along a position angle of degrees for the velocity range around 6000 km s-1 (Fig. 7). Moreover, for a cut perpendicular to it, no slope was seen. This is very similar to what we found for the atomic gas using the HI data of Williams et al. (2002). A similar trend has also been seen in the H data of Mendes de Oliveira et al. (2001) for their regions 2,3,4 and 5. The position angle of the H velocity is the same as the one we find in CO and HI, but their observed velocity range is slightly smaller, between 5938 km s-1 and 6010 km s-1, whereas the CO data shows a gradient from about 5970 km s-1 to 6130 km s-1. This is probably due to the smaller extent of only about 30′′ of the H observations. Normalized to the same spatial extent the H gradient is comparable to the gradient in CO within the uncertainties.


In Fig. 8 and 9 we show the CO(2–1) lines, averaged over the same area as the corresponding CO(1–0) lines. In order to compute the CO(2–1)/CO(1–0) integrated intensity ratio in SQ A and SQ B, the CO(2–1) spectra have been convolved to the spatial resolution of the CO(1–0) beam. To minimize the error of this ratio, we have included only spectra at positions with a S/N of the CO(1-0) line. In SQ A, the CO(2–1)/CO(1–0) ratio is and in SQ B . Within the errors, there is no significant difference in the line ratios. They are slightly lower than the average found for a mixed sample of nearby galaxies (CO(2–1)/CO(1–0), Braine & Combes 1992). Better CO(2–1) data are necessary in order to judge whether this difference is significant.
3.3 Comparison of the CO and HI distribution
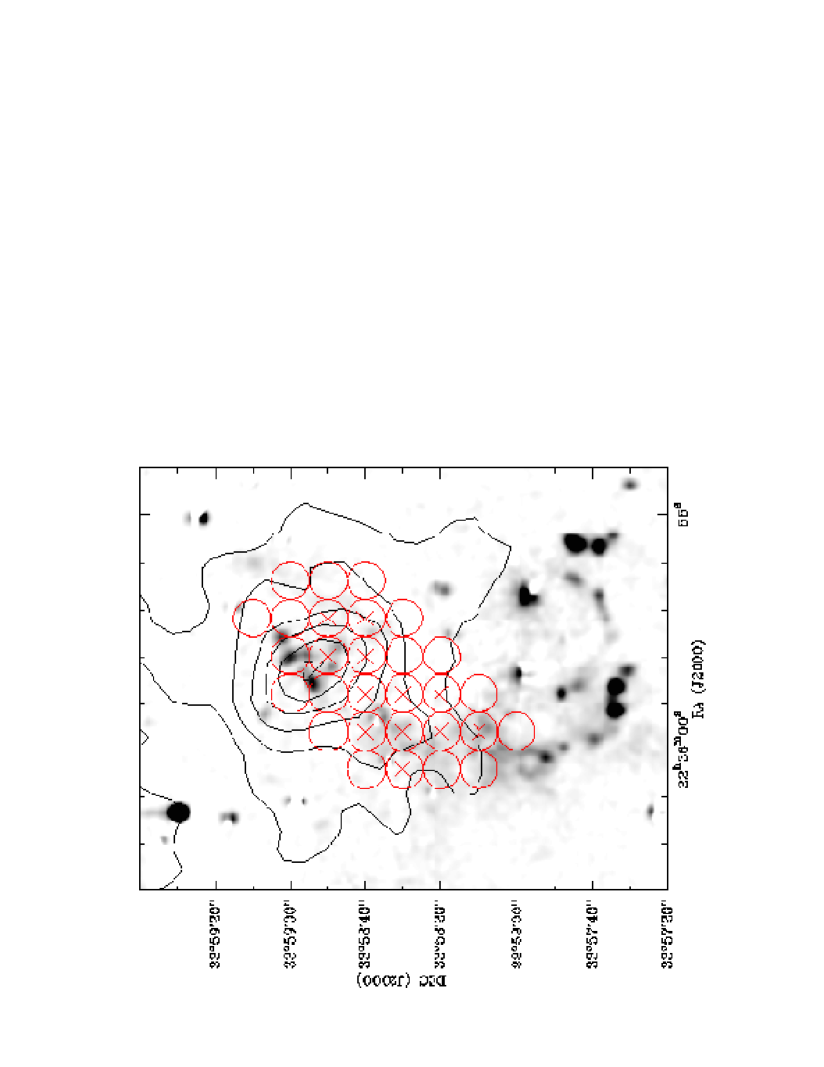
In spite of the practically identical kinematics, the atomic and molecular gas distributions show differences both in SQ A and in SQ B. In SQ A, the CO lines are wide and have low maxima. As a result, it is difficult to display the velocity integrated intensities of the CO emission because of their large uncertainties. We therefore show in Fig. 10 a comparison of the HI emission around 6000 km s-1 with the observed positions in CO. The positions where we clearly () detected a line are indicated by a cross and the observed positions as circles. Note that, as mentioned earlier, also at the positions without a clear CO detection some faint emission must be present. From Fig. 10 it is clear that the overall distribution of the CO emission is different from the HI emission. Even though some CO marginally coincides with the HI peak, most of it is located to the south-east along a faint HI ridge.
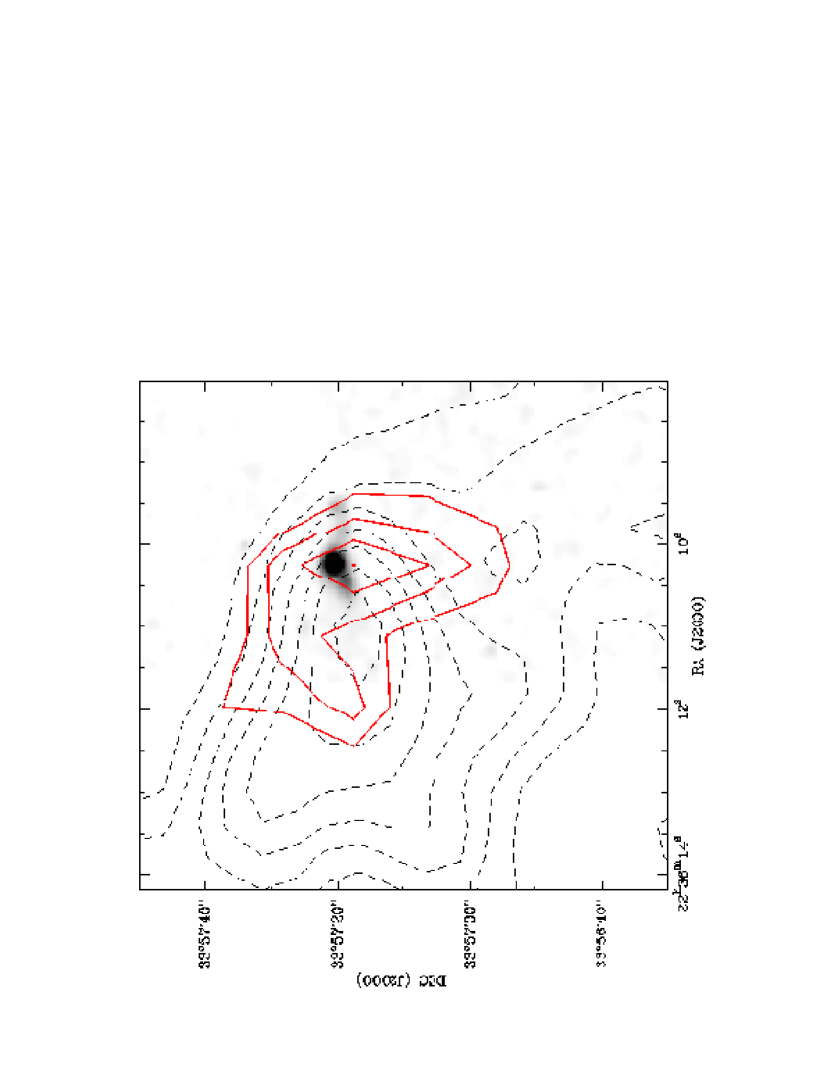
In Fig. 11 we display the contours of the integrated CO intensity of SQ B overlayed onto contours of an HI integrated surface brightness map. The maxima of the CO and HI emission are close, but do not exactly coincide. Instead, the CO peaks slightly (10 – 15 ′′) west from the HI ridge, towards a steep HI gradient, suggestive of compression in the gas which implies that this over-density in HI may have provoked the formation of molecular gas. The molecular-to-atomic gas ratio is highest at the peak of the CO emission and west of it. This means, under the assumption that the molecular gas is being formed in situ, as has been suggested for TDGs (Braine et al. 2001), that this compressed region is the place of the most efficient transformation of HI into H2.
The HI mass in SQ A, integrated over the area mapped in CO, is M⊙( M⊙) for the velocity component at 6000 km s-1 (6700 km s-1) (see Tab. 1). This means that the molecular gas mass is comparable to the atomic gas mass with a ratio of M/MHI= 1.4 (1.0). The HI mass of the entire area around SQ A is M⊙, which is of the same order as the total mass of the gas in molecular form. The atomic gas mass in SQ B, integrated over the region where CO was detected, is M⊙. This yields a molecular-to-atomic gas mass ratio of 0.5, higher than the values of less than about 0.2 found for other TDGs (Braine et al. 2001).
3.4 Comparison of the CO and H distribution
The H emission in SQ A consists, as do the HI and CO data, of two velocity components, centered around 6000 km s-1 and 6700 km s-1, respectively (Sulentic et al. 2001, Iglesias-Páramo & Vílchez 2001, Xu et al. 1999). The distribution of both velocity components is similar in the regions that our CO observations covered. Using the data of Xu et al. (1999), taken with narrowband filters, we present in Fig. 10 the spatial distribution of the H emission at 6000 km s-1 and our CO detections. We observe that the CO gas follows closely the H emission in the north-south direction, but surprisingly little CO is seen close to the brightest H peak in the starburst region at SQ A.
Similarly, we present in Fig. 11 the H image of SQ B overlayed with the contours of the molecular gas. The H emission is situated 5′′ north of the maximum of the CO emission and approximately 15′′ north-west from the maximum of the HI emission. We conclude that the H and CO emission coincide within the limited spatial resolution (21′′) of our data. Also, the velocities agree, with the velocity of the CO line being 6625 km s-1 and that of the H emission 6617 km s-1 (Sulentic et al. 2001). Altogether, this is pointing to a causal connection between molecular gas and recent star formation.
In Tab. 1 we list the molecular gas mass divided by the SFR (derived from the H luminosity) which gives the gas consumption time (i.e. the inverse of the star formation efficiency). The values we derive for SQ A and SQ B are typical to those of spiral galaxies, which have been estimated to lie between 4 and 40 yr (Kennicutt 1998).
3.5 Molecular gas fraction and star formation in the non-detections
We observed various positions (see Fig. 1) south of NGC 7318a/b and north of SQ B in CO without getting a detection. The results are summarized in Tab. 1.
The position north of SQ B (SQ B-North) coincides with the north tip of the HI cloud and was chosen because Sulentic et al. (2001) detected H emission at the same velocity as the HI and suggested that an extragalactic HII region may be forming. Gallagher et al. (2001) identified two starclusters (30 and 31) at the same position. The clusters have blue colours and are therefore young, less than 10 – 500 Myr, and must have formed in situ. At this position we derived an upper limit of M/MHI. This value is much lower than at the other places in SQ where we detected molecular gas, but it is not unusual compared to typical values for TDGs (Braine et al. 2001). The upper limit of M/SFR yr is at the low end of the typical range for spiral galaxies.
Around NGC 7318a/b we observed several of the positions where Mendes de Oliveira et al. (2001) have found H emission (their positions 8, 16/17, 18/19, 20, 21, 22 and 23; note that positions 16 and 17 as well as 18 and 19 fall within the IRAM beam). The authors suggest that some of them (8, 20, 21, 22 and 23) are TDG candidates, mainly based on the detection of a velocity gradient in the H data which they interpret as rotation. We observed in addition to these TDG candidates positions 16/17 and 18/19 because of their relatively high HI column density. The upper limits of the molecular gas fraction, M/MHI, are low for some objects, but not unusual compared to spiral galaxies and TDGs. The upper limits for the gas consumption time, M/SFR, on the other hand, are, for most objects, much lower than the values found for TDGs (see Braine et al. 2001) or spiral galaxies. This is particularly surprising, as the large size of the CO(1-0) beam of 21′′, corresponding to 8.6 kpc, should comprise the molecular gas associated with the star formation even if the H and CO emission do not coincide exactly, because, e.g. the ongoing star formation has destroyed the molecular gas locally. A low metallicity could explain the non-detections but seems unlikely as we did detect CO at other places in SQ. We checked for the presence of star clusters from Gallagher et al. (2001) at the observed positions in order to find out whether star clusters have been formed since the beginning of the collision with NGC 7318b of less than yr ago (Sulentic et al. 2001). Region C23 coincides with an old star-cluster (number 117), with an age of several Gyr, which was therefore born before the start of the latest interaction. Regions C8, C16/17 and C18/19 coincide with star clusters 133, 134, 135, 137, 122, 128, and 130, some of which are younger than 10 Myr. At the other observed positions no star clusters were found within a radius of 10′′. Thus, young star clusters formed after the beginning of the collision have only been found close to the parent galaxy NGC 7318a and not in the TDG candidates C20 – C23.
3.6 Comparison of the CO distribution to other tracers
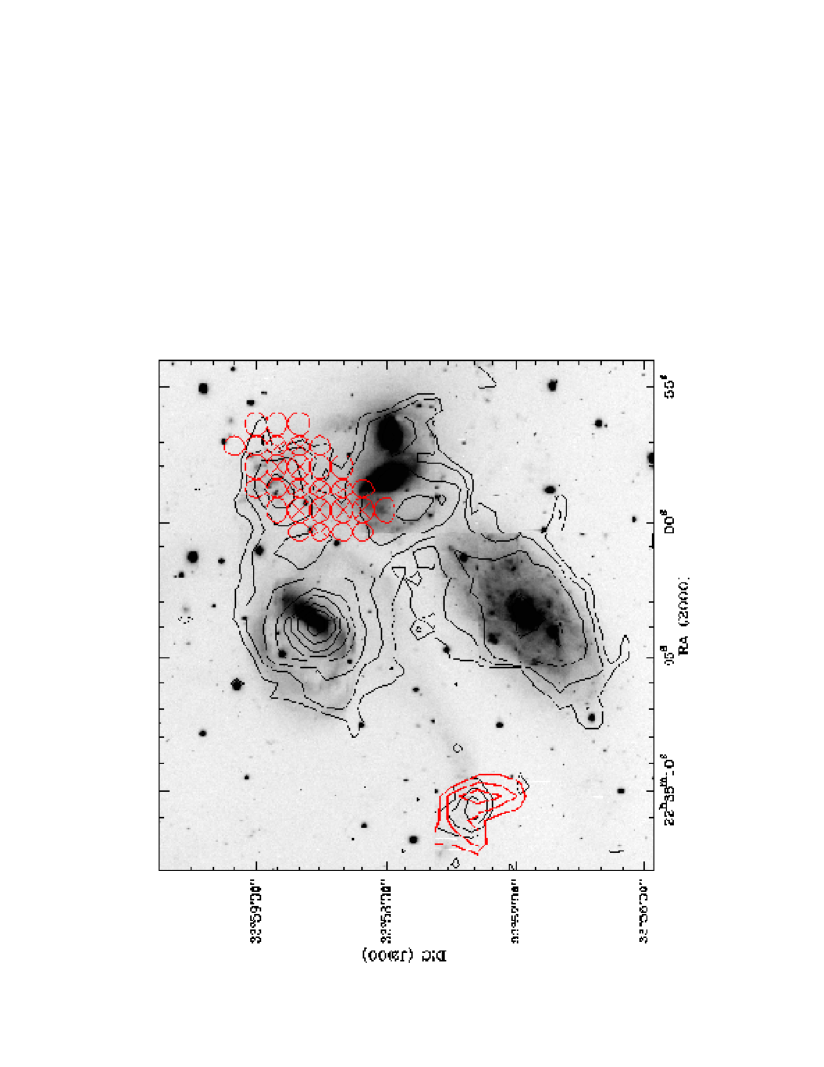
In Fig. 12, 13 and 14 we compare the CO distribution to that of the 15 m emission observed by ISOCAM (Xu et al. 1999), the X–ray emission from the ROSAT archive, and the 20cm radio continuum emission (Williams et al. 2002), respectively.
The overall distribution of the dust traced by the ISOCAM 15 m image is similar to the CO emission in both SQ A and SQ B (Fig. 12). In SQ A the 15 m emission coincides with the maximum in the H and indicates the position of the intergalactic starburst. The CO is slightly offset towards the south and west of the 15 m peak. The CO emission coincides with faint 15 m emission at all our observed positions, showing that the presence of molecular gas is accompanied by the presence of dust. In SQ B the 15 m peak is marginally offset (5-10′′) from the CO maximum and is located towards the peak of the HI surface density.
In the intergalactic medium around SQ A, radio continuum (Williams et al. 2002) and X–ray emission (Pietsch et al. 1997) are present. As previously noted (e.g. Sulentic et al. 2001), there is good agreement between the radio continuum, the X–ray and H emission in the elongated north-south feature north of NGC 7318a/b. All along this ridge we find CO emission (Fig. 13 and 14). CO is also present in a region without X–ray emission towards the north which coincides with the edge of the ISOCAM peak. In SQ B no X–ray emission is detected, but weak () radio continuum emission can be seen, coinciding with the peak of the CO emission.
The radio continuum emission in both regions is mostly non-thermal (i.e. synchrotron emission) as can be deduced by calculating the expected thermal radio emission from the H emission. The thermal radio emission derived from the H flux yields (following eq. (3) and (4) in Condon 1992), a few percent of the radio continuum flux in SQ A and about 10% in SQ B. This thermal fraction at 1.49 GHz is typical for star-forming galaxies (Condon 1992).
4 Discussion
4.1 Molecular gas, shocks and star formation in SQ A
The enormous amount of molecular gas that we have found and its large extent are surprising. In the following we will discuss how this molecular gas fits into the current picture of the IGM in SQ A.
The IGM around SQ A shows two velocity components. Sulentic et al. (2001) suggest that the gas at 6700 km s-1 was stripped during the earlier visit of NGC 7320c and part of it has become shock-ionized due to the present interaction with NGC 7318b. In this view, the H emission at 6700 km s-1 traces the shock front. Strong support for this shock hypothesis is the fact that X–ray (tracing hot gas) and radio continuum emission (tracing cosmic ray electrons produced in shocks) are coincident with the H emission. The gas at velocities around 6000 km s-1 originates from NGC 7318b and is being removed from this galaxy in the ongoing collision. The H emissions at 6000 and 6700 km s-1 overlap to a large extent in the region where we observed CO. In HI, the two velocity components have their maxima at the same position, but the component at 6700 km s-1 is spatially much less extended than that at 6000 km s-1 (Williams et al. 2002). Sulentic et al. (2001) suggest that the apparent spatial coincidence is a projection and that NGC 7318b, and thus the shock caused by it, are moving along the line of sight.
The presence of molecular gas indicates a rather cool environment. It is therefore surprising to find large amounts and extended CO emission at positions where shocks are present and are heating and ionizing the gas. J-shocks with velocities above about 50 km s-1 are able to effectively destroy molecular gas (Hollenbach & McKee 1980; 1989). Shocks with these velocities are plausibly present given the large velocity difference (600 – 1000 km s-1) between the intruder NGC 7318b and the rest of the SQ galaxies.
This strongly suggests that shocks do not affect the gas at 6000 km s-1, the velocity at which we found the major part of the CO emission. This means that the X–ray and radio continuum emission tracing shocks are only associated with the gas at 6700 km s-1. In addition to the presence of extended molecular gas, support for this hypothesis comes from the atomic gas. Similarly to the CO, the HI component at 6000 km s-1 is very extended, indicating that shock heating is not affecting this area so that cool gas can exist. Contrary to this, the HI component at 6700 km s-1 is spatially much more concentrated. Furthermore, the spatial coincidence between the 15 m and and CO emission support the absence of shocks because dust is very easily destroyed by them (e.g. Borkowski & Dwek 1995, Jones et al. 1996).
The molecular gas mass in the starburst region111 I.e. adding the 4 pointings around the position (-5′′, 5′′), where the maximum of the H emission is found, and summing both velocity components. is M⊙. The surprising result of our observations is that the molecular gas content of the starburst region is only a small part (about one fourth) of the total molecular gas content and that the starburst does not mark the maximum of the CO emission. Our molecular gas mass in the starburst region is only slightly higher than the mass estimated from interferometric observations by Gao & Xu (2000) ( M⊙). The observations of Gao & Xu (2000) showed CO emission only at the position of the starburst. This could indicate that the extended emission that we have found is more smoothly distributed and therefore not detected by interferometric observations.
The origin of the molecular gas in SQ A is unclear. It could have been stripped together with the atomic gas from NGC 7318b or it could have formed in situ. In the center of NGC 7318b, a molecular gas mass of M⊙ has been found (Smith & Struck 2001). This yields, together with its blue luminosity of M⊙, a ratio of , considerably higher than the average value of (with a scatter of a factor 3) that has been found for isolated galaxies of this luminosity (Perea et al. 1997). Thus, the molecular gas in SQ A could have its origin in NGC 7318b. On the other hand, if the molecular gas has formed in situ, a large scale process and not gravitational collapse must be responsible for its formation over a scale of about 25 kpc. The velocity of this gas, 6000 km s-1 (which is higher than the central velocity of NGC 7318b of 5765 km s-1) could be an indication that it has already been accelerated by the collision with the intergalactic gas and the slight offset between the molecular (6030 km s-1) and atomic gas (6000 km s-1) central velocities might show that the molecular gas is forming in the most accelerated parts.
4.2 Origin of the molecular gas in SQ B
The molecular gas in SQ B could have either been stripped from the parent galaxy together with the atomic gas or it could have formed in situ. Studying a sample of TDGs, Braine et al. (2001) argue in favor of the in-situ formation. Their main argument is that the CO distribution in spiral galaxies is normally concentrated towards their central parts whereas the atomic gas is much more widely distributed and therefore more easily stripped. In SQ the situation is more complicated because more than two galaxies are interacting. However, the arguments of Braine et al. (2001) seem to be applicable to NGC 7319, the galaxy thought to be the progenitor of the eastern HI cloud and the young optical tidal tail. All of the HI from this galaxy has been stripped, whereas CO is still found within its optical disk (Yun et al. 1997, Smith & Struck 2001). Its molecular gas content of M⊙ (Smith & Struck 2001) and its blue luminosity ( L⊙; Verdes-Montenegro et al. 1998) yield which is normal compared to other galaxies (see above in Sect. 4.1). This supports the idea that in NGC 7319, as in other interacting galaxies, the HI was more easily stripped whereas CO stayed within the optical disk.
In SQ B the molecular gas is found in close association with the atomic gas and with indicators of star formation, as described in detail in the previous sections. Altogether, this spatial and (in the case of HI also kinematical) coincidence suggests that we are seeing in-situ molecular gas formation possibly provoked by compression of the atomic gas, and the subsequent star formation traced by H emission and other tracers. Further support for this comes from the distribution of M/MHI. If the molecular gas had been stripped together with the atomic gas, the molecular-to-atomic gas mass ratio would have been preserved, if no molecular gas formation or destruction took place after the stripping. In this case it would be an unlikely coincidence that we find the highest value of M/MHI close to the HI peak.
4.3 Tidal Dwarf Galaxies in Stephan’s Quintet?
We observed very different regions in SQ and our CO observations have shown that the properties of the ISM are very diverse. Some of our observed regions have been claimed to be TDG candidates (e.g. Mendes de Oliveira et al. 2001, Iglesias-Páramo & Vílchez 2001). Duc et al. (2000) defined a TDG as a self-gravitating entity formed out of tidal debris. Although it is, without a detailed kinematical study, difficult to decide whether a given TDG candidate is indeed self-gravitating, Braine et al. (2000) have argued that the detection of molecular gas forming in situ gives strong support to the hypothesis of self-gravitation. Most objects observed in SQ are, however, different in one way or another from the sample of TDGs observed by Braine et al. (2000; 2001).
SQ B is the object that most closely resembles TDGs. Its has a clear tidal origin and we have summarized evidence that the molecular gas is forming in situ. The ratio of molecular gas mass to the H luminosity is normal for star forming galaxies. The star formation rates that can be derived from different tracers such as H emission, 15 m emission (following the estimate in Xu et al. 1999) or radio continuum (applying eq. 21 in Condon (1992), extrapolated with a Salpeter initial mass function down to stars with masses above 0.1 M⊙) give similar values of about 0.2 M⊙yr-1. These values are in the same range as those found for TDGs ( M⊙yr-1) and several nearby dwarf galaxies ( M⊙yr-1) (Braine et al. 2001) showing that the observations of SQ B are consistent with the formation of a dwarf galaxy in the tidal tail. However, the large extent of the molecular gas covering the entire tip of the optical tail is surprising and different from other TDGs. One reason is probably the fact that star formation happens at two positions along the optical tidal tail: apart from SQ B there is a weaker star-forming knot showing a blue colour and H emission at the very end of the optical tidal tail (at and ′′). Molecular gas was detected at this position. Higher resolution observations are necessary in order to find out whether the molecular gas is concentrated towards the two star forming regions as would be expected if TDGs are forming.
The situation in SQ A is entirely different. Whereas the star formation is very concentrated at the central position of SQ A, the distribution of the molecular gas is much more extended with no maximum at the starburst. This lack of association of the molecular gas with the starburst region, together with the unusual origin of the ISM in this region brings up strong doubts whether SQ A is a TDG, i.e. an object that is bound by gravitation. These doubts are reinforced by the large dynamical mass that is deduced from the CO velocity gradient in SQ A (see Sect. 3.2). Under the assumption that the region around SQ A is gravitationally bound and that the velocity gradient is due to rotation we can calculate the dynamical mass (, where is the radius of the region, is the velocity gradient along and is the gravitational constant). With ′′ and km s-1 we derive M⊙. This is much larger than the mass of the molecular and atomic gas at this velocity ( M⊙). The stellar mass in the starburst region has been estimated by Xu et al. (1999) from a K-band image to be M⊙, much smaller than the gas mass. Thus, the dynamical mass is much higher than the visible mass meaning that this region would need a high fraction of dark matter in order to be gravitationally bound. This is in contrast to what has been found for a sample of TDGs (Braine et al. 2001) where the visible and dynamical masses were found to be very close obviating the need for dark matter. We interpret the high dynamical mass as evidence that this region is not gravitationally bound on the size scales observable at the current resolution. The extended and homogeneous distribution of the molecular gas in this region makes it unlikely that a gravitational collapse is responsible for its formation. The star formation in the starburst region SQ A has rather been triggered by local processes, as e.g. by the pressure of the hot surrounding gas, as suggested by (Xu et al. 1999).
Most of the objects in SQ C possess a gradient in the H emission indicative of rotation (Mendes de Oliveira et al. 2001) and might therefore be self-gravitating objects. However, the lack of gas, both atomic (except for C16/17 and C18/19 the atomic gas densities are cm-2) as well as molecular, makes them different from other TDGs. For this reason it is unlikely that they will become like TDGs that resemble dwarf irregulars or blue compact dwarfs as they do not have the gas reservoir to continue forming stars for a long time.
5 Conclusions
We have observed CO in several regions in SQ. Our main results are:
-
1.
In both SQ A and SQ B we detected large amounts of molecular gas of M⊙ and M⊙, respectively. The molecular-to-atomic gas mass ratios are high (1.2, respectively 0.5), much larger than what has been found in typical TDGs (Braine et al. 2001). The molecular gas is very extended, over regions of about 15 – 25 kpc.
-
2.
The CO spectrum in SQ A consists of lines at different velocities, centered at 6030 and 6700 km s-1, with most of the emission coming from the low velocity component, whereas in SQ B the CO is at 6625 km s-1. The kinematical agreement (velocity, width and spectral shape) between the CO and HI lines is very good in both regions, except for a small offset in the low-velocity components of the CO and HI lines in SQ A (the HI line peaks at 6000 km s-1).
-
3.
In SQ A, the CO emission at 6000 km s-1 is found south of the starburst region, covering the southern part of the HI distribution at this velocity and coinciding with X–ray and radio continuum emission which are indicative of shocks. The much weaker CO emission at 6700 km s-1 is more spatially concentrated. We conclude that the presence of large amounts of extended molecular gas at 6000 km s-1 implies that the shocks traced by X–ray and radio continuum emission only affect the gas at 6700 km s-1 and that the apparent spatial coincidence is a projection.
-
4.
In SQ B there is good spatial agreement between the tracers of star formation (H, 15 m and radio continuum) and the CO emission. The CO peak is slightly offset from the HI peak towards a steep HI gradient. We interpret this as indicating that the molecular gas is forming in-situ, possibly in a region of compressed HI and that the star formation is taking place subsequently. This, together with the fact that the emission at different wavelengths is similar to that of normal star forming galaxies and that SQ B has a clear tidal origin, makes it the object in SQ that most resembles a TDG.
-
5.
We have searched without success for CO in several objects around NGC 7318a/b in which Mendes de Oliveira et al. (2001) found H emission. The upper limits for the ratios between molecular gas mass and SFR (derived from the H emission) are lower than those found in spiral galaxies and TDGs. The molecular-to-atomic gas mass ratio is also low, though not unusual. The low atomic and molecular gas content of these regions makes them different from TDGs and will not allow them to sustain star formation for a long time.
Acknowledgements.
We would like to thank J. Iglesias-Páramo and J. Vílchez for making available their H data to us, L. Verdes-Montenegro for the HI data, C. Xu for the ISOCAM and H data and S. Gallagher for useful information about the star clusters in SQ. Thanks are also due to the referee, G. Petitpas, for the careful reading of the manuscript and detailed suggestions for improvements. VC would like to acknowledge the partial support of JPL contract 960803 and EB acknowledges financial support from CONACyT via project 27607-E. We made use of data from the Canadian Astronomy Data Center, which is operated by the Dominion Astrophysical Observatory for the National Research Council of Canada’s Herzberg Institute of Astrophysics.References
- Arp & Lorre (1976) Arp, H., Lorre, J., 1976, ApJ, 210, 58
- Borkowski & Dwek (1995) Borkowski, K.J., Dwek, E., 1995, ApJ, 454, 254
- Braine & Combes (1992) Braine, J., Combes, F., 1992, A&A, 264, 433
- Braine et al. (2000) Braine, J., Lisenfeld, U., Duc, P.-A., Leon, S. 2000, Nature, 403, 867
- Braine et al. (2001) Braine, J., Duc, P.-A., Lisenfeld, U., Charmandaris, V., Vallejo, O., Leon, S., Brinks, E., 2001, A&A, 378, 51
- Condon (1992) Condon, J.J., 1992, ARA&A, 30, 575
- Duc et al. (2000) Duc, P.-A., Brinks, E., Springel, V., Pichardo, B., Weilbacher, P., Mirabel, I.F., 2000, AJ, 120, 1238
- Gallagher et al. (2001) Gallagher, S.C., Charlton, J.S., Hunsberger, S.D., Zaritsky, D., Withmore, B.C., 2001, AJ, 122, 163
- Gao & Xu (2000) Gao, Y., Xu, C., 2000, ApJ, 542, L83
- Hollenbach & McKee (1980) Hollenbach, D., McKee, C.F., 1980, ApJ, 241, L47
- Hollenbach & McKee (1989) Hollenbach, D., McKee, C.F., 1989, ApJ, 342, 306
- Hunter & Gallagher (1986) Hunter, D.A., Gallagher, J.S., 1986, PASP, 98,5
- Iglesias-Páramo & Vílchez (2001) Iglesias-Páramo, J., Vílchez, P., 2001, ApJ, 550, 204
- Jones et al. (1996) Jones, A.P., Tielens, A.G.G.M., Hollenbach, D.J., 1996, ApJ, 469, 740
- Kennicutt (1998) Kennicutt, R.C., 1998, ApJ, 498, 541
- Mendes de Oliveira et al. (2001) Mendes de Oliveira, C., Plana, H., Amram, P., Balkowski, C., Bolte, M, 2001, AJ, 121, 2524
- Moles et al. (1997) Moles, M., Sulentic. J.W., Márquez, I., 1997, ApJ, 485, L69
- Perea et al. (1997) Perea, J., del Olmo, A., Verdes-Montenegro, L., 1997, ApJ, 490, 166
- Pietsch et al. (1997) Pietsch, W., Trinchieri, G., Arp, H., Sulentic, J.W., 1997, ApJ, 322, 89
- Sanders & Mirabel (1996) Sanders, D.B., Mirabel, I.F., 1996, ARA&A 34, 749
- Shostak et al. (1984) Shostak, B. J., Allen, R. J., Sullivan, W. T., III, 1984, A&A, 139, 15
- Smith & Struck (2001) Smith, B.J., Struck, C., 2001, AJ, 121, 710
- Sulentic et al. (2001) Sulentic, J. W., Rosado, M., Dultzin-Hacyan, D., Verdes-Montenegro, L., Trinchieri, G., Xu, C., Pietsch, W., 2001, AJ, 122, 2993
- Verdes-Montenegro et al. (1998) Verdes-Montenegro, L., Yun, M.S, Perea, J., del Olmo, A., Ho, P.T.P., 1998, ApJ, 497, 89
- Williams et al. (2002) Williams, B.A., Yun, M.S., Verdes-Montenegro, L., van Gorkom, J.H., 2002, AJ, 123, 2417
- Xu et al. (1999) Xu, C., Sulentic, J.W., Tuffs, R., 1999, ApJ, 512, 178
- Yun et al. (1997) Yun, M.S., Verdes-Montenegro, L., del Olmo, A., Perea, J., 1997, ApJ, 475, L21