Revealing the Focused Companion Wind in Cygnus X-1 with Chandra
Abstract
We have analyzed a Chandra/HETGS spectrum of the Galactic black hole Cygnus X-1, obtained at a source flux which is approximately twice that commonly observed in its persistent low-intensity, spectrally-hard state. We find a myriad of absorption lines in the spectrum, including Ly- lines and helium-like resonance lines from Ne, Na, Mg, and Si. We calculate a flux-weighted mean red-shift of km/s and a flux-weighted mean velocity width of km/s (FWHM) for lines from these elements. We also detect a number of transitions from Fe XVIII–XXIV and Ni XIX–XX in absorption; however, the identification of these lines is less certain and a greater range of shifts and breadth is measured. Our observation occurred at a binary phase of ; the lines observed are consistent with absorption in an ionized region of the supergiant O9.7 Iab companion wind. The spectrum is extremely complicated in that a range of temperatures and densities are implied. Prior Chandra/HETGS spectra of Cygnus X-1 were obtained in a similar transition state (at ) and in the low/hard state (at ). Considered together, these spectra provide evidence for a companion wind that is focused as it flows onto the black hole primary in this system.
Subject headings:
Black hole physics – relativity – stars: binaries (Cygnus X-1) – physical data and processes: accretion disks – X-rays: stars1. Introduction
Cygnus X-1 is the only known Galactic black hole which has displayed persistent X-ray activity since the dawn of X-ray astronomy. It is also a rare black hole binary in that it has a high-mass companion star (HDE 226868 — an O9.7 Iab supergiant; Gies & Bolton 1982, 1986). The mass of the black hole primary is most likely , and the mass of the companion secondary is most likely (Herrero et al. 1996).
At present, there are 14 Galactic systems with low-mass companions () for which optical radial velocity curves imply a primary with (the theoretical upper-limit for a neutron star mass; for a list of dynamically-constrained low-mass black hole systems see http://www.astro.uu.nl/orosz/). These systems are transients, undergoing outbursts in which the X-ray luminosity may change by factors of or more on scales ranging from days to months. It is logical, then, to associate the persistent nature of Cygnus X-1 with the fact that it is a high-mass X-ray binary (HMXB). While the companion wind is very likely to play an important accretion role in Cygnus X-1 — perhaps through a “focused wind” scenario (Friend & Castor 1982, Gies & Bolton 1986; see below) — numerous detections of the disk’s thermal spectrum, strong and broad Fe K emission lines, and strong disk reflection in Cygnus X-1 clearly demonstrate that standard disk accretion is also important in this system. The relative importance of the wind and disk in driving the accretion process and X-ray “states” in Cygnus X-1 is still uncertain (for a review of states, see Done et al. 2002; for a critical discussion see Homan et al. 2001).
Winds from isolated massive stars may be approximated as being spherically symmetric. Friend & Castor (1982) explored the geometry of winds from massive stars in the presence of a compact object. Due to the compact object’s gravity, continuum radiation pressure, and centrifugal forces from binary orbital motion, it was found that winds are likely to be strongly asymmetric if the mass donor is close to filling its critical Roche surface. The region of highest mass flux is likely to be along the axis connecting the compact object and mass donor components. Optical spectroscopy of HDE 226868 (Cygnus X-1) later revealed that modulations of the He II 4686 emission line could be described by this geometry, and that the bulk of this emission may come from a cone () along the connecting axis (Gies & Bolton 1986).
The sensitivity and resolution of previous X-ray observatories has been insufficient to directly probe this focused wind geometry. However, matters have improved greatly with the Chandra High Energy Transmission Grating Spectrometer (HETGS). Marshall et al. (2001a) discussed the detection of several highly ionized absorption lines in a 15 ksec Chandra/HETGS observation made in the persistent low-luminosity, hard spectrum state (at a binary phase of , defining as the point at which the companion is closest along our line of sight and based on the ephemeris of La Sala et al. 1998) commonly observed in Cygnus X-1. It is natural to associate the observed absorption features with the companion wind as the same lines have been observed in emission in a number of HMXBs with neutron star primaries. Schulz et al. (2002) report the detection of numerous emission and absorption features, and P-Cygni-type line profiles, in a prior 15 ksec Chandra/HETGS observation of Cygnus X-1 (at ) made in a state wherein the flux was approximately twice that reported by Marshall et al. (2001a).
We observed Cygnus X-1 with the Chandra/HETGS for 32.1 ksec on January 4, 2001, at a flux which was approximately twice that commonly observed in the “low/hard” spectral state (we likely observed the source in an “intermediate” state). The observation occurred at a binary phase of in the 5.6-day orbital period. The broad-band spectrum obtained in this observation is discussed by Miller et al. (2002). A composite Fe K emission line was revealed — the first such composite line clearly resolved in a binary black hole system. The broad component may be shaped by Doppler shifts and strong gravitational effects at the inner edge of an accretion disk extending close to the marginally stable circular orbit, while the neutral, narrow component may be produced in the outer accretion disk.
Herein, we report the results of our analysis of the time-averaged high resolution spectrum in the 6–24 Å (0.5–2.0 keV) band. While some of the lines we detect were also found by Marshall et al. (2001a) and Schulz et al. (2002), in this paper we present the first attempt to systematically fit a high-resolution spectrum of Cygnus X-1 and to measure the parameters of the strongest absorption and emission lines in this band. Moreover, it is clear that the spectrum we have observed differs considerably from those reported earlier, likely indicating that the appearance of the wind changes with orbital phase and the intensity of the source.
2. Observation and Data Reduction
We observed Cygnus X-1 on 4 January 2001, from 06:03:47 to 14:59:20 (UT), for a total of 32.133 ks. The observatory was still slewing onto the source during the first 900 s of this observation, so we do not include this data in our analysis. We exclude data acquired during a prominent 500 s dip in the X-ray lightcurve which occurs 25.7 ks into this observation. The remaining 30.733 ks is used for analysis.
To prevent severe photon pile-up, the dispersed spectrum from the HETGS was read-out with the ACIS-S array operating in continuous-clocking (Graded-CC) mode. To prevent telemetry saturation and frame-dropping, the zeroth-order photons were not read-out. This was achieved with a 100-row blocking window. A SIM-Z translation of + 4 mm (towards the top of the ACIS-S array) was used to limit wear and tear on the nominal ACIS-S3 aimpoint. A Y-coordinate translation of -80 arcseconds (towards S4) was used to place as much of the iron line region on S3 as possible.
At the time we started our analysis, the standard CIAO processing tools were unable to handle data taken in this mode. Therefore, we developed a robust set of custom processing routines. This processing method is described in great detail in a paper reporting results from a Chandra/HETGS observation of the Rapid Burster in outburst (Marshall et al. 2001b). All aspects of how the grating orders and background were selected, and how the data is corrected for the instrument response, are exactly those previously reported. The only important difference between that analysis, and our analysis of Cygnus X-1 is the blocking of the zeroth-order photons. By examining the location of the neutral Si absorption edges (due to the Si-based CCDs) in opposite grating orders in raw counts space, we were able to derive a zeroth-order position. This position was fine-tuned by fitting the most prominent absorption lines in opposite grating orders and requiring that the centroid wavelengths agree to within 0.05% uncertainty, which matches the HETG calibration uncertainty (Canizares et al., 2002, in prep.). We are confident that our wavelength calibration is equivalent to that for standard observing modes.
Fits to the high-resolution data were made using ISIS version 0.9.37 (Houck & Denicola 2000). Systematic errors were not added for our analysis of the narrow spectral features (in this mode, flux uncertainties across the full HETGS band may be 5%; Marshall et al. 2001b). We estimate that the effects of photon pile-up in our observation to be negligible. We also note instrumental features near 6.71Å (a single-bin “line” at HEG resolution near the Si K edge) and a broader feature at 7.96Å due to the instrumental Al K edge (Marshall 2002, in prep.).
3. Analysis and Results
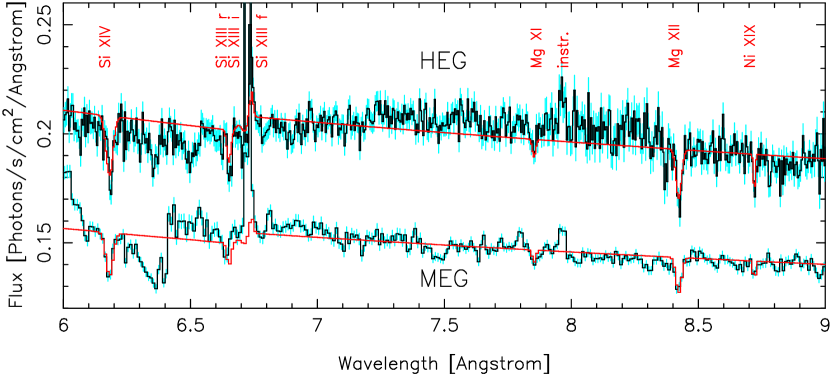
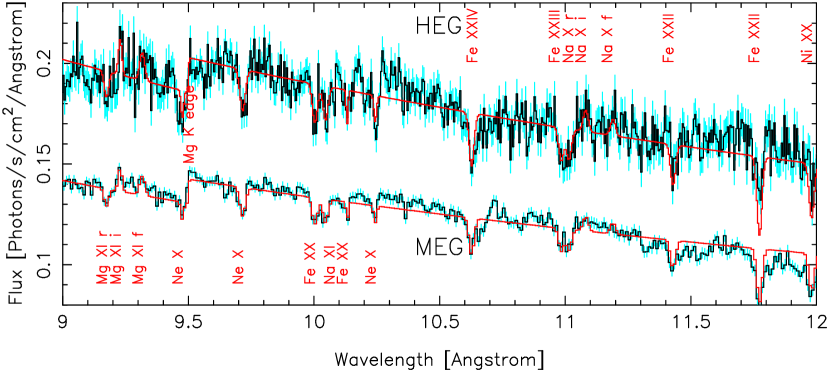
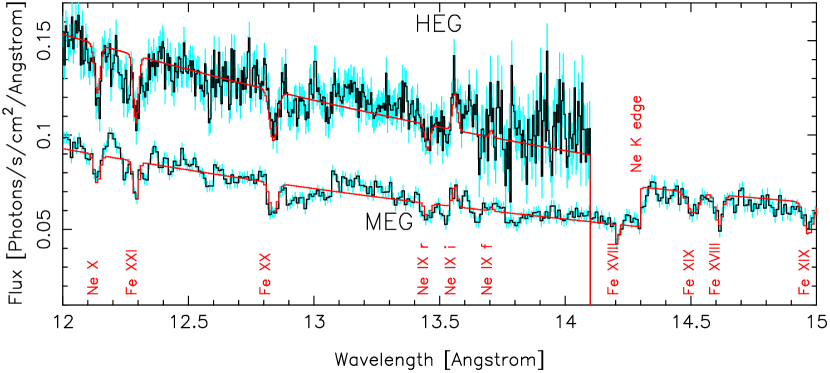
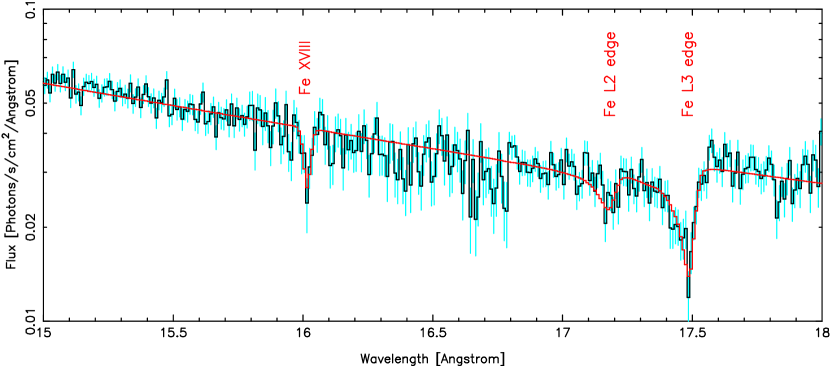
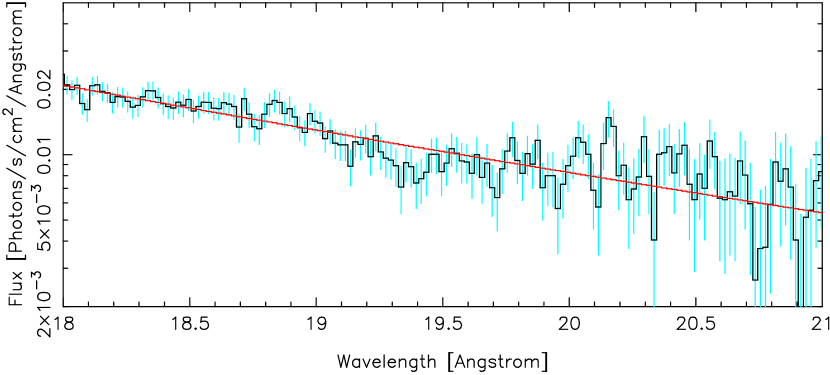
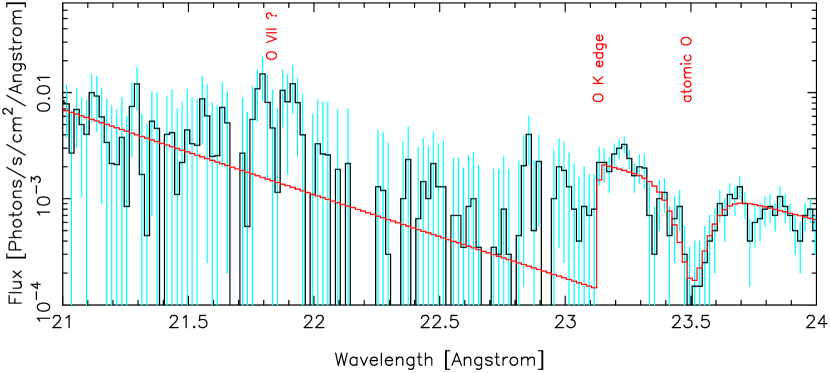
The most striking result of this observation is the wealth of absorption lines found in the 6–24Å range (concentrated in the 6–15Å band, see Figure 1 and Figure 2). Our fits to the absorption and emission features are listed in Table 1. Each line is significant at or above the 3 level of confidence unless noted explicitly as an upper-limit; 34 lines are detected and resolved.
In analyzing the high resolution spectrum in the 6–15Å range, we combine the HEG orders and MEG orders. These spectra were fit jointly with local single-component models for the continuum in contiguous 3Å segments. The HEG range does not extend to wavelengths longer than 14Å, so only the MEG spectrum is considered between 14–24Å. All of the lines in the high resolution spectra are fit with Gaussian profiles. We fit only the strongest features, with the requirement that the feature be evident in each of the four first-order spectra between 6–14Å, and in both first-order MEG spectra above 14Å. In cases where nearby line features might cause blending, the width is fixed to Å – the maximum line resolution of the HEG. For such lines, the FWHM is 0.0236 Å – just broader than the maximum line resolution of the MEG. This width is generally consistent with the lines in Table 1 for which the width was allowed to vary.
Identifications for the line features were made by assuming the transition with highest oscillator strength in the wavelength range of a given feature, using the line lists of Verner, Verner, & Ferland (1996) and Mewe, Gronenschild, & van den Oord (1985). It should be noted that many lines identified in this work may be blends, as Fe L shell transitions are present throughout this range. In examining Figure 1 and Figure 2, it is clear that a myriad of weaker lines exist in this spectrum which we have not identified here; the majority of these features are likely absorption lines from the Fe L-shell.
The column densities of observed lines are calculated using the
relation:
(1)
where is the column density of a given species, is the oscillator strength, is the equivalent width of the line, and is the wavelength of the line in cm units (Spitzer 1978). We take values for all resonant lines from Verner et al. (1996), and those for other lines from Mewe et al. (1985). In using this equation, we have implicitly assumed that we are on the linear part of the curve of growth and that the lines are not significantly saturated.
3.1. Absorption in the Interstellar Medium
We clearly detect the neutral K-shell absorption edges of O, Ne, Mg, and Si, and Fe-L3 and Fe-L2 edges in the 6–24Å range (see Figure 1, Figure 2). Following the procedure of Schulz et al. (2002) in a previous analysis of the ISM absorption edges in a Chandra spectrum of Cygnus X-1, we fit the K-shell edges with a simple step-function edge model based on the photoelectric cross sections of Henke, Gullikson, & Davis (1993) and elemental abundances relative to solar as per Morrison & McCammon (1983). We fit the Fe L edges with a model based on the cross sections of Kortright & Kim (2000).
We find that the wavelength, depth (), and abundances (relative to solar) implied by the K-shell edges are fully consistent with the values reported by Schulz et al. (2002) based on measurements at , and we refer the reader to that work for a full discussion. The depths of the Fe L edges are also consistent; again the edges are found at 17.51Å and 17.22Å (rather than 17.56Å and 17.23Å, perhaps indicating non-metallic contributions).
The transition from neutral (atomic) O is detected at Å with a flux of . The best-fit width of this line is quite large: Å. This line is likely saturated, however, so the flux and FWHM measurements are likely under-estimated and over-estimated, respectively.
3.2. Hydrogenic and Helium-like Ne, Na, Mg, and Si Lines
We clearly detect the Ly- lines of Ne, Na, Mg, and Si in absorption (see Figure 1 and Figure 2, and Table 1). The Ne series is seen in absorption from Ly- to Ly-. The helium-like resonance () lines of these elements are also clearly detected in absorption. We also fit the inter-combination () and forbidden () lines from these elements, which are observed to be in emission. Due to a nearby error in the the instrument response we tie the Si emission line width and strength to those values measured for the line. The Si line is not clearly detected, and measurements should be regarded as upper-limits. Similarly, the Ne line parameters should be regarded as upper-limits.
The measured equivalent widths of the Ne Ly series do not decrease steadily in strength from Ly- to Ly- as one would expect from the oscillator strengths for these lines (see Table 1). This suggests that the Ne Ly series absorption lines may be partially saturated, or that regions of different density are seen simultaneously (also supported by the inconsistent FWHM values we measure). It is also possible that unresolved Fe L-shell transitions contribute to the absorption, and that the lines are actually blends. Inconsistent line strengths and column densities are also measured from the helium-like Ne, Na, Mg, and Si triplets, though some of these are poorly constrained and/or upper-limits (see Table 1).
Including the helium-like and hydrogenic lines from Ne, Na, Mg, and Si for which the FWHM could be constrained, we calculate a flux-weighted mean FWHM of km/s. For the same lines, we calculate a flux-weighted mean red-shift of km/s.
3.3. Highly-Ionized Fe and Ni Lines
A number of lines which we identify with transitions from Fe XVIII–XXIV are also detected, as well as lines which may be from Ni XIX and Ni XX. It must be noted that the identification of these line is less certain than those from lower-Z elements, and this may account for a greater spread in the implied bulk velocity shifts and velocity widths measured for these lines.
We used a boot-strap method to identify lines in this spectrum. The Ly series lines from lower-Z elements are fewer than the numerous transitions from the Fe L-shell, and spaced at regular intervals. Most of those lines are measured to have slight red-shifts, or to be consistent with zero bulk velocity. In examining other lines, then, we made the assumption that observed lines should lie relatively close to their rest-frame wavelengths. However, some are observed at blue-shifts (e.g., Fe XVIII at 14.257Å – blue-shifted by 1000 km/s). The identifications given to these lines are tentative, but reflect the transition with highest oscillator strength in the given region.
As with the lower-Z lines, the measured strengths and implied column densities for multiple lines from the same species are not consistent. Again, in such cases it is possible that the given line is actually a blend.
3.4. Other Line Features
We note a pair of marginal emission features at 21.8 Å and 21.9 Å. Although the sensitivity of the spectrum is limited in this range, modeling these lines improves the fit in this region. The line at 21.8 Å can be identified as the the O VII line. In general, this triplet line is only expected in isolation if produced in a very dense region. For this reason, it is tempting to associate this line with the accretion disk. It is possible that the line at 21.9 Å is a second O VII line, part of a Doppler-shifted pair that are at an overall red-shift. In this case, the overall red-shift is km/s and the separation implies a Doppler shift of km/s. While the Doppler shift is plausibly associated with the outer accretion disk, the overall red-shift of the pair is not.
3.5. Constraints on the Companion Wind at
While the observed spectrum is clearly very complicated, some basic inferences can be made. Miller et al. (2002) find that the broad-band spectrum from this observation of Cygnus X-1 is strongly dominated by a power-law component, and that the source was at a luminosity of (0.65–10 keV). Assuming a power-law input flux and overall luminosity of ergs/s in the soft X-ray band, Kallman & McCray (1982) have calculated the temperatures at which absorption lines from given elemental species will be at peak strength. Here, we list these temperatures for select species: for Ne IX, log(T)4.5-5.0; for Ne X, log(T)5.0-5.5; for Si XII, log(T)5.2-5.7; and for Si XIV, Fe XVIII, and Fe XIX, log(T)5.5-6.0. Thus, the absorption features we detect arise in regions that span over an order of magnitude in temperature. Given the range in ionization states observed and temperatures implied, it is likely that the gas in the line of sight cannot be described by a single ionization parameter (, where is the luminosity, is the hydrogen number density, is the hydrogen equivalent column density, and is radius). If may be assumed to be relatively steady, then may vary significantly along our line of sight.
A number of additional constraints can be derived by considering the ionization fractions expected in this regime. Kallman & Bautista (2001) have calculated the ionization fractions expected for a gas with typical wind characteristics, again assuming a power-law input flux and overall luminosity of ergs/s in the soft X-ray band. The hydrogen equivalent column density for resonance absorption lines is given by (where is the hydrogen equivalent column density for a given resonance line, is the column density for that line as noted in Table 1, is the ionization fraction for the given ion species, and is the solar abundance of the given element relative to H).
We find that the hydrogen equivalent column densities of helium-like and hydrogenic resonance lines from given single elements are broadly self-consistent for those elements: . As noted previously, the Ne Ly series is likely partially saturated. Performing the above exercise using the Ne Ly- and Ne Ly- lines gives ; this likely serves as a lower-limit estimate on the hydrogen equivalent column density of Ne X. With the exception of the Fe XIX lines at 14.93Å and 14.97Å, the hydrogen equivalent column densities for the ionized Fe species (Fe XVIII–XXIV) are below .
Comparing again to Kallman & Bautista (2001), the absorption region can be described by ionization parameters between , corresponding to distances from the central ionizing source of cm. If we assume that the binary separation of Cygnus X-1 is , and that the radius of HDE 226868 is (consistent with the parameters derived by LaSala et al. 1998), then the black hole is approximately cm from the companion surface. The distances implied by the range of ionization parameters are far below this separation. This disparity can be seen a second way: if the companion wind is spherically symmetric and our line of sight extends through a distance similar to the black hole companion-surface separation, assuming typical stellar wind densities () we would expect to measure hydrogen equivalent column densities of . In contrast, the strong majority of the estimates we have obtained are below this range.
The / line intensity ratio for a given helium-like element can be used to measure the density of emitting material. Porquet & Dubau (2000) have calculated densities as a function of the gas temperature for a number of elements, including Ne, Mg, and Si among the lines we have detected. Dividing the column density measurements obtained via equation (1) by these densities, then, an estimate of the physical depth of the absorbing gas along our line of sight may be obtained. We assume the temperatures of peak absorption for Ne IX, and Si XIII from Kallman & McCray (1982), and assume the appropriate temperature for Mg XI lies between these values. As the and lines we observe are weak, their intensities may be regarded as upper-limits. The linear depth estimates we obtain via the calculations of Porquet & Dubau are not very constraining: we find lower-limits of only 10-100 m.
Finally, we do not find convincing evidence of P-Cygni line features like those reported by Schulz et al. (2002) at . This fact may indicate that the appearance of such line profiles is phase-dependent; it is also possible that the appearance of nearby emission and absorption features is coincidental, as suggested by the authors.
4. Discussion
We have performed the first systematic fits to the line-rich low-energy spectrum of Cygnus X-1. The temperatures, velocities, and densities implied by the weak, narrow lines in the spectrum are consistent with absorption in an ionized portion of the companion wind. The spectrum we have observed from Cygnus X-1 is dominated by absorption lines, however, which stands in strong contrast to the spectra observed from other HMXBs. ASCA and Chandra observations of Vela X-1 (Sako et al. 1999, Schulz et al. 2002b) and Cen X-3 and (Wojdowski, Liedahl, & Sako 2001) reveal emission line spectra due to recombination in a photoionized companion wind (the emission lines are most prominent in eclipse, but persist outside of eclipse). A recent Chandra observation of Cygnus X-3 revealed many of the same strong emission lines independent of orbital phase (Paerels et al. 2000).
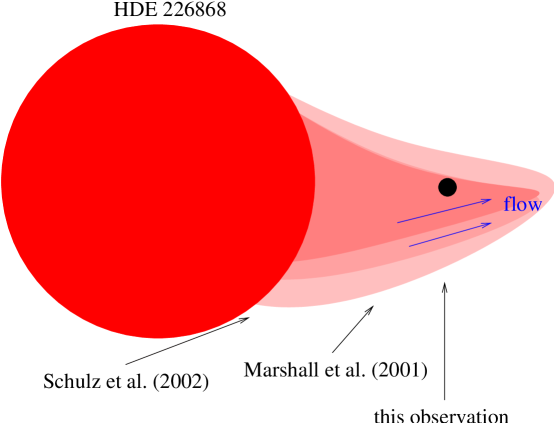
While the spectrum of Cen X-3 can be modeled in terms of a spherically-symmetric wind centered on the neutron star (Wojdowski, Liedahl, & Sako 2001), the absorption spectrum of Cygnus X-1 may require dense material preferentially along the line of sight. A relative lack of material outside of the line of sight is also required to explain the absence of resonance emission lines excited by photoionization from the central accretion engine. The inclination of Cygnus X-1 is rather low (; Gies & Bolton 1986), so it is unlikely that the absorption region can be associated with the outer accretion disk or a warm (few keV) disk atmosphere. As optical observations of Cygnus X-1 (Gies & Bolton 1986) have already provided evidence for a focused wind geometry, we suggest that such a geometry might also explain the X-ray spectrum we have observed. In the discussion below, we first examine the evidence for a focused wind from this and other recent Chandra observations of Cygnus X-1. We then address the implications of the neutral absorption features and the impact of this observation on our understanding of Cygnus X-1.
4.1. Evidence for a Focused Wind Geometry
Kallman & Bautista (2001) have calculated ionization fractions and ionization parameters for a gas with properties consistent with stellar winds, for an incident spectrum similar to that measured here (Miller et al. 2002). The ionization parameters consistent with the observed absorption spectrum () imply distances between the source and absorbing gas ( cm) that are far less than the distance between the black hole and the companion surface ( cm; LaSala et al. 1998). Moreover, the estimates we obtain for the equivalent neutral hydrogen column densities for various elements generally lie well below expectations for a spherically symmetric wind (assuming that our line of sight through the wind is comparable to the separation between the black hole and companion surface).
An examination of the velocities implied by the absorption lines also supports a focused wind geometry. For the Ly- and helium-like resonance lines from Ne, Mg, Na, and Si, we measure a flux-weighted mean red-shift of 100 km/s and flux-weighted mean FWHM of 800 km/s (again, our observation occurred at ). Marshall et al. (2001a) report a number of absorption lines with a mean red-shift of 450 km/s and a typical FWHM of 300 km/s at . This is consistent with the expectation that the a focused flow should be largely transverse to the line of sight at intermediate phase points, and have a greater component along the line of sight at other phases.
Schulz et al. (2002) report marginal evidence for ionized Fe transitions with P-Cygni-type line profiles at . This may indicate that the wind from the companion surface opposite to the X-ray source may have a significant radial component. The absence of such line profiles at more intermediate phases (this work; Marshall et al. 2001a) suggests that the wind does not have a radial component of typical strength at phases away from conjunction.
We suggest that when considered together, these spectra may provide the first direct evidence in X-rays for a focused wind geometry in Cygnus X-1 (see Figure 3 for a possible geometry). The column densities measured from absorption lines are smaller than expected for a spherically symmetric wind geometry. At an intermediate phase point the flow is mostly transverse to the line of sight; at points closer to superior conjunction, the flow has smaller transverse velocities and higher velocities parallel along the line of sight. Finally, very close to superior conjunction, the wind from the face of the companion opposite to the X-ray source may have a radial component; indeed P-Cygni profiles may have been observed by Schulz et al. (2002a).
A caveat is that the observation reported on by Marshall et al. (2001a) occurred in the low/hard state typically observed in Cygnus X-1, while this observation and that discussed by Schulz et al. (2002a) were made during transitional states with higher fluxes. At present, it is not clear how the source state and wind are related. Moreover, all three observations were separated by several months, and the nature of the wind may vary with the long-term period in this system (e.g., Brocksopp et al. 1999). The observation of narrow, blue-shifted absorption lines from low-Z elements near to inferior conjunction and broadened lines near would strengthen the evidence for a focused wind accretion geometry. Future observations with the Chandra/HETGS (or XMM-Newton/RGS) achieving sensitivities similar to those observations considered here will be required for this purpose.
4.2. Neutral Absorption Edges, and the Atomic O Absorption Line
We measure absorption edge depths from neutral atoms in the interstellar medium that are consistent with those reported by Schulz et al. (2002). This suggests that any cold absorbing gas intrinsic to Cygnus X-1 does not vary with orbital phase. Although the atomic O line is saturated (and its profile therefore distorted) in both observations, the width we measure (FWHMÅ) is roughly twice the width measured previously.
The width of the O lines measured in observations of Cygnus X-1 are factors of 10–20 higher than the width of the same line measured in a Chandra/LETGS spectrum of the neutron star 4U 0614091 (Paerels et al. 2001). Although the lines in Cygnus X-1 are saturated, this disparity is likely larger than can be attributed solely to distortion of the line Cygnus X-1 profile. It is possible that the variation can be accounted for by different turbulent velocities in the neutral oxygen intrinsic to each system. However, due to the ionizing X-ray flux from accretion onto the compact object in these systems, little neutral oxygen is expected locally. We suggest that the atomic O line, then, may serve as a probe of turbulent velocities in the ISM along different lines of sight. Studies of the Galactic H I power spectrum which suggest that column density variations due to cold gas may be dominated by localized velocity field fluctuations (Dickey et al. 2001). At present, this is a relatively unexplored regime in X-ray astronomy but well within the reach of current observatories.
4.3. Understanding the Accretion Geometry in Cygnus X-1
Future analysis and observations will achieve a better understanding of the degree to which the wind in Cygnus X-1 may be focused, and its temperature and density characteristics. In the near future, then, it may be possible to constrain the mass accretion rate onto the black hole via focused wind accretion. Comparisons to the observed X-ray luminosity will then indirectly provide a constraint on the mass delivered to the black hole via disk accretion.
Constraints of this kind are important for a number of reasons. Cygnus X-1 often serves as a standard for testing models for accretion flow geometries and state transitions based on the mass accretion rate (such as advection-dominated accretion flow models, or “ADAFs”; see, e.g., Esin et al. 1998). This source is also a testbed for X-ray “reflection” models (see, e.g., Ross, Fabian, & Young 1999), which suggest that the innermost accretion flow geometry in Cygnus X-1 may be very similar to that in some AGN. In both cases, a central source of hard X-rays (a “corona”) is important, as is an accretion disk (some reflection models suggest that an ionized transition layer may lie on top of the accretion disk). Neither family of models has considered the role of the companion wind, or the nature of disk-wind or corona-wind interactions.
Although the timing properties of Cygnus X-1 are well-studied (see, e.g., Pottschmidt et al. 2002), quasi-periodic oscillations (QPOs) have never been observed at high frequencies (“high” is somewhat arbitrary, is a reasonable distinction). Such QPOs have been very useful in constraining black hole spin in systems such as GRO J165540 (Strohmayer 2001); in contrast spin can only be investigated in Cygnus X-1 via spectroscopy (e.g., Miller et al. 2002). It is possible that the companion wind in Cygnus X-1 acts to dampen high-frequency signals preferentially; when a better understanding of the wind geometry and density is achieved this possibility can be addressed.
At present, Cygnus X-1 is the only Galactic HMXB for which a black hole primary is required. LS 5039 may provide an interesting comparison: the companion is an O6.5 V(f) supergiant (which does not fill its critical Roche radius), the orbital period is 4.1 days, and its distance is likely 3.1 kpc (McSwain & Gies 2002). Our preliminary analysis of archival ASCA data suggests that LS 5039 is very weak in X-rays relative to Cygnus X-1: (0.5–10.0 keV). This may underscore the importance of disk accretion via Roche-lobe overflow in Cygnus X-1. At present, the nature of the compact object in LS 5039 is not known. Even if the primary in LS 5039 is a neutron star, this system bears important similarities to Cygnus X-1, and we look forward to spectroscopy of this source with Chandra and XMM-Newton.
5. Acknowledgments
We wish to thank Chandra Director Harvey Tananbaum, and the Chandra staff for executing this observation and their help in processing the data. We wish to recognize John Houck and David Huenemoerder for their insights, and the CXC/ISIS team. We thank Claude Canizares, Michael Nowak, and Bryan Gaensler for helpful insights. We acknowledge Adrienne Juett for sharing the specialized Fe L absorption model. RW was supported by NASA through Chandra fellowship grants PF9-10010, which is operated by the Smithsonian Astrophysical Observatory for NASA under contract NAS8–39073. WHGL gratefully acknowledges support from NASA. This research has made use of the data and resources obtained through the HEASARC on-line service, provided by NASA-GSFC.
References
- (1)
- (2) Arnaud, K., & Dorman, B., 2000, XSPEC is available via the HEASARC on-line service, provided by NASA-GSFC
- (3)
- (4) Balucinska-Church, M., Church, M. J., Charles, P. A., Nagase, F., LaSala, J., & Barnard, R., 2000, MNRAS, 311, 861
- (5)
- (6) Bolton, C. T., 1972, Nature, 235, 271
- (7)
- (8) Brocksopp, C., et al., 1999, MNRAS, 309, 1063
- (9)
- (10) Dickey, J. M., McClure-Griffiths, N. M., Stanimirovic, S., Gaensler, B. M., & Green, A. J., 2001, ApJ, 561, 264
- (11)
- (12) Done, C., 2002, in “Philosophical Transactions of the Royal Society,” Seires A: Mathematical, Physical, and Engineering Sciences, astro-ph/0203246
- (13)
- (14) Esin, A. A., Narayan, R., Cui, W., Grove, J., & Zhang, S. N., 1998, ApJ, 505, 854
- (15)
- (16) Friend, D. B., & Castor, J. I., 1982, ApJ, 261, 393
- (17)
- (18) Gies, D. R., & Bolton, C. T., 1982, ApJ, 260, 240
- (19)
- (20) Gies, D. R., & Bolton, C. T., 1986, ApJ 304, 371 & 389
- (21)
- (22) Henke, B. L., Gullikson, E. M., & Davis, J. C., 1993, ADNDT, 54, 181
- (23)
- (24) Herrero, A., Kudritzki, R. P., Gabler, R., Vilchez, J. M., & Gabler, A., A & A, 297, 556
- (25)
- (26) Homan, J., et al., 2001, ApJS, 132, 377
- (27)
- (28) Houck, J. C., & Denicola, L. A., Astronomical Data Analysis Software and Systems IX, in ASP Conference Proceedings, volume 216, eds. N. Manset, C. Veillet, & D. Crabtree
- (29)
- (30) Kallman, T. R., & McCray, 1982, ApJS, 50, 263
- (31)
- (32) Kallman, T., & Bautista, M., ApJS, 133, 221
- (33)
- (34) Kitamoto, S., et al., 1984, PASJ, 36, 731
- (35)
- (36) Kortright, J. B., & Kim, S.-K., 2000, Phys. Rev. B, 62, 12216
- (37)
- (38) LaSala, J., Charles, P. A., Smith, R. A. D., Balucinska-Church, M., & Church, M. J., 1998, MNRAS, 301, 285
- (39)
- (40) Lee, J. C., Reynolds, C. S., Remillard, R., Schulz, N. S., Blackman, E. G., & Fabian, A. C., 2002, ApJ 567, L1102
- (41)
- (42) Mewe, R., Gronenschild, E. H. B. M., & van den Oord, G. H. J., 1985, A & AS, 62, 197
- (43)
- (44) Marshall, H. L., Schulz, N. S., Fang, T., Cui, W., Canizares, C. R., Miller, J. M., & Lewin, W. H. G., 2001a, Proc. of “X-ray Emission from Accretion onto Black Holes,” Eds. T. Yaqoob and J. Krolik, astro-ph/0111464
- (45)
- (46) Marshall, H. L., et al., 2001b, AJ, 122, 21
- (47)
- (48) McSwain, M. V., & Gies, D. R., 2002, ApJ, 568L, 27
- (49)
- (50) Miller, J. M., et al., 2002a, ApJ, in press, astro-ph/0202083
- (51)
- (52) Morrison, R., & McCammon, D., 1983, ApJ, 270, 119
- (53)
- (54) Paczynski, S., 1974, A & A, 34, 161
- (55)
- (56) Paerels, F., et al., 2000, ApJ, 533, L135
- (57)
- (58) Paerels, F., et al., 2001, ApJ, 546, 338
- (59)
- (60) Porquet, D., and Dubau, J., 2000, A & AS, 143, 495
- (61)
- (62) Pottschmidt, K., et al., 2002, A & A., subm., astro-ph/0202258
- (63)
- (64) Ross, R. R., Fabian, A. C., & Young, A. J., 1999, MNRAS, 306, 461
- (65)
- (66) Sako, M., Liedahl, D. A., Kahn, S. M., & Paerels, F., 1999, ApJ, 525, 921
- (67)
- (68) Schulz, N. S., Cui, W., Canizares, C. R., Marshall, H. L., Lee, J. C., Miller, J. M., and Lewin, W. H. G., 2002a, ApJ, 565, 1141
- (69)
- (70) Schulz, N. S., Canizares, C. R., Lee, J. C., & Sako, M., 2002, 564, L21
- (71)
- (72) Spitzer, L., 1978, New York, Wiley-Interscience, 1978, p52
- (73)
- (74) Strohmayer, T. E., 2001, ApJ, 552L, 49
- (75)
- (76) Verner, D. A., Verner, E. M., & Ferland, G. J., 1996, ADNDT, 64, 1
- (77)
- (78) Wojdowski, P. S., Liedahl, D. A., & Sako, M., 2001, ApJ, 547, 973
- (79)
| Ion and | Theor. | Meas. | Shift | FWHM | W | Flux | NZ | |
| Transition | (Å) | (Å) | (km/s) | (Å) | (km/s) | (mÅ) | ( ph/cm2/s) | () |
| Si XIV 1s-2p | 6.1822 | 6.1808(9) | 20(50) | 36(3) | ||||
| Si XIII r | 6.6408 | |||||||
| Si XIII i | 6.690 | 6.690 | – | 2.36 | 1100 | 1.6(1.3) | ||
| Si XIII f | 6.740 | 6.7366(3) | 150(20) | 1.8 | 800 | 2.0 | 3.0 | |
| Mg XI | 7.8505 | 7.853(3) | 600(200) | 11(3) | ||||
| (1s2-1s3p) | ||||||||
| Mg XII 1s-2p | 8.4210 | 8.423(1) | 2.6(3) | 900(100) | 16(1) | |||
| Ni XIX | 8.7250 | 8.720(1) | 160(30) | -1.6(3) | 24(5) | |||
| (2p6-2p56d) | ||||||||
| Mg XI r | 9.1688 | 9.174(2) | ||||||
| Mg XI i | 9.230 | 9.229(2) | 600(200) | 2.5(4) | 3.5(6) | 4.6(8) | ||
| Mg XI f | 9.319 | 2.36 | 800 | 2.8(4) | 4.9(7) | |||
| Ne X 1s-5p | 9.4807 | 9.476(2) | 400(200) | 140(40) | ||||
| Ne X 1s-4p | 9.7082 | 2.6(3) | 170(20) | |||||
| Fe XX | 9.991 | 2.36 | 700 | 33(3) | ||||
| (2s22p3-2p4d) | ||||||||
| Na XI 1s-2p | 10.0250 | 2.36 | 700 | 9(1) | ||||
| Fe XX | 10.120 | 10.132(1) | 0.8(4) | 230(130) | ||||
| (2s22p3-2p4d) | ||||||||
| Ne X 1s-3p | 10.2389 | 10.244(2) | 1.2(3) | 350(90) | ||||
| Fe XXIV | 10.619 | 10.628(1) | 2.36 | 670 | 21(2) | |||
| (1s22s-1s23p) | ||||||||
| Fe XXIII | 10.981 | 2.36 | 650 | |||||
| (2s2-2s3p) | ||||||||
| Na X r | 11.0027 | 2.36 | 640 | 4.1(6) | ||||
| Na X i | 11.080 | 2.36 | 640 | 3.0(6) | 3.2(6) | |||
| Na X f | 11.190 | 11.190(5) | 0(130) | 2.36 | 630 | 2.1(5) | ||
| Fe XXII | 11.440 | 2.36 | 620 | |||||
| (2s22p-2s2p()3p) | ||||||||
| Fe XXII | 11.770 | 11.773(1) | 2.36 | 600 | ||||
| (2s22p-2s23d) | ||||||||
| Ni XX | 11.980 | 11.981(2) | 2.36 | 600 | ||||
| (2s22p5-2s2p5(3P)3p) | ||||||||
| Ne X 1s-2p | 12.1339 | 19(2) | ||||||
| Fe XXI | 12.285 | 12.292(1) | 2.36 | 580 | ||||
| (2s22p2-2s22p3d) | ||||||||
| Fe XX | 12.820 | 12.839(2) | 13(1) | |||||
| 2s22p3-2p2(3P)3d | ||||||||
| Ne IX r | 13.4471 | 2.36 | 530 | 6.2(1.2) | ||||
| Ne IX i | 13.550 | 13.561(4) | 2.36 | 520 | 10(1) | |||
| Ne IX f | 13.700 | 13.700 | – | 2.36 | 520 | |||
| Fe XVIII | 14.257 | |||||||
| (1s22p5-2p4(1D)3d) | ||||||||
| Fe XIX | 14.53 | 1100(300) | ||||||
| (2s22p4-2p3(2P)3s) | ||||||||
| Fe XVIII | 14.610 | |||||||
| (2s22p5-2p4(3P)3d) | ||||||||
| Fe XIX | 14.97 | 7.1 | 1400 | 290(4) | ||||
| (2s22p4-2p3(4S)3s) | ||||||||
| Fe XVIII | 16.012 | |||||||
| (2s22p5-2p4(3P)3s) | ||||||||