Damped Lyman systems and disk galaxies: number density, column density distribution and gas density
Abstract
We present a comparison between the observed properties of damped Ly systems (DLAs) and the predictions of simple models for the evolution of present day disk galaxies, including both low and high surface brightness galaxies. We focus in particular on the number density, column density distribution and gas density of DLAs, which have now been measured in relatively large samples of absorbers. From the comparison we estimate the contribution of present day disk galaxies to the population of damped Ly systems, and how it varies with redshift. Based on the differences between the models and the observations, we also speculate on the nature of the fraction of DLAs which apparently do not arise in disk galaxies.
keywords:
galaxies: evolution, galaxies: formation, galaxies: spiral, quasars: absorption lines1 Introduction
The true nature of the galaxies responsible for high redshift damped Ly systems (DLAs, absorbers seen in quasar spectra with H I column densities (H I) cm-2) is largely unconstrained. At present, there are two main competing scenarios for their origin. One school of thought sees DLAs as the (large) progenitors of massive spiral disks (Wolfe et al. 1986; Lanzetta et al. 1991). The gas disks would have formed at through monolithic collapse, and this gas is converted to stars over a Hubble time. In support of this picture Prochaska & Wolfe (1998) argued that the kinematics of the metal absorption lines in DLAs are best explained if they are formed in thick, large, and rapidly rotating galactic disks, with circular velocities km s-1. However, this large disk hypothesis runs counter to currently popular models of hierarchical structure formation in which present day galaxies are assembled from virialized sub-units over a protracted time interval (). Haehnelt et al. (1998) argued that hydrodynamic N-body simulations are able to reproduce the velocity structure of the absorption lines with infalling sub-galactic clumps in collapsing dark matter haloes with small virial velocities ( km s-1).
More generally, the kinematics and metallicites of DLAs have been interpreted as evidence that they arise in spiral galaxies (Fritze-V.Alvensleben et al. 2001; Hou, Boissier & Prantzos 2001), low surface brightness galaxies (Jimenez, Bowen & Matteucci 1999), dwarf galaxies (Matteucci, Molaro & Vladilo 1997), the progenitors of globular clusters (Burgarella, Kissler-Patig, & Buat 2001), the building blocks of current galaxies (Tissera et al. 2001), galaxies undergoing tidal stripping and mergers (Maller et al. 2001), and outflows from dwarf galaxies (Schaye 2001a).
Observationally, imaging studies of the fields of QSOs with damped systems have shown conclusively that the absorbers are a very ‘mixed bag’, which includes galaxies of different luminosities and surface brightnesses, down to objects with apparently no associated stellar populations which remain undetected even in very deep images (Steidel et al. 1994, 1995; Le Brun et al. 1997; Lanzetta et al. 1997; Fynbo et al. 1999; Pettini et al. 2000; Turnshek et al. 2001; Bowen, Tripp, & Jenkins 2001; Kulkarni et al. 2000, 2001; Colbert & Malkan 2002). While it seems clear that selection based on H I absorption cross-section picks out a variety of galaxies, it is of interest to establish if one particular class of objects dominates and, if so, whether the dominant population changes with cosmic epoch.
In this paper we assess the contribution of the progenitors of today’s disk galaxies to the DLA population at different redshifts by comparing the most up to date observational determinations of several properties of DLAs with models of the chemical and spectrophotometric evolution of disk galaxies, including low surface brightness (LSB) galaxies. Specifically, we have compiled recent data on the number density per unit redshift, the column density distribution and its integral, which gives the total mass of H I traced by DLA, for a large sample of DLAs. These data are presented in §2, while the models of disk galaxies are discussed in §3. In §4 we compare our predictions with the statistical properties of DLAs, as well as with available imaging observations of the galaxies identified as DLA absorbers. We further speculate on what the differences we find at high redshift between models and observations may be telling us about the earliest population of DLAs. We summarise and discuss our results in §6.
Throughout the paper we adopt the currently favoured cosmology km s-1 Mpc-1, , .
2 DLA observations
The data used in this paper are a compilation of several surveys at high (Storrie-Lombardi et al. 1996; Storrie-Lombardi & Wolfe 2000; Péroux et al. 2002) and low redshifts (Rao & Turnshek 2000; Churchill 2001). From these observations we extract information on three properties of DLAs which our models attempt to reproduce.
The first, and most straightforward, quantity is the number density per unit redshift , plotted in Figure 1.
The second quantity is the column density distribution, obtained from the expression:
| (1) |
where is the number of DLAs with hydrogen column density between and detected in the spectra of QSOs encompassing a total absorption distance . The absorption distance is related to redshift by the expression (Peebles 1993):
| (2) |
where
| (3) |
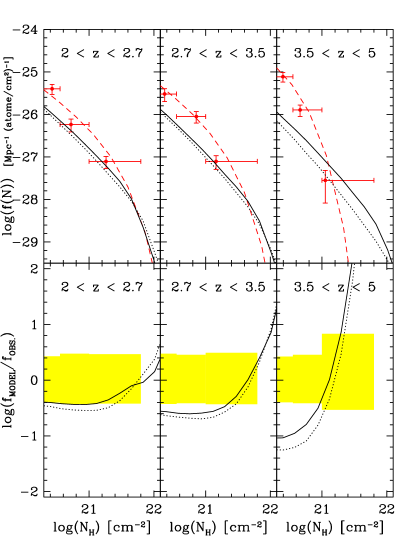
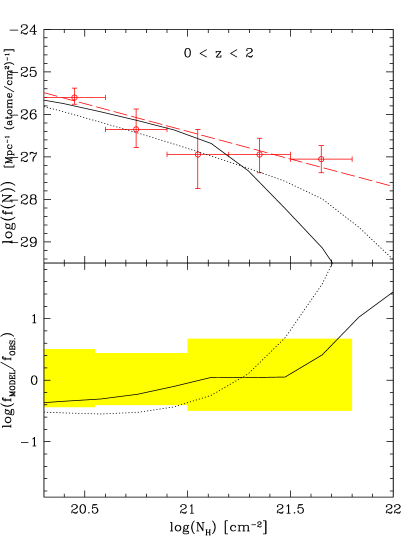
Even with our relatively large sample, the statistics of are still limited, and necessitate dividing the data in only a few bins, both in and (see top panels of Figures 2 and 3). Also shown in these panels are the fits to the column density distributions derived by Péroux et al. (2002), assuming that is well approximated by a function (similar to the galaxy luminosity function). These fits were based on a larger range of column densities than that shown here, extending to the lower values of (H I) appropriate to Lyman Limit systems (i.e. (H I) cm-2).

The integral of the column density distribution gives us the third quantity of interest, the total mass of neutral gas traced by QSO absorbers. It is customary to express this as a fraction of the closure density:
| (4) |
where is the mass of the hydrogen atom, is the mean atomic weight per baryon ( for solar abundances; Anders & Grevesse 1989) and is the closure density ( gm cm-3, where is the Hubble constant in units of 100 km s-1 Mpc-1). Values of are plotted in Figure 4.
It is important to bear in mind that all the DLA surveys considered here used QSOs selected from magnitude limited samples. It has long been a concern (e.g. Pei & Fall 1995) that in these surveys QSOs that lie behind dusty DLA systems will be under-represented, and that the statistics discussed above may therefore be incomplete and biased by an unknown amount. One way to determine the extent of such dust-induced bias is to consider the properties of DLAs in a complete, radio-selected, QSO sample, where dust is not an issue. The only such study conducted to date is the CORALS survey by Ellison et al. (2001). Although the CORALS statistics are still limited, it would appear that—at least as far as is concerned—dust bias is a relatively minor effect, since the CORALS value is consistent with the earlier estimates within the errors of measurement (see lower panel of Figure 4).

3 Models of Disk galaxies
3.1 Basic Properties of the Models
In Boissier & Prantzos (2000) a ‘bivariate’ family of spiral galaxies was described by considering disks with various rotational velocities, , and spin parameters, . In the local universe, the volume density of galaxies with a given value of can be deduced from the Tully-Fisher relationship and the luminosity function (Gonzalez et al. 2000). In the following, we adopt the distribution corresponding to the parameters listed in the fifth row of Table 4 of Gonzalez et al., with between 80 and 360 km s-1. The spin parameter is a dimensionless measure of the angular momentum of the dark matter halo surrounding the disk, and is given by:
| (5) |
where and are respectively the energy and mass of the dark matter halo.
In the general framework of Cold Dark Matter theories, the final properties of the disk (its mass , scale-length , and central surface density ) can be derived under simple assumptions on the relationship between the disk and the dark matter halo (see, for example, Mo, Mao, &White 1998). The scaling relations
| (6) |
| (7) |
| (8) |
(where the suffix refers to the Milky Way) are then used to relate these quantities to those of our Galaxy, assumed to be a typical spiral disk.
Our models used these scaling relations to compute the chemical evolution in zones at different distances from the centres of disks with various rotational velocities and spin parameters. The history of each galaxy (for a given set of values of and ) was derived by a ‘backward’ approach from observations of samples of nearby galaxies and calibrated on the Milky Way (see Boissier & Prantzos 1999, 2000; and Boissier et al. 2001 for more details). The resulting histories are characterised by an early formation of massive galaxies, while star formation occurs on longer timescales in less massive galaxies, following the infall of pristine gas.
3.2 The Spin Parameter Distribution and Low Surface Brightness Galaxies
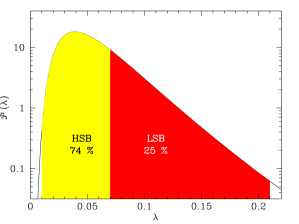
In our treatment we adopt the distribution of spin parameters derived from N-body simulations (Mo et al. 1998) and reproduced in Figure 5. Boissier & Prantzos (2000) considered values for the spin parameter between and 0.09 and found that, within the framework of simple models of chemical and spectrophotometric evolution of spirals, values of apply to low surface brightness galaxies, with blue central surface brightness greater than 22.5 mag arcsec-2, while galaxies with are ‘normal’ spirals. As can be seen from Figure 5, the former account for 25% of the total number of galaxies in the distribution (integrating between ), while the latter contribute 74% (integrating between ). In this work we assumed that this population of LSB disks does indeed exist and we accordingly extended the models of Boissier et al. (2001) to larger values of than those considered in that paper in order to take fully into account this LSB population. Furthermore, we renormalised the distribution in Figure 5 so that its integral over the range of values of appropriate to normal, high surface brightness, disks () is equal to 1. This is because the normalisation of the distribution of velocities , derived from the observed galaxy luminosity function, does not include low surface brightness galaxies. While this treatment of LSB galaxies is simplistic, it does nevertheless allow us to test, in the framework of our model, their contribution to the DLA absorber population.
3.3 Model Predictions for the Number Density, Column Density Distribution, and Total Gas Mass of DLAs
Prantzos & Boissier (2000) and Hou et al. (2001) considered the chemical evolution of the family of models of disk galaxies described above. In the zones within the galaxies where the gas density is sufficiently high to give a column density of neutral gas (H I) 2 1020 cm-2, the models match the chemical properties of DLAs, both in the overall degree of metal enrichment and in the more detailed abundance pattern of different chemical elements. However, in those treatments good agreement could only be achieved by imposing a ‘dust filter’, whereby DLAs with large column densities of metals (and therefore presumably dust) are excluded from the samples, for the reasons explained in §2. This dust filter was based on the analysis by Boissé et al. (1998) and takes the form
| (9) |
where [Zn/H] is the abundance of Zn relative to solar (in the usual notation) and is the column density of hydrogen atoms (in units cm-2). The filter operates in such a way that zones within a model galaxy which do not satisfy eq. (9) were not taken into account, on the assumption that such DLAs have been overlooked in existing surveys.
Here we extend the work of Prantzos & Boissier (2000) and Hou et al. (2001) by using the models to make predictions for other properties of DLAs (specifically those discussed in §2), with the aim of assessing what fraction of DLAs are the precursors of today’s disk galaxies. We adopt the same ‘backward’ approach as in the earlier work and, like those authors, consider the effect of a dust filter defined as in eq. (9). Our treatment is broadly similar to that first adopted by Lanzetta (1993), but with the following major improvements: (i) we use models which predict the evolution of present day galaxies back in time; (ii) we include in the models of a variety of galaxy morphologies, masses, sizes, and surface brighteness; and (iii) we are able to compare with the much larger data base of measurements of DLAs available now, ten years since the pioneering work of Lanzetta (1993).
The number density of DLAs per unit redshift can be expressed as (Peebles 1993)
| (10) |
with as defined in eq.(3).111 Note that the predicted value of therefore depends on the cosmological model assumed, whereas the observed value does not; the opposite is true for the column density distribution and . The quantity is the product of the volume density of galaxies and their cross-sections, averaged over the whole population
| (11) |
where is the contribution to the total cross-section by galaxies with spin parameter and rotational velocity , given by
| (12) |
Here represents the integral over the apparent surface of the galaxy, and is the integration over all inclination angles. The parameter is a switch which can take the values of 1 or 0. For example, it can be set to 1 independently of all other parameters in order to compute the geometrical cross section. The value of (1 or 0) can also be determined by the inclination and the local properties of galaxies (metallicity and gas density, both functions of the distance from the galactic center) to exclude zones in galaxies which do not meet the DLA selection criteria, because either of the conditions (H I) cm-2 or (the dust filter in eq. 9) is not satisfied. Then, is set to 0 in these zones, and 1 elsewhere.
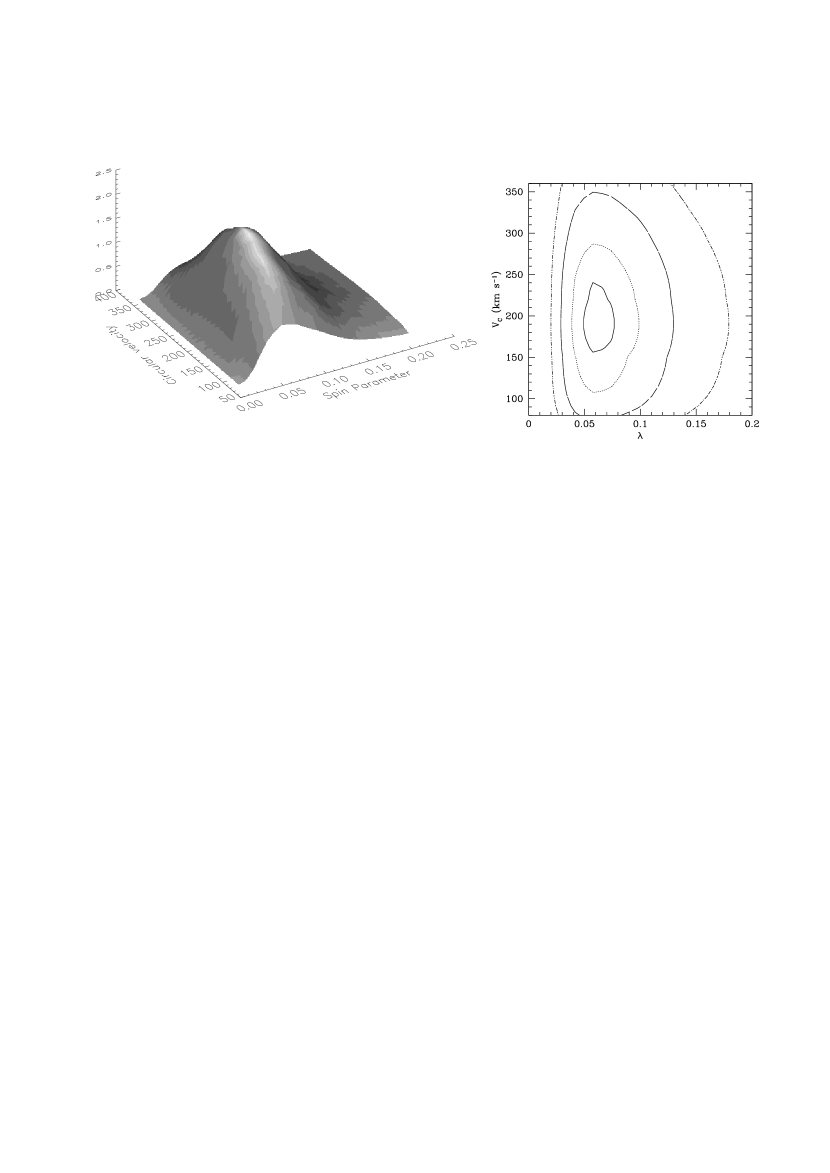
Figure 6 shows the function for . From this figure it can be seen that, in our models, the major contribution to the cross-section for absorption (taken at this stage to be five times the scale length of the radial distribution of mass without considering separately the distributions of the stellar and gaseous components) is from galaxies with relatively high rotational velocities ( km s-1) and intermediate values of spin parameter (), at the border line between high and low surface brightness galaxies. This is straightforward to understand, since it is the product of and which determines the linear dimensions of galaxies. From the figure it would also appear that the ranges of values of and adopted are sufficiently broad to account for most of the cross-section. However, we may have underestimated the total cross-section if the faint end slope of the luminosity function is sufficiently steep that dwarf galaxies with km s-1 make a non-negligible contribution. Such galaxies are not included in the models considered here because we are chiefly concerned with disk galaxies.
We predict the column density distribution numerically by computing for each interval of column density [, ] the number of systems given by eqs. (11) and (12). The total neutral gas mass in DLAs is calculated from the expression
| (13) |
which is similar to eqs. (11) and (12), but with the second integral now inluding , the mass surface density along the line of sight. The result of eq. (13) can then be compared with the observed value of , as given by eq. (4). In both cases, was set to 0 if (H I) cm-2 or if the condition imposed by eq. (9) was not met.
3.4 Neutral Atomic Gas
The models of chemical evolution which we use to describe disk galaxies compute the surface density of the total amount of interstellar matter, in all its forms. On the other hand, for the comparison with the observed properties of DLAs we are interested only in the neutral atomic gas component. We do not consider the fraction of gas in ionised form because it is likely to be unimportant for our purposes. In the Galactic disk, for example, ionised gas accounts for less than 1% of the total gas mass of (Osterbrock 1974). Similarly, we can ignore the mass fraction in solid form (dust grains), which for solar composition is less than 2% (Anders & Grevesse 1989) and would be even lower at the low metallicities typical of DLAs (e.g. Pettini et al. 1997).
The correction for molecular gas is also likely to be of minor importance for the following reasons. From straightforward geometrical considerations the cross-section for absorption is always dominated by the outer regions of the disks where, in local galaxies at least, the molecular fraction is low. In the Milky Way, for example, H2 makes a significant contribution to the total gas profile only at small radii (in a molecular ring at kpc), while the outer disk is totally dominated by atomic gas (e.g. Dame 1993). CO observations of nearby spiral galaxies show that the molecular gas density decreases more steeply with radius than the atomic gas, and becomes a minor component beyond a few kpc (e.g. Boissier et al. 2002). In LSB galaxies the molecular fraction is observed to be very small (e.g. Matthews & Gao 2001). In any case, it is now well established that in DLAs (H2) (H I) (Petitjean, Srianand & Ledoux 2002). Thus, in our models we take (H I) = (HTOT) (but correct the total gas density for the helium fraction). When we tried to compute the molecular fraction, using a recipe which links H2 to the star formation and calibrating on the Milky Way, we obtained results which are indistinguishable from those obtained assuming that all the gas is in atomic form.
4 The Contribution of Disk Galaxies to the Population of DLAs
We are now ready to compare the output of our models with the statistical properties of DLAs summarised in §2. The results are illustrated in Figures 1–4 and are discussed individually below.
4.1 Number Density
As can be seen from Figure 1, our models reproduce satisfactorily (bearing in mind the large uncertainties in the data) the observed number density of DLAs per unit redshift in the interval . It is interesting to note that our simplistic treatment of LSB galaxies, which essentially extrapolates the properties of normal spirals to larger values of the spin parameter (see §3.2), predicts approximately equal contributions to () from high and low surface brighteness galaxies over this redshift interval. As we shall see, the available imaging data summarised in §5.1 are consistent with this rough breakdown.
Figure 1 also shows that our models underpredict () at by factors of several; while the data show a continuous increase with look-back time, the predicted number density flattens off and decreases beyond . In reality, the observed increase in () with is consistent with the no-evolution scenario where the product of the comoving number density and cross-section of DLA absorbers remains constant in time—the measured () increases simply because the scale factor of the universe decreases with . Thus, the flattening of () in the calculations reflects the delayed and protracted epoch of disk formation in the models. From this we conclude that either today’s disk galaxies were assembled earlier than predicted by our models, or a different class of objects is responsible for the majority of damped systems observed at .
4.2 Column Density Distribution
The observed and predicted column density distributions are compared in Figures 2 and 3. At the agreement is fair, considering the large uncertainties in the data. The models tend to predict more high (H I) DLAs than observed, but this could be due to small number statistics (although it is interesting that a similar discrepancy is found with N-body simulations—see Katz et al. 1996; Schaye 2001b; and Cen et al. 2002 for relevant discussions). At the agreement is also acceptable (Figure 3). Again we find a discrepancy at the high column density end of the distribution, but this time the models tend to underpredict the number of DLAs with log (H I) [(H I) in cm-2] compared with the observations by Rao & Turnshek (2000). It would clearly be highly desirable to improve the statistics at this end of the distribution with more extensive surveys for DLAs at all redshits.
Returning to Figure 2, it appears that the agreement between the models and the data becomes progressively worse as we move to ; the steepening of () with increasing uncovered by Péroux et al. (2002) is not reproduced by the models. Taken at face value, this is another indication of a change in the population of galaxies responsible for DLAs; while the precursors of today’s disks can account for the column density distribution at low and intermediate redshifts, at an additional population, with typically lower values of (H I), seems to take over.
4.3 Mass Density
From Figure 4 it can be seen that our disk models underpredict by about a factor of two at all redshifts, although at the uncertainties in the determination of this quantity are so large that they do encompass our model predictions.
All of the above results were obtained with the dust filter described in §3.3 (eq. 9). The lower panel of Figure 4 shows the effect of removing such a filter and including in the statistics all DLAs, irrespectively of their metallicity and column density. We find that although does increase, the effect is not large, amounting to an upwards correction by a factor of at , in good agreement with the empirical finding by Ellison et al. (2001). In retrospect this is not surprising. The condition imposed by eq. (9), log((H I))+[Zn/H]) , is not satisfied primarily in massive galaxies (statistically less favoured by the shape of the luminosity function) and in the inner regions of galaxies (statistically less favoured because they present a smaller cross-section than the outer regions). It is thus quite natural that the dust filter should not remove a major fraction of potential DLAs. Figure 4 shows the dust bias being most important at . It remains to be seen, once the statistics of DLAs at these redshifts are improved, whether this is indeed the case. At present the uncertainties in the values of deduced by Rao & Turnshek (2000) are so large that either set of models (with and without dust obscuration) is consistent with the observations.
4.4 Comparison with the Earlier Analysis by Lanzetta
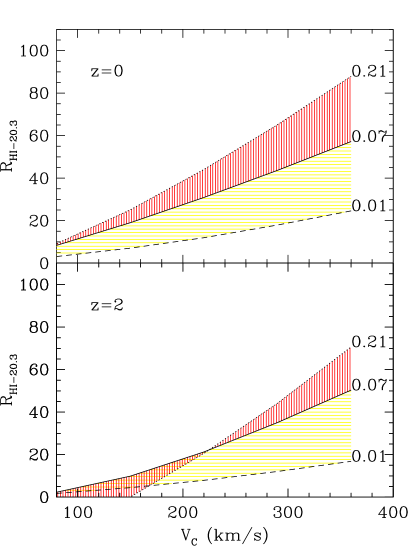
As mentioned above, our treatment is similar to that first originally implemented by Lanzetta (1993), although we have introduced several important refinements. It is thus of interest to compare our conclusions with his. In particular, Lanzetta was forced to conclude that the incidence of DLAs required gaseous disks with typical radii of kpc, greater than the typical dimensions of galaxies today, both in their stellar Holmberg radii and in their cross-sections at (H I) cm-2. Figure 7 shows the cross-sections of galaxies in our models as a function of rotational velocity and spin parameter, at two different redshifts. Considering these plots in conjunction with those in Figure 6, it can be realised that such large radii are in fact not unexpected in our models once the contribution by LSB galaxies to the DLA population is taken into account.
4.5 Comparison with Imaging Data at Low and Intermediate Redshifts
| QSO | (kpc) | Type | Confirmed | Refs | ||||
|---|---|---|---|---|---|---|---|---|
| HS1543+5921 | 0.009 | 0.5 | 0.01 | LSB | yes | (a) | ||
| OI363 | 0.0912 | 0.12 | LSB | (b) | ||||
| OI363 | 0.2213 | 23 | 0.16 | Dwarf | yes | (b) | ||
| 0952+179 | 0.239 | 8.1 | Patchy/irr LSB | (b,g) | ||||
| 1127145 | 0.313 | 19.7 | 0.04 | Patchy/irr LSB | yes | (b,g) | ||
| PKS1229021 | 0.3949 | 8 | 0.6 | Irr. | (c,d) | |||
| 3C196 | 0.437 | 9 | 2.8 | Spiral | (c) | |||
| 0827+243 | 0.518 | 40.2 | 2.3 | Spiral? | yes | (b,g) | ||
| Q1629+120 | 0.532 | 20.3 | 1.5 | Spiral | (g) | |||
| 0058+019 | 0.6118 | 8.7 | 0.6 | Spiral | (e) | |||
| Q1209+107 | 0.6295 | 11.9 | 1.9 | Spiral | (c) | |||
| 3C286 | 0.692 | 19.1 | 1.3 | LSB | (d) | |||
| MC1331+170 | 0.7443 | 30.4 | 3.0 | Edge-on Spiral | (c) | |||
| PKS0454+039 | 0.8596 | 6.6 | 0.6 | Compact | (c) |
In the last few years there have been many attempts to identify the galaxies responsible for producing damped Ly systems by deep imaging. We have collected in Table 1 all available data from the literature pertaining to DLAs at (where the results are most straightforward to interpret), restricting ourselves to cases where only one galaxy was found close to the QSO sight-line. Column (3) gives the projected QSO-galaxy separations in our km s-1 Mpc-1, , cosmology. Column (4) and (5) list the absolute magnitudes of the putative absorbers in this cosmology, in either the rest frame or band; in deriving these values from the observed magnitudes we applied -corrections appropriate to the SED of an Sbc galaxy (Bruzual & Charlot 1993). The galaxy luminosities are given in units of in column (6), adopting (Cole et al. 2001) and (Norberg et al. 2002). Column (7) gives an indication of the galaxy morphology as reported in the original sources referenced in the last column of the Table; cases where the identity of the absorber has been confirmed with follow-up spectroscopy are indicated in column (8).
The data collected in Table 1 form a small and far from homogeneous sample. Furthermore, in most cases there is no spectroscopic confirmation that the closest galaxy to the QSO sight-line is indeed the DLA absorber. Nevertheless, these observations are all we have at our disposal at present, and it is still worthwhile to consider qualitatively how they compare with the predictions of our models. Considering first the galaxy morphologies, the sample includes six apparently ‘normal’ spirals and five LSBs. This breakdown is broadly in line with our expectations from Figure 1 at .222It should be noted here that the definition of LSB in our models is based on whether the spin parameter is larger than 0.07 . Owing to the larger star formation rate in the past in the models, some galaxies with at actually have values of central surface brightness somewhat greater than 22.5 mag arcsec-2. However, this is not expected to affect significantly the finding that spirals and LSB galaxies make comparable contributions to the DLA cross-section because the morphology classifications listed in Table 1 are only approximate estimates. A further three galaxies do not appear to be spiral disks but have been classified by the original observers as irregular/dwarf/compact. The fraction may be higher because our sample in Table 1 does not include non-detections; nevertheless, preliminary indications are that this additional population of galaxies—which we have not considered here—is unlikely to make a major contribution to the DLA statistics. Only a uniform survey to well defined detection limits can address this question quantitatively.
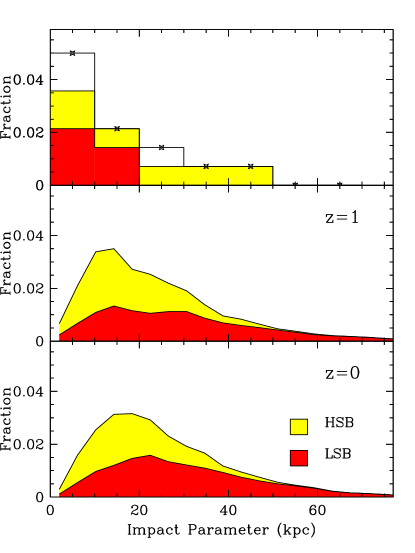
Figure 8 compares the observed and predicted distributions of projected impact parameters ; the latter were calculated for random orientations of the galaxies on the plane of the sky. Within the limitations imposed by the small size of the sample, the observations apparently favour smaller values of than predicted. In some cases, misidentifications of the closest galaxy to the QSO sight-line as the absorber may be the reason for this apparent discrepancy. The models predict an extended tail at large impact parameters which cannot yet be discerned with the limited data available; it will be of interest to test this prediction with future surveys.
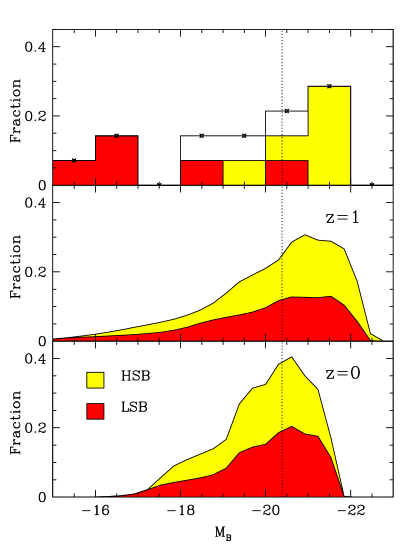
Figure 9 compares the observed and predicted distributions of . To improve the limited statistics, we have used the values of in column (6) of Table 1 (which in all but three cases were based on either -band or -band magnitudes, but did agree in the three cases where magnitudes in both bands are available) to calculate from the relation (Norberg et al. 2002). Evidently, our models of disk galaxies can reproduce reasonably well the magnitudes of the brighter galaxies associated with DLAs, but do not extend to the low luminosities of the faintest absorbers in the sample. Again, the relatively high frequency of faint LBGs in the present sample of DLA galaxies needs to be investigated further with more extensive imaging surveys before firm conclusions can be drawn.
5 The Population of DLAs at High Redshifts
As discussed in §4 and shown in Figures 1–4, our models for disk galaxies provide a progressively poorer match to observations of DLAs beyond . Taken at face value, this may indicate that the precursors of present day spiral galaxies—evolved back in time according to our models which do not include merging—are insufficient to account for the observed numbers of DLAs and that an additional population of absorbers is required. We investigate this point further in Figure 10. In the top panel we show, on a log scale and as a function of redshift, the ratio of the observed number of DLAs (per unit redshift) to the number which can be attributed to the progenitors of today’s disks according to our models. Thus this plot shows the ratios between the data points and the line labelled ‘TOTAL’ in Figure 1. While at disks can account for the number density of DLAs within the uncertainties in both the data and the model predictions, at redshift DLAs are nearly ten times more numerous than predicted. This excess evidently decreases rapidly with time, approximately by a factor of two per unit redshift in the interval (dashed line).
The bottom panel of Figure 10 shows the contribution of our model disk galaxies to the observed value of (the ratios between the data points and the line labelled ‘TOTAL’ in the top panel of Figure 4). Also shown in this panel is the progressive transfer of baryons from the overall gas reservoir—from which disks are formed in our models—into galaxies, as disks form and grow with time. Evidently, disks can account for approximately half of at all epochs (as already shown in Figure 4). In other words, it appears that the additional population of absorbers which dominate the number counts of DLAs at the highest redshifts do not make a significant contribution to compared with the baryons which are in disks. This is reflected by the steepening of the column density distribution with increasing redshift found by Péroux et al. (2002) and shown in Figure 2.

A possible interpretation of these results is that the ‘excess’ population of DLAs at high redshift are small structures, of relatively low column density, which progressively merge with each other and with more massive galaxies to form the progenitors of today’s disk galaxies by . This scenario, which at the moment can only be regarded as speculative, would explain at the same time the observed decrease of () and flattening of the column density distribution (resulting in relatively more numerous systems of high column density) with the progress of time from to 2. Observationally, this scenario is consistent with: (a) the initial results of imaging searches for the galaxies responsible for DLAs at which suggest that they are fainter than (Prochaska et al. 2002); and (b) the low metallicity—typically 1/100 of solar, only marginally higher than that of the intergalactic medium traced by the Ly forest—of DLAs at these high redshifts (Prochaska & Wolfe 2002).
6 Summary and Conclusions
In this paper we have used the models developed by Boissier & Prantzos (2000), which describe the chemical and spectrophotometric evolution of disk galaxies of different surface brightnesses, to assess whether the progenitors of present day spirals can account for the population of DLA absorbers, as is often assumed. To this end, we have compared the model predictions with several, recently determined, statistical properties of DLAs, in particular their number density per unit redshift, their column density distribution, and its integral which gives , the total mass of neutral gas traced by DLAs. In addition we have brought together available imaging data on these absorbers at from the literature, to compare with the morphologies, sizes and luminosities of the model galaxies. Our main results can be summarised as follows.
1. The models are reasonably successful at reproducing many of the properties of DLAs at redshifts , within the uncertainties in the measurements. Specifically, the number density of absorbers per unit redshift and about half of the neutral gas mass they trace can be reproduced with evolving disk galaxies in our models. Dwarf galaxies, which have not been considered here, may account for some of the DLA absorbers, but this population is not the dominant one.
2. Normal spirals and low surface brightness galaxies make comparable contributions in our models to both the numbers of DLAs and their neutral gas mass. Turning this statement around, it is only with the inclusion of LSBs that it is possible to reproduce the statistics of DLAs in our models. While LSBs may not be as numerous as high surface brightness galaxies, their large dimensions and high gas content combine to make a significant contribution to the overall cross section for H I absorption. The scant imaging data available at is broadly in agreement with this conclusion, although the observed distribution of impact parameters seems to be narrower, and more peaked towards lower values of , than our models predict. The distributions of luminosities agree at the bright end, but the data also include a few cases of very faint DLA-producing galaxies which are not predicted by the models. More uniform and extensive imaging surveys are required to reach firm conclusions on both of these points. Furthermore, the properties of LSBs, which have been included in our models according to a rather simple recipe, need to be investigated further for a proper comparison with DLAs.
3. We have investigated the effects of a possible dust-induced bias in current DLA samples, which may lead to an underestimate of the relative number of sightlines through galactic regions where the column densities of gas and metals are both high. We have found this potential problem to have a relatively minor effect, particularly on , in agreement with the initial results from the CORALS survey by Ellison et al. (2001).
4. As we move from to higher redshifts, models
based on extrapolating back in time the properties of
today’s disk galaxies are progressively less successful
in reproducing the statistics of DLAs.
The data can be interpreted as evidence for the
existence of an additional population of DLAs, of generally
lower column density, which dominate the number
density of absorbers over the progenitors of today’s disks
beyond . Possibly these are sub-units destined
to merge with each other and eventually with more massive
galaxies by . This interpretation is supported
by the failure up to now to detect the galaxies producing
DLAs at in deep images reaching down to
.
The history of assembly of today’s galactic disks may
well be reflected in the redshift evolution of the number
density of DLAs.
Samuel Boissier would like to acknowledge the support of a Framework 5 Marie Curie fellowship through contract number HPMF-CT-2000-00521.
References
- [] Anders E., Grevesse N., 1989, Geochim. Cosmochim. Acta, 53, 197
- [1] Boissé P., Le Brun V., Bergeron J., Deharveng J., 1998, A&A, 333, 841
- [Boissier et al.2001] Boissier S., Boselli A., Prantzos N., Gavazzi G., 2001, MNRAS, 321, 733
- [Boissier et al.2002] Boissier S., Boselli A., Prantzos N., Gavazzi G., 2002, A&A, submitted
- [2] Boissier S., Prantzos N., 1999, MNRAS, 307, 857
- [3] Boissier S., Prantzos N., 2000, MNRAS, 312, 398
- [4] Bolzonella M., Miralles J.-M., Pelló R., 2000, A&A, 363, 476
- [Bowen, Tripp, , Jenkins(2001)] Bowen D. V., Tripp T. M., Jenkins E. B., 2001, AJ, 121, 1456
- [5] Bruzual A. G., Charlot S., 1993, ApJ, 405, 538
- [Burgarella, Kissler-Patig, & Buat(2001)] Burgarella D., Kissler-Patig M., Buat V., 2001, AJ, 121, 2647
- [] Cen R., Ostriker J.P., Prochaska J.X., Wolfe A.M., 2002, ApJ, submitted (astro-ph/0203524)
- [Churchill(2001)] Churchill C. W., 2001, ApJ, 560, 92
- [] Colbert, J.W., & Malkan M.A., 2002, ApJ, 566, 51
- [6] Cole S. et al., 2001, MNRAS, 326, 255
- [Dame 1993] Dame T. M., 1993, AIP Conf. Proc. 278: Back to the Galaxy, 267
- [7] Ellison S., Yan L., Hook I., Pettini M., Wall J., Shaver P., 2001, A&A, 379, 393
- [] Fritze-V.Alvensleben U., Lindner U., Möller C.S., Fricke K.J., 2001, ApSS, 276, 1007
- [Fynbo, Møller, & Warren(1999)] Fynbo J. U., Møller P., Warren S. J., 1999, MNRAS, 305, 849
- [8] Gonzalez A., Williams K., Bullock J., Kolatt T., Primack, J., 2000, ApJ, 528,145
- [Haehnelt et al. 1998] Haehnelt M. G., Steinmetz M., Rauch M., 1998, ApJ, 495, 647
- [9] Hou J. L., Boissier S., Prantzos N., 2001, A&A, 370, 23
- [Jimenez, Bowen, & Matteucci(1999)] Jimenez R., Bowen D. V., Matteucci F., 1999, ApJ, 514, L83
- [] Katz N., Weinberg D.H., Hernquist L., Miralda-Escude J., 1996, ApJ, 457, L57
- [] Kulkarni V.P. et al., 2000, ApJ, 536, 36
- [] Kulkarni V.P. et al., 2001, ApJ, 551, 37
- [Lanzetta 1993] Lanzetta K. M., 1993, ASSL Vol. 188: The Environment and Evolution of Galaxies, 237
- [] Lanzetta K. M. et al. 1997, AJ, 114, 1337
- [Lanzetta et al. 1991] Lanzetta K. M., McMahon R. G., Wolfe A. M., Turnshek D. A., Hazard C., Lu L., 1991, ApJS, 77, 1
- [10] Le Brun V., Bergeron J., Boissé P., Deharveng J.M., 1997, A&A 321, 733
- [11] Maller A.H., Prochaska J.X., Somerville R.S., Primack J.R., 2001, MNRAS, 326, 1475
- [Matteucci, Molaro, & Vladilo(1997)] Matteucci F., Molaro P., Vladilo G., 1997, A&A, 321, 45
- [Matthews & Gao(2001)] Matthews L. D. , Gao Y., 2001, ApJ, 549, L191
- [12] Mo H., Mao S., White S. 1998, MNRAS, 295, 319
- [13] Nestor D., Rao S., Turnshek D., Monier E., Lane W., Bergeron J., 2001, ASP Conf. Ser. ”Extragalactic Gas at Low Redshift”, J. Mulchaey and J. Stocke, eds (astro-ph/0108146)
- [14] Norberg, P. et al. 2002, MNRAS, in press (astro-ph/0111011)
- [Osterbrock 1974] Osterbrock D., 1974, Astrophysics of Gaseous Nebulae, W.H. Freeman and Company, San Francisco
- [Peebles 1993] Peebles P. J. E., 1993, Principles of physical cosmology, Princeton Univ. Press, Princeton, NJ
- [] Pei Y. C., Fall S. M., 1995, ApJ, 454, 69
- [15] Péroux C., McMahon R., Storrie-Lombardi L., Irwin J., 2002, MNRAS, in press (astro-ph/0107045)
- [16] Petitjean P., Srianand R., Ledoux C., 2002, MNRAS, in press (astro-ph/0201477)
- [Pettini et al.(2000)] Pettini M., Ellison S. L., Steidel C. C., Shapley A. E., Bowen D. V., 2000, ApJ, 532, 65
- [] Pettini M., King D.L., Smith L.J.,Hunstead R.W., 1997, ApJ, 478, 536
- [17] Prantzos N., Boissier S., 2000, MNRAS, 315, 82
- [18] Prochaska J.X., Wolfe, A., 1998, ApJ, 507, 113
- [19] Prochaska J.X., Wolfe, A., 2002, ApJ, 566, 68
- [] Prochaska J.X. et al. 2002, AJ, 123, 2206
- [20] Rao S., Turnshek D., 2000, ApJS, 130, 1
- [Schaye(2001)] Schaye J., 2001a, ApJ, 559, L1
- [] Schaye J., 2001b ApJ, 562, L95
- [Steidel et al. 1994] Steidel C. C., Pettini M., Dickinson M., Persson S. E., 1994, AJ, 108, 2046
- [Steidel et al. 1995] Steidel C. C., Pettini M., Hamilton D., 1995, AJ, 110, 2519
- [Steidel et al. 1997] Steidel C. C., Dickinson M., Meyer D. M., Adelberger K. L., Sembach K. R. 1997, ApJ, 480, 568.
- [21] Storrie-Lombardi L. J., McMahon R. G. M., Irwin M., 1996, MNRAS, 283, 79
- [22] Storrie-Lombardi L. J., Wolfe A.M., 2000, ApJ, 543, 552
- [] Tissera P., Lambas D.G., Mosconi M.B., Cora S., 2001, ApJ, 557, 527
- [23] Turnshek D., Rao S., Lane W. M., Monier E., Nestor D., Bergeron J., Smette A., 2001, ASP Conf. Ser. 240: Gas and Galaxy Evolution, 61.
- [Wolfe et al. 1986] Wolfe A. M., Turnshek D. A., Smith H. E., Cohen R. D., 1986, ApJS, 61, 249