GMOS Spectroscopy of SCUBA galaxies behind A 851
Abstract
We have identified counterparts to two submillimeter (submm) sources, SMM J09429+4659 and SMM J09431+4700, seen through the core of the cluster A 851. We employ deep 1.4-GHz observations and the far-infrared/radio correlation to refine the submm positions and then optical and near-infrared imaging to locate their counterparts. We identify an extremely red counterpart to SMM J09429+4659, while GMOS spectroscopy with Gemini-North shows that the radio source identified with SMM J09431+4700 is a hyperluminous infrared galaxy (LL⊙) at , the highest spectroscopic redshift so far for a galaxy discovered in the submm. The emission line properties of this galaxy are characteristic of a narrow-line Seyfert-1, although the lack of detected X-ray emission in a deep XMM-Newton observation suggests that the bulk of the luminosity of this galaxy is derived from massive star formation. We suggest that active nuclei, and the outflows they engender, may be an important part of the evolution of the brightest submm galaxies at high redshifts.
Subject headings:
cosmology: observations — galaxies: individual (SMM J09429+4659; SMM J09431+4700) — galaxies: evolution — galaxies: formation1. Introduction
Sensitive surveys in the submm and millimeter wavebands have identified a population of distant dusty, active galaxies which may represent the formation phase of massive spheroidal galaxies (Smail, Ivison & Blain 1997; Hughes et al. 1998; Bertoldi et al. 2000; Scott et al. 2002; Webb et al. 2002). Irrespective of the precise mechanism responsible for the prodigious luminosity of these galaxies, either star formation or dust-reprocessed radiation from an AGN, several have been confirmed as high redshift massive, gas-rich galaxies (Frayer et al. 1998, 1999). One of the most pressing issues for study is to identify the most distant examples. These provide a critical test of theoretical models of galaxy formation and evolution, which already struggle to produce sufficiently large gas masses in galaxies at (Granato et al. 2002). Identifying similarly luminous, gas- and dust-rich mergers at even higher redshifts, , will provide even stronger constraints.
In this letter we discuss the identification and spectroscopic follow-up of two recently discovered submm galaxies in the field of the cluster A 851. Exploiting very deep radio and optical/near-infrared images we identified counterparts to both submm sources and subsequently targetted them in spectroscopic observations with the GMOS spectrograph on Gemini-North. One of these galaxies has the highest spectroscopic redshift for a SCUBA galaxy to date, at . We adopt a cosmology with , and H km s-1 Mpc-1.
2. Observations and Reduction
The two SCUBA galaxies discussed here were identified by Cowie, Barger & Kneib (2002) in a deep 850m SCUBA map of A 851 ( mJy). These observations also detected SMM J09429+4658, previously catalogued and studied by Smail et al. (1999, 2002a). The two new sources are SMM J09431+4700 (09 43 03.96 +47 00 16.0, all coordinates are J2000), which has an 850m flux density of 10.5mJy, and SMM J09429+4659 (09 42 53.49 +46 59 52.0) at 4.9-mJy. Cowie et al. (2002) use a detailed lens model for the cluster to estimate that these sources are likely to be amplified by a factor of 1.2 and 1.3 respectively.
The 1.4-GHz VLA map used in our analysis reaches a 1- noise level of 3.5 Jy beam-1 in the field center. Full details of the radio observations, their reduction and cataloging are given in Owen et al. (2002) and Smail et al. (2002b). The radio source surface density down to a 5- limit of 17.5Jy is 4 arcmin-2 (Smail et al. 2002b). Adopting a nominal error radius of 3′′ for the SCUBA sources (Smail et al. 2002a), this translates into only a 3% chance of an unrelated radio source falling within the SCUBA error circle. Searching within this radius around the position of SMM J09429+4659 we identify a bright, unresolved (0.15′′) 970 Jy radio source: H8 [09 42 53.42 +46 59 54.5], 2.5′′ from the submm position. For SMM J09431+4700 we identify two radio counterparts; one has a 1.4-GHz flux density of 72 Jy (H6: 09 43 04.08 +47 00 16.2) and is 1.2′′ from the submm position, the other has 55 Jy (H7: 09 43 03.70 +47 00 15.1) and is 2.8′′ away. The low surface density of radio sources suggests that H6 and H7 are both related to the submm emission. Both of these sources are slightly resolved in our VLA map, with sizes of 0.7–0.9′′.
We next exploit deep imaging of this field to identify the radio source counterparts of the submm galaxies in the optical and near-infrared. These images reach typical 3- depths of in the optical and in the near-infrared and their reduction and calibration are described by Kodama et al. (2001) and Smail et al. (2002b). We astrometrically align the near-infrared images to the radio frame with a precision of 0.32′′ rms using the positions of 90 sources detected in the two wavebands. This allows us to pinpoint near-infrared counterparts to the many faint radio sources in our VLA map.
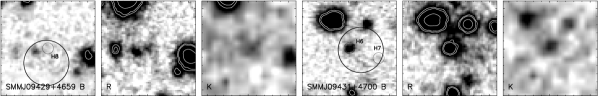
All three of the radio counterparts to the SCUBA galaxies are identified in our optical or near-infrared data: H6 has and , H7 is undetected in but is coincident with a , galaxy, and H8 has and is extremely red . We show the optical/near-infrared images of these galaxies in Fig. 1. Unfortunately, neither galaxy lies in the sparse HST mosaic of this field discussed by Dressler et al. (in prep) and only H6 is detected at sufficient signal-to-noise in our good-seeing optical images to reliably measure its intrinsic FWHM: .
The spectroscopy of these galaxies was attempted with the GMOS spectrograph (Davies et al. 1997) on Gemini-North. The target of this survey was faint radio galaxies, which are likely to lie at –4 (Owen et al. 2002), and so we aimed for the widest possible wavelength coverage and the highest resolution to maximise the chance of detecting weak emission and absorption features in these optically-faint galaxies. To accomplish this we observed each mask twice, once with the B600 grating (centered at 4730Å) and then with the R400 grating (centered at 7920Å) to provide continuous spectral coverage from 3500Å to 1m. The detectors were read out in 3-amp mode with binning (along both the spatial and dispersion axes). The resulting pixel scale is 0.145′′ pixel-1 with dispersions of 0.91Å pixel-1 (B600) and 1.37Å pixel-1 (R400). Slitlets of 1 were placed on each target, giving a resolution of 3–4Å.
A multislit mask was designed for the center field in A 851 which includes both submm sources. A total of 2.5 hrs integration was obtained with each of the B600 and R400 gratings on the nights of March 14 and 15, 2002 in 0.7–0.8′′ seeing. These observations were reduced and calibrated in a standard manner using iraf scripts. We used a CuAr lamp spectrum for wavelength calibration, and removed any remaining offsets using bright sky lines. The spectra were flux calibrated with observations of Feige 34 (B600) and HZ 44 (R400) observed through a 1′′ long-slit. Both H6 and H8 were targeted in the same mask. H7’s proximity to H6 precluded placing slitlets on both sources. From the observation of the source H8 (), we are unable to identify either any features or detect the continuum. However, we do identify a series of strong emission lines in the spectrum of H6 shown in Fig. 2.
Finally, we have retrieved the XMM/Newton X-ray image of this field from the public archive777This work is based on observations obtained with the XMM-Newton, an ESA science mission with instruments and contributions directly funded by ESA member states and the USA (NASA). to place limits on the hard X-ray emission from the submm sources. This image provides 49.4-ks of useful integration from the EPIC MOS1 and MOS2 cameras and allows us to place 3- limits of ergs s-1 and ergs s-1 on the unabsorbed 2–10 keV fluxes of SMM J09429+4659 and SMM J09431+4700. Adopting a photon index of 1.7, these limits translate into 3- lower bounds on the submm-X-ray spectral indices (Fabian et al. 2000) of and respectively.

3. Analysis and Results
We identify several strong emission lines in the combined GMOS spectrum of H6 shown in Fig. 2, including Ly, Nv and Civ. Based on the wavelength of the narrow Ly line we estimate a redshift of , consistent with the observed wavelengths of the other broader emission features. This is currently the highest spectroscopic redshift for the counterpart of a SCUBA galaxy – breaking the barrier for this population for the first time. While this is only a modest increase in lookback time, compared to the previously most-distant source at , it corresponds to a decrease of a factor of two in the predicted abundance of the massive halos, M⊙, believed to host these luminous galaxies (Jenkins et al. 2001). The exponential decline in the space density of the most massive halos at higher redshifts underlines the strong constraints available from identifying the highest redshift submm galaxies.
The 850m flux of SMM J09431+4700 of 8.8 mJy (corrected for lensing) translates into L L⊙, assuming T K.888If both H6 and H7 contribute to the submm emission then from their joint radio flux we would estimate a somewhat higher dust temperature, T K, and a far-infrared luminosity of L L⊙. This makes this galaxy a Hyperluminous Infrared system (HyLIRG, Rowan-Robinson 2000). If purely powered by massive star formation, its immense luminosity would require a star formation rate of M⊙ yr-1!
However, the spectrum of H6 shows the signatures of a weak AGN. The strongest lines include a narrow and symmetrical Ly line with a flux of ergs s-1 cm-2 and a FWZI of 55Å. There are also broader emission lines coincident with the expected wavelength of redshifted Nv 1239.7, with an observed FWZI of Å, and an integrated flux of ergs s-1 cm-2, and Civ 1549, with a FWZI of Å and a flux of ergs s-1 cm-2. We also identify a number of weaker emission lines and mark these in Fig. 2. The velocity widths of these lines cover a wide range, from a restframe FWHM of 210 km s-1 for Ly upto 550 km s-1 for the higher excitation lines. In addition the morphologies of the Nv and Civ lines appear very similar (Fig. 2). The spectral properties, line widths and line ratios of this galaxy are very similar to those seen for narrow line Seyfert-1’s (NLSy1, Osterbrock & Pogge 1985; Crenshaw et al. 1991), in particular Mrk 24. This classification is supported by the ratio Heii1640/Civ=0.05, indicative of a NLSy1 or NLQSO (Heckman et al. 1995). These galaxies have narrow forbidden and permitted emission lines, FWHM –700 km s-1, which are thought to result from an increase in the size and density of the broad line region compared to a normal Seyfert-1 (Laor et al. 1997).
Based on our deep imaging we measure 3′′-diameter photometry of H6 giving: , , , , , , , . The color is relatively red, , suggesting the presence of either strong absorption in the -band or strong emission in the -band. We note that at the Lyman-limit falls just blueward of the -band (indeed emission is seen down to 890Å in the restframe, rising as ), however, several strong lines fall in the -band (Fig. 2). Integrating all the flux in the -band part of the GMOS spectrum we measure a slit magnitude of , in reasonable agreement with the 3′′-diameter aperture magnitude and from this we estimate that 50% of the -band light is contributed by Ly and Nv, a similar calculation for Civ suggests that it contributes 35% of the -band flux. Using the apparent -band magnitude of this galaxy we estimate an absolute -band magnitude of at , although a significant fraction of this light may be contributed by emission lines, including H and [Oiii] 4959,5007.
We also investigate the spatial extent of the emission lines along our slit – focusing on Ly and Nv as these lines lie close in wavelength. We find that Ly is spatially extended compared to Nv with a FWHM of 0.95′′ versus 0.74′′. As the estimated image quality in the -band was 0.7′′ at the beginning of the observations, the Nv width is consistent with being spatially unresolved. For Ly we measure an intrinsic FWHM of – indicating extended Ly emission on a scale of 8 kpc.
Turning to the radio properties of this galaxy, the radio luminosity of H6 is W Hz-1 for an spectral slope or W Hz-1 for (including a 20% correction for lensing). These luminosities correspond locally to those expected for a FR I radio galaxy, although it is equally consistent with strong radio emission from a massive starburst at the level detected in the submm waveband. The radio-submm spectral index, , is based on the radio emission from H6 (if H7 contributes as well then ). These correspond to a redshift of using the models from Carilli & Yun (2000), in reasonable agreement with our spectroscopic measurement.999For the ERO/mJy-radio counterpart to SMM J09429+4659, H8, we estimate , corresponding to only . It is clear that the radio emission must include a significant contribution from an AGN and the estimated redshift is only a lower limit – assuming the galaxy follows the – relationship for powerful radio galaxies it most likely lies at , Jarvis et al. (2001).
The XMM-Newton observations suggest that unless highly obscured, the intrinsic luminosity of the AGN in H6 must be modest, 2–10 keV ergs s-1. However, the limit on the submm-X-ray spectral index of H6, , is also consistent with a heavily obscured AGN such as NGC 6240 (Keel 1990), with N(Hi) , at (Fabian et al. 2000).
4. Discussion and Conclusions
The spectroscopic identification of a second HyLIRG in the SCUBA population provides the opportunity for a detailed comparison of the properties of these two galaxies: SMM J023990136 and SMM J09431+4700. Detailed study of SMM J023990136 has shown that it is a massive, gas-rich system (Ivison et al. 1998; Frayer et al. 1998), identified with a pair of galaxies: L1 and L2, at , and has a far-infrared luminosity of L L⊙. L1 hosts a partially obscured AGN, which has recently been classified as a Broad Absorption Line (BAL) QSO (Vernet & Cimatti 2001). The second component L2 is separated from L1 by about 10 kpc in projection (compared to 50 kpc for H6–H7), and may be tidal debris rather than an independent galaxy.
Apart from their apparent binary morphologies, the most striking similarity between these two HyLIRGs is that both systems host AGN. As highlighted by Ivison et al. (2000): 80% of the SCUBA galaxies with known redshifts show some signs of an AGN. The close relationship of AGN and QSO activity to the growth of supermassive black holes (SMBH) and the apparent ubiquity of SMBH in local, massive spheroids suggests that this is a natural consequence if SCUBA galaxies are the progenitors of the most massive galaxies in the local Universe (e.g. Sanders et al. 1988; Silk & Rees 1998; Granato et al. 2001; Archibald et al. 2001). One measure of the importance of the AGN in these systems is to quantify its contribution to their total emission. X-ray observations of the two HyLIRG submm galaxies suggests that in neither does the AGN dominate the bolometric emission (Bautz et al. 2000), which instead comes from an intense starburst which also produces the substantial masses of dust in these galaxies.
Although they do not dominate the energetics, the AGN may still have a profound effect on the evolution of these galaxies: the AGN in SMM J023990136 is driving a substantial wind which may in time sweep the central regions of the galaxy clear of gas and dust. Can we find any signs of similar AGN-induced feedback in SMM J09431+4700? There are several hints: the contrast between the narrow, spatially-extended Ly emission and the broader, but spatially-unresolved high excitation lines, may indicate that the former arises from emission in an outflow. This situation is very similar to that seen in some high-redshift radio galaxies, such as 53W002 at (Windhorst, Keel & Pascarelle 1998). Moreover, the structured broad emission lines seen in H6 are reminiscent of the structures seen in broad emission lines of some radio galaxies and radio-loud quasars (Eracleous & Halpern 1994), although those show much larger velocity ranges. These structured emission lines are interpreted as resulting from scattering of radiation from the AGN by outflowing conical winds (Corbett et al. 1998) and the same mechanism may be operating in SMM J09431+4700/H6. The final connection is from the spectral classification of this galaxy as a NLSy1, where analysis of examples at have led to the identification of strong nuclear winds and a suggested link to BALQSOs (Lawrence et al. 1997; Leighly et al. 1997; Laor et al. 1997).
If both systems do show signatures of massive outflows – this suggests that winds powered by the AGN (as well as starbursts) must be central to our understanding the growth of the spheroidal components in these massive, young galaxies (Granato et al. 2002). The feedback on the system from energy injected by the AGN provides one possible mechanism for creating the observed SMBH to bulge mass correlation seen in local galaxies (Maggorian et al. 1998). The future evolution of these submm sources will be determined by the ability of the AGN to clear the bulk of the gas and dust from the nuclear regions – if they can, then they may evolve into the population of less-obscured QSOs.
With regard to the wider environment of H6, we note a striking coincidence: H6 is just 400 km s-1 and less than 1 Mpc () from an optically-selected galaxy, DG 433 (), (Trager et al. 1997), suggesting that the two galaxies inhabit a single structure. DG 433 has a UV spectrum dominated by absorption lines and an estimated star formation rate of M⊙ yr-1, indicating it is a much less active system than the hyperluminous galaxy H6. The relationship between the highly obscured and very active submm-luminous galaxies and the less obscured populations which cluster in the same environments will be one of the most important questions to address in the next few years.
References
- (1) Archibald, E. N., et al. 2001, ApJ, submitted
- (2) Bautz, M. W., et al. 2000, ApJ, 543, L119
- (3) Bertoldi, F., et al. 2000, A&A, 360, 92
- (4) Carilli, C. L., Yun, M. S. 2000, ApJ, 530, 618
- (5) Corbett, E. A., et al. 1998, MNRAS, 296, 721
- (6) Cowie, L. L., Barger, A., Kneib, J.-P., 2002, AJ, 123, 2197
- (7) Crenshaw, D. M., et al. 1991, AJ, 101, 1202
- (8) Davies, R. L., et al., 1997, SPIE, 2871, 1099
- (9) Eracleous, M., Halpern, J. P., 1994, ApJS, 90, 1
- (10) Fabian, A. C., et al. 2000, MNRAS, 315, L8
- (11) Frayer, D. T., et al. 1998, ApJ, 506, L7
- (12) Frayer, D. T., et al. 1999, ApJ, 514, L13
- (13) Granato, G. L., Silva, L., De Zotti, G., Danese, L., 2002, in ”Galaxy Evolution: Theory and Observations” , eds. Avila-Reese, V., Firmani, C., Frenk, C., Allen, C., RevMexAA SC.
- (14) Granato, G. L., et al. 2001, MNRAS, 324, 757
- (15) Heckman, T., et al. 1995, ApJ, 452, 549
- (16) Hughes, D. H., et al. 1998, Nature, 394, 241
- (17) Ivison, R. J., Smail, I., Le Borgne, J.-F., Blain, A. W., Kneib, J.-P., Bézecourt, J., Kerr, T. H., Davies, J. K. 1998, MNRAS, 298, 583
- (18) Ivison, R. J., Smail, I., Barger, A., Kneib, J.-P., Blain, A. W., Owen, F. N., Kerr, T. H., Cowie, L. L. 2000, MNRAS, 315, 209
- (19) Jarvis, M., et al. 2001, MNRAS, 326, 1563
- (20) Jenkins, A., et al. 2001, MNRAS, 321, 372
- (21) Keel, W. C., 1990, AJ, 100, 356
- (22) Kodama, T., et al. 2001, ApJ, 562, L9
- (23) Laor, A., et al. 1997, ApJ, 489, 656
- (24) Lawrence, A., et al. 1997, MNRAS, 285, 879
- (25) Leighly, K. M., et al. 1997, ApJ, 489, L25
- (26) Magorrian, J., et al. 1998, AJ, 115, 2285
- (27) Osterbrock, D. E., Pogge, R. W., 1985, ApJ, 297, 166
- (28) Owen, F. N., et al. 2002, in prep
- (29) Rowan-Robinson, M. 2000, MNRAS, 316, 885
- (30) Sanders, D. B. , et al. 1988, ApJ, 328, L35
- (31) Scott, S. E., et al. 2002, MNRAS, 331, 817
- (32) Silk, J., Rees, M. 1998, A&A, 331, L1
- (33) Smail, I., Ivison, R. J., Blain, A. W. 1997, ApJ, 490, L5
- (34) Smail, I., Ivison, R.J., Kneib, J.-P., Cowie, L.L., Blain, A.W., Barger, A.J., Owen, F.N., Morrison, G. 1999. MNRAS, 308, 1061
- (35) Smail, I., Ivison, R. J., Blain, A. W., Kneib, J.-P. 2002a, MNRAS, 331, 495
- (36) Smail, I., Owen, F. N., Morrison, G. E., Keel, W. C., Ivison, R. J., Ledlow, M. C., 2002b, ApJ, submitted
- (37) Trager, S. C., Faber, S. M., Dressler, A., Oemler, A., 1997, ApJ, 485, 92
- (38) Vernet, J., Cimatti, A., 2001, A&A, 380, 409
- (39) Webb, T., et al. 2002, ApJ, submitted
- (40) Windhorst, R. A., Keel, W. C., Pascarelle, S. M., 1998, ApJ, 494, L27