The Diversity of Extremely Red Objects
Abstract
We present the results from a sensitive multi-wavelength analysis of the properties of Extremely Red Objects (EROs). Our analysis employs deep photometry of a region to select a sample of 68 EROs with and brighter than (). We combine this photometric dataset with an extremely deep 1.4-GHz radio map of the field obtained from the VLA. This map reaches a 1- limiting flux density of 3.5Jy making it the deepest 1.4-GHz map taken and is sensitive enough to detect an active galaxy with W Hz-1 at . If powered by a starburst, this radio luminosity is equivalent to a star-formation rate of M⊙ yr-1 for stars more massive than 5 M⊙. We identify radio counterparts to 21 of the EROs in this field with radio fluxes above 12.6Jy and resolve a third of these with our 1.6′′ FWHM beam. The spectral energy distributions of the majority of these galaxies are consistent with those expected for dust-reddened starbursts at . At these redshifts the radio luminosities of these galaxies indicate a median far-infrared luminosity of this population of , meaning half of the radio-detected sample are ultraluminous infrared galaxies (ULIRGs). We conclude that % of the ERO population brighter than are luminous infrared galaxies (LIRGs) at . We also use photometric classification of the colors of the EROs to investigate the mix of dusty active and evolved passive systems in the remaining ERO population which is undetected in our radio map. Based on this we suggest that at least 30% and possibly up to % of all EROs with and are dusty, star-forming systems at . Our best estimate of the star formation density in this highly-obscured and optically faint () population is –100 M M⊙ yr-1 Mpc-3, comparable to estimates of that in H emitting galaxies at , and greater than the estimates from UV-selected samples at these epochs. This lends support to the claims of a strong increase in the contribution from obscured systems to the star formation density at high redshifts. Using the observed counts of the radio-detected ERO population we model the apparent break in the -band number counts of the whole ERO population at –20 and propose that the passive ERO class dominates the total population in a relatively narrow magnitude range around , with dusty, active EROs making up the bulk of the population at fainter limits.
Subject headings:
cosmology: observations — galaxies: evolution — galaxies: starburst — infrared: galaxies galaxies: clusters: individual (Abell 851, Cl 0939+4713)1. Introduction
The last five years have seen a growing appreciation of the diversity of galaxy properties at –3. In part this has arisen from an impressive improvement in the quality of the observations of galaxies at these redshifts – driven by the availability of powerful new instruments on 8-m class telescopes (e.g. NIRSPEC on Keck and ISAAC on the VLT). However, an equal role has been played by the realization of the necessity of a multi-wavelength approach to studies of galaxy evolution at . Thus a range of new surveys spanning wavebands from the X-ray, near- and mid-infrared, submillimeter and out to the radio, have complimented the traditional view of distant galaxies based on UV/optical observations. These new studies have all tended to stress the role of dust obscuration in censoring our view of the galaxy population at high redshifts, and especially in disguising the extent of activity in the most luminous systems, both AGN and star-forming. Indeed, our current, incomplete, knowledge of the evolution of dusty galaxies suggests that some of the most active galaxies in the distant Universe may be so obscured as to be undetectable in even the most sensitive UV/optical observations (e.g. Haarsma et al. 2000; Smail et al. 2002).
One central theme to appear from this new multi-wavelength view of galaxy formation is the ubiquity of optically-faint, but bright near-infrared, counterparts to sources identified in many wavebands: in the X-ray (Alexander et al. 2001, 2002; Cowie et al. 2001; Page et al. 2002; Stevens et al. 2002; Mainieri et al. 2002), the mid-infrared (Pierre et al. 2001; Smith et al. 2001; Franceschini et al. 2002), submillimeter (Smail et al. 1999a; Lutz et al. 2001; Ivison et al. 2002) and radio bands (Richards et al. 1999; Chapman et al. 2001). This has resulted in a renaissance in interest in such Extremely Red Objects (EROs) – a class of galaxies which had previously been viewed as a curiosity with little relevance to our understanding of galaxy formation and evolution, comprising as they do a mere –10% of the population at .
The ERO class is photometrically-defined – the most frequently used definition is now . This very red optical-near-infrared color is intended to isolate two broad populations of galaxies at : those which are red by virtue of the presence of large amounts of dust (resulting from active star formation), as well as passive systems whose red colors arise from the dominance of old, evolved stars in their stellar populations. The very different natures of these two sub-classes has prompted efforts to disentangle their relative contributions to the ERO population (Pozzetti & Mannucci 2000; Mannucci et al. 2002) so that well-defined samples can be used to test galaxy formation models (Daddi et al. 2000; Smith et al. 2002a; Firth et al. 2002).
Studies of the ERO population have turned up hints of the diverse nature of this population, including an apparent break in the number counts of EROs at –20 (McCarthy et al. 2001; Smith et al. 2002a). This feature is roughly 2 mags fainter than the well known break in the total -band counts of the faint field population (Gardner et al. 1993). The cumulative count slope of EROs () drops from at bright magnitudes to for the fainter EROs (e.g. Smith et al. 2002a; Chen et al. 2002; Fig. 2). This break in the counts could either result from a relatively narrow redshift range probed by the selection criteria of EROs – with the change in the integrated counts then being simply related to the form of the luminosity function of the ERO population, or it may reflect differing evolutionary behavior in sub-populations – where one class of EROs declines rapidly beyond . To test this suggestion we need to track the relative mix of galaxy types within the ERO population to –20.
Techniques to separate the passive, evolved and obscured, active populations include near-infrared photometric classifications (Pozzetti & Mannucci 2000; Smith et al. 2002a; Mannucci et al. 2002), submillimeter emission (Dey et al. 1999; Mohan et al. 2002), X-ray emission (Alexander et al. 2001, 2002; Brusa et al. 2002) and optical/near-infrared spectroscopy (Cimatti et al. 2002; Smith et al. 2001, 2002b). Of these approaches, by far the largest and most influential project is the “K20” survey undertaken by Cimatti et al. (2002) who obtained spectroscopic classifications for 29 EROs with and from a full sample of 45. The median redshift of their sample is , with galaxies spread across –1.4 (see Daddi et al. 2001) and they find that their sample is split equally into passive, evolved and active, dusty EROs: 31–64% versus 67–33%, where the ranges reflect the uncertainty due to the incompleteness in their survey. The K20 survey has significantly increased our knowledge of the ERO population, however, it is reliant on identifying emission lines in the restframe UV spectra of possibly dusty galaxies, which results in an incomplete and perhaps biased view of the mix of galaxies within the population. Moreover, the magnitude limit achieved for the high completeness sample, , means that it can’t be used to track the variation in the properties of the population across the break in the counts of EROs.
Here we apply a new technique to investigate the mix of the ERO population at faint magnitudes: using very deep radio observations at 1.4 GHz which are both sensitive enough to identify strongly star forming galaxies out to high redshifts, –2, and yet insensitive to the effects of dust obscuration (Mohan et al. 2002; Chapman et al. 2002a). Radio surveys to sub-mJy flux limits have shown the usefulness of this technique for identifying star-forming galaxies in the distant Universe – morphological classifications from Hubble Space Telescope (HST) imaging show many are blue disk galaxies (Windhorst et al. 1994; Richards et al. 1998; Richards 2000), with optical spectroscopy confirming that these are apparently normal star forming galaxies at intermediate redshifts (Benn et al. 1993; Mobasher et al. 1999; Roche, Lowenthal & Koo 2002), with a small proportion of AGN (20% based on their radio morphologies in very high-resolution maps from combined VLA and Merlin observations, Muxlow et al. 1999, with most of these having blue colors). However, the spectral properties of the galaxies in these surveys also show signatures of the presence of dust, which may be cloaking the strength of the activity in these systems and making them appear more mundane than they should (Hammer et al. 1995; Poggianti & Wu 2000; Smail et al. 1999b).
More recently, samples of faint radio sources have begun to be used to attempt to identify obscured star-forming galaxies at even higher redshifts. By focusing on those radio sources with faint or undetectable counterparts in the optical these surveys attempt to isolate the most distant star forming galaxies in the radio samples (Richards et al. 1999; Barger et al. 2000; Chapman et al. 2001, 2002b). Sensitive submillimeter observations of these optically-faint radio sources confirm that a large fraction of them are luminous, dusty systems at redshifts of –3 – although, as with the whole submillimeter galaxy population, there is still considerable uncertainty over their exact redshifts (Chapman et al. 2002b). The relationship between these highly obscured, but very luminous galaxies and the perhaps less-obscured systems selected through Lyman- emission and the Lyman-break technique is a crucial issue for a complete understanding of the formation and evolution of galaxies (Smail et al. 2002, 2003). The project described here seeks to trace the population of the luminous, dusty galaxies detected in the submillimeter at to lower redshifts and lower luminosities. These samples should be more amenable to detailed study and so provide a clearer connection between the evolution of the obscured and unobscured galaxies over the lifetime of the Universe (Chapman et al. 2002b).
In this paper we use an extremely deep VLA radio map to investigate the radio emission from a sample of ERO galaxies at a sensitivity limit sufficient to detect strongly star forming galaxies at –2. We also present extensive optical/near-infrared imaging of this ERO sample. We exploit this deep photometry to analyse the spectral energy distributions (SEDs) of the EROs and investigate their properties in detail. We present our observations, their reduction and cataloging in the next section, describe our analysis and results in §3, and discuss these in §4 before giving our conclusions in §5. Throughout we assume a cosmological model with and km s-1 Mpc-1. If we instead adopted the currently fashionable km s-1 Mpc-1, , cosmology, then for a source at all the linear sizes we derive would be 6% smaller, the luminosities would be 12% fainter and the volume densities would be 12% lower.
2. Observations, Reduction and Cataloging
The field used for our analysis contains the cluster A 851 (Cl 0939+4713). This well-studied cluster is relatively rich, but very irregular in appearance (Dressler et al. 1994, 1997, 2002; Iye et al. 2001; Schindler et al. 1998). As we discuss below, although cluster members may contribute significantly to the optically-bright radio population in this field, the extremely red radio sources discussed in this work all probably lie at and hence are unassociated with the foreground cluster.
The other influence which the cluster may have is as a gravitational lens. However, A 851 is not a particularly concentrated cluster (Seitz et al. 1996; Trager et al. 1997; Iye et al. 2000) and the wide field coverage of our sample, compared with the cluster’s critical radius (only two of the EROs in our sample lie within 1′ of the cluster center, roughly corresponding to 2– the critical radius), suggests that lensing by the cluster will have a minimal effect on the surface density in our sample (% integrated over the whole area of our survey) and is unlikely to grossly effect the morphologies of any of the EROs in our study.
2.1. Radio Observations
The radio image of A 851 comprises a combination of A, B, C, and D configuration observations from the National Radio Astronomy Observatory’s VLA999NRAO is operated by Associated Universities Inc., under a cooperative agreement with the National Science Foundation. taken at 1.4 GHz between 1996 and 2000. For each observation, “4” mode was used for the correlator with MHz spectral channels for each of two IFs and two polarizations. This mode was employed to allow a map to be made of the entire primary beam at the highest spatial resolution possible with the VLA ( FWHM) and with the best compromise between radial smearing of the image due to the finite bandwidth and sensitivity. However, as is noted below, some penalty does result from this choice. The total integration time of the combined dataset is hours on source.
The dataset was imaged using the aips program imagr. The 74 facets were used including 37 within the primary beam and 37 outside the primary beam, each of the latter centered on a bright confusing source. Each of the datasets from the four configurations were self-calibrated using intermediate images as input to the aips program calib. A more complete description of the reduction process is included in Owen et al. (2002).
The analysis presented here focuses on the central facet from the full map, a field in the center of the primary beam: 09 42 48.614 +46 59 59.72 (J2000). The final map reaches a 1- noise level of 3.5 Jy beam-1 in the central part of this field – making this the deepest 1.4-GHz map ever made. However, in the extreme corners of the area being analyzed the actual peak flux density is reduced by about due to the primary beam attenuation and radial bandwidth smearing caused by the finite bandwidth of each spectral channel. We therefore adopt a conservative 3- limit of 12.6 Jy in the corrected peak flux density over the entire area being studied. We can probe down to 3- significance limit and still retain a very low level of false detections as we are searching for radio emission at the known positions of a relatively small number of EROs, compared to the number of independent beams in our map (). The synthesized beam of our final map is circular and has a FWHM of , this allows us to resolve radio sources with sizes and we discuss the sizes of radio emission from the EROs in our survey in the following sections.
1

2.2. Near-infrared Observations
Our primary near-infrared imaging dataset comes from wide-field images in taken with the KPNO 2.1-m telescope, these cover a field of view to . These images have relatively coarse sampling and so we have also obtained higher resolution and images covering a smaller, , field of view from the 4.2-m William Herschel Telescope (WHT)101010The WHT is operated by the Isaac Newton Group on behalf of Particle Physics & Astronomy Research Council (PPARC). and the 3.8-m UK Infrared Telescope (UKIRT)111111UKIRT is operated by the Joint Astronomy Centre on behalf of PPARC. respectively. The WHT and UKIRT observations cover the bulk of the region included in the analysis here and they thus provide a useful confirmation of the identifications and photometry of EROs in this field. Standard reduction procedures were applied to all datasets and they were calibrated using UKIRT Faint Standards (Hawarden et al. 2001).
2.2.1 KPNO 2.1 m -band mosaics
The SQIID camera was used at the KPNO 2.1-m telescope on the nights of 2001 January 4–11 to image the field simultaneously in . The pixel scale of the camera is arcsec and the useful field of view of is , with nine pointings mosaiced together to cover a region of . The total exposure time was 75 ks, spread equally over the nine pointings to give a per-pixel exposure time of 8.3 ks.
The images were reduced in a standard manner using iraf scripts. Flat fields were constructed from the dithered exposures at each pointing to produce a flat field centered in time on each exposure. Distortion corrections were measured from a comparison of bright objects in the near-infrared images with existing, deep -band images and these were applied to align the images in the three passbands to a common coordinate grid, at a level of 0.1 pixel rms or better.
These observations were obtained in a mix of photometric and non-photometric conditions, with seeing of 1.5–1.8′′ FWHM. To calibrate the photometry in the three bands we exploit the precise photometry of this field published by Stanford, Eisenhardt & Dickinson (1995). By comparing the photometry for a large number of bright galaxies in the field we estimate a typical zero-point error of mags on our photometric scale. The total magnitude corresponding to the 5- detection limit for a point source is . While the 3- limits for 3′′ aperture photometry in the - and -bands are and .
2.2.2 UKIRT -band mosaic
On the nights of 1999 February 28, March 01–02 and March 15–16 we completed a -band mosaic of pointings using the UFTI imager on UKIRT (pixel scale 0.0908′′ pixel-1). This mosaic covers the central 7.5 region of the cluster defined by the WFPC2 field (see §2.3) and hence covers around 55% of the radio sample analysed here. Each pointing has a total integration time of 2.4 ks and reaches a limit of for point sources. The median seeing for these observations was 0.5′′ and several of the mosaic tiles have 0.35′′ seeing, while periods of sub-0.25′′ seeing were experienced. These frames allow us to confirm the reality of EROs in the field and investigate the morphologies of the brighter examples.
2.2.3 WHT -band mosaic
On 2000 December 11–12 we used the INGRID near-infrared imager (Packham et al. 2002) on the WHT to obtain a -band image of the cluster core. This comprised a mosaic of 2.4-ks exposures and covers the same region as the UKIRT mosaic, reaching for a point-source in 0.70′′ seeing with 0.242′′ sampling.
2.3. Optical Observations
The optical imaging to complement our deep near-infrared datasets was obtained from three facilities. We have two wide-field imaging datasets of this region: the first comes from Suprime-Cam on Subaru (courtesy of Dr T. Kodama), and consists of very deep imaging of a field centered on the cluster core. We also have obtained similarly wide-field KPNO 4-m image in the -band to bridge the spectral coverage of our optical and near-infrared datasets. Finally, an HST/WFPC2 mosaic of A 851 has been observed in the F702W filter, this covers a 7.5 region around the cluster core, within the area studied here, and provides very detailed morphological information on the optically-bright galaxies in this area (Dressler et al. 2002; Morrison et al. 2002). However, the relatively shallow surface brightness limit of the HST imaging, mag arcsec-2, means that these data are not useful for gauging the morphologies of all but the most compact of the 15 radio-detected and 27 radio-undetected EROs in this region (see also Dey et al. 1999; Smith et al. 2002a). For this reason we will not use the HST imaging in our analysis.
2.3.1 Subaru imaging
Kodama et al. (2001) obtained deep, imaging of A 851 using Suprime-Cam on the 8.3-m Subaru Telescope on the nights of 2001 January 21–22. Suprime-Cam has a field of view, imaged with eight 4k2k CCDs at a scale of 0.20′′ pixel-1. The conditions were photometric during the observations, with seeing of 1.0′′ and 0.7′′ in and respectively. Total exposure times of 4.0 ks and 1.3 ks were obtained resulting in 3- limiting magnitudes for point sources in 3′′ diameter apertures of and . The reduction and calibration of these data is described by Kodama et al. (2001).
2.3.2 KPNO 4 m imaging
The -band imaging of A 851 was obtained on the night of 2001 January 25–26 with the MOSAIC camera on the KPNO 4-m. These data cover a 36 field with 0.258′′ pixel-1 sampling. The processed image combined five individual exposures, shifted so the combination eliminated areas lost to gaps between individual CCD chips. After applying chip-by-chip sky flats, each exposure was projected onto an astrometric pixel grid and coadded with appropriate masking for gaps and bad pixels. The data were taken in photometric conditions and the final 7.2 ks exposure has seeing of 1.0′′ FWHM and a 3- limiting magnitude of in our standard 3′′ diameter aperture.
2.4. Photometric Catalog
To catalog near-infrared sources in the field of A 851 we ran SExtractor (Bertin & Arnouts 1996) on the -band image of the field – first convolving the image with a -diameter top-hat kernel and then searching for sources with areas greater than the seeing-disk above an isophote defined as mag. arcsec-2.
As our measure of the total magnitudes of the sources in the image we adopt the scaled aperture magnitude, best_mag, calculated by SExtractor. This magnitude is measured within an aperture which is the first-moment radius of the source, except in crowded environments when it is replaced with a corrected, isophotal magnitude, see Bertin & Arnouts (1996) for details. The 5- detection limit for point-sources in our catalog corresponds to a total magnitude of and we detect 1186 sources in the area spanned by our current VLA catalog (Fig. 1). This point-source detection limit should be representative of the completeness of our catalog for those compact galaxies with half-light radii less than our -diameter detection filter (this includes the majority of the faint, near-infrared field population, Chen et al. 2002). However, our catalog selection will tend to miss galaxies with very extended disks even though their integrated magnitudes are above this point-source limit and this may introduce a morphological bias into our sample selection (Martini 2001; Chen et al. 2002; Firth et al. 2002; Snigula et al. 2002). However, this is not a significant problem for our analysis as the primary goal is to determine the proportion of dusty and evolved EROs in published surveys and the relatively good agreement between our measured ERO surface density and values published by other workers (see Fig. 2) suggests that our catalog suffers no stronger bias than is typical for such surveys.
To measure colors for galaxies in our imaging we use fixed, -diameter aperture photometry from seeing-matched frames. The optical and near-infrared images were aligned to the coordinate system defined by the KPNO -band image with a typical tolerance of . The seeing on these frames was then matched to that of the poorest-resolution images (the -band) by Gaussian convolution.
3. Analysis and Results
Our analysis begins by constructing a SExtractor-based -selected catalog of EROs in the field. We then align the radio and optical/near-infrared images to an rms accuracy of using the 90 brightest radio and -band sources in the joint field. This allows us to search for matches for the EROs within the radio map. We note that our radio observations identify all three cataloged submm galaxies in this field (Smail et al. 1999a, 2002; Cowie et al. 2002) and we discuss these further in Ledlow et al. (2002).
3.1. The ERO samples
For this analysis we start from our -selected galaxy catalog and identify galaxies brighter than () which have 3-′′ diameter aperture colors redder than the limit of which we adopt as the definition of an ERO (see Pozzetti & Mannucci 2000). Based on this we identify 68 EROs in our field – equivalent to a surface density of arcmin-2 at (the error-bar simply reflects Poisson statistics and we have applied an incompleteness correction of 20% to the number density of EROs in the faintest bin, as well as a 6% correction to the area of the survey to account for the sky area covered by bright stars and galaxies).
The catalog of EROs in our field is given in Table 1. This lists the ERO ID (a 5-digit ID denotes a radio source), the J2000 position of the ERO (tied to the VLA reference frame with an rms precision of 0.32′′), the total -band magnitude (measured using the SExtractor best_mag), aperture color (or 3- limit), 1.4-GHz radio flux (or 3- limit), 3-′′ diameter aperture magnitudes from our seeing-matched imaging, best-fitting SED (either dusty, “D”; evolved, “E”; or badly-fit, “B”, see §3.5) and a visual morphology (from our high resolution - and -band imaging if available, see §3.4) on a simple system: “C”, compact/regular; “I”, disky, disturbed or amorphous; “F”, too faint to classify.

As is shown in Fig. 2, the surface density of EROs we detect is in reasonable agreement with that observed in other ERO surveys (e.g. Thompson et al. 1999; Daddi et al. 2000; Smith et al. 2002a) given the strong field-to-field variation seen in the surface density of EROs (Daddi et al. 2001; McCarthy et al. 2001; Roche et al. 2002; Chapman, McCarthy & Persson 2000). This supports our claim that the foreground cluster makes no contribution to this population, either from members or by gravitational lensing. For ease of comparison with ERO samples selected in other filter combinations, in particular , we note that while our field contains 68 EROs with , we have 99 objects with suggesting that this is a less stringent definition of an unusually red source. We also note that 63 (93%) of our EROs have (including all of the radio-detected EROs from §3.2).
We re-identify three previously cataloged EROs brighter than in our field, including the submm ERO SMM J09429+4658 from Smail et al. (1999a), which is also a faint radio source, and two other radio-undetected EROs – the edge-on disk galaxy #333 from the NICMOS study of Smail et al. (1999b) and Cl 0939+4713 A from Persson et al. (1993). A fourth cataloged ERO in this field – the passive ERO Cl 0939+4713 B from Soifer et al. (1999) – has based on our photometry and hence does not make it into our ERO sample.
We can also use our UKIRT and WHT near-infrared imaging to test the reliability of our ERO sample. There are 30 EROs from the KPNO sample which fall within the UKIRT -band and WHT -band mosaics (11 of these are radio-detected). We identify 27 (90%) of these on the UKIRT mosaic. Two of the missing EROs are low-surface brightness, extended systems which are below the detection limit of the UKIRT mosaic when using a large diameter photometric aperture. This highlights the surface brightness, and hence morphological, biases which could affect the mix of morphological classes identified in ERO surveys (Chen et al. 2002). In this regard the good sensitivity, but relatively coarse, resolution of our KPNO -band imaging acts in our favor by concentrating a large fraction of the light from the galaxy in a relatively small number of pixels ( fewer than in the UKIRT image).
The third “ERO” missing from the UKIRT mosaic is the source #2549 cataloged in the KPNO 2.1-m imaging (Table 1). This source is clearly detected in the simultaneously obtained imaging from 2001 January 4–11 as a bright unresolved source ( FWHM) with unusual colors , : indicating that the SED peaks in the -band (Fig. 7). Yet it was apparently fainter than during February 1999 (UKIRT) and in December 2000 (WHT). In addition, we can state the counterpart to this source was also fainter than our 3- limits of and on 2001 January 21 and on 2001 January 25. The strongest constraint on the variability of the source comes from our -band observations which would indicate that the source brightened by 3.5 magnitudes in a 1 month period. While our subsequent optical images suggest it was either extremely red, or it had faded by magnitudes within 3 weeks of the 2.1-m run. There are two possible explanations for the properties of this source: it is either moving (e.g. an asteroid or comet) or highly variable (e.g. a supernova, gamma-ray burst or active galactic nucleus). We can easily discount at least one of the variability options – if the source was a supernova then it should still be visible in our optical imaging taken 3 weeks after the 2.1-m run. Equally, by subdividing our 2.1-m imaging into temporally independent sections and comparing the position of the object between these, we find no measurable movement of the source, , or strong variability over a 6 hr timespan. If the object was moving at the maximum rate allowed by this limit then it should be still visible within our -band frame taken weeks later. Its absence therefore rules it out as a solar-system object. We conclude that #2549 is most likely a highly variable source, although unlike the highly-variable AGN found by Gal-Yam et al. (2002) there is no optical or infrared host galaxy underlying #2549. We also note that #2549 lies 30′′ from the variable X-ray source in this field cataloged by Schindler et al. (1998) and so is unlikely to be the same object.
Based on these comparisons we conclude that our photometrically-selected ERO sample is reliable.
3.2. The Radio-detected EROs
We now search for radio counterparts to the EROs in our field. We adopt a maximum matching radius of 2′′ (3 pixels on the near-infrared images) and search for radio emission above the 3- limit of 12.6Jy centered on the -band centroid of each ERO. Of the 68 photometrically-selected EROs, 21 are detected in our deep VLA observations – giving a surface density of arcmin-2 for EROs with radio fluxes above 12.6 Jy and brighter than . The median -band magnitude of these 21 EROs is (Table 2), almost identical to the median brightness of the radio-undetected EROs: . The brightest ERO in the radio has a flux of only Jy, we can therefore limit the proportion of radio luminous AGN in the general ERO population to % (c.f. Willott et al. 2001).
The radio-detected EROs comprise % of the whole ERO population down to (see also Yan 2001; Mohan et al. 2002), where the error-bar is based on Poisson statistics and hence probably underestimates the field to field variance in this fraction. Taking the expected blank-field radio counts sources down to 12.6 Jy (, Richards 1999) the ERO counterparts with represent % of the total radio population.
We plot the cumulative number density of the radio-detected EROs in Fig. 2. We find, at most, marginal evidence for a difference in the count slope between the whole ERO population (and given our small sample also no strong evidence for a break in the count slope with magnitude) and the radio-detected and undetected samples: parameterizing the counts as we estimate for the whole catalog, with and for the radio-detected and undetected samples.
The radio flux distribution of the radio-detected EROs is characterized by a strong rise at faint fluxes – the cumulative counts being well-fit by a power-law. Hence the number of EROs detected at 1.4 GHz rapidly increases at fainter flux limits: doubling as the flux limit is reduced from Jy (typical of previous surveys, e.g. Richards et al. 1998) to the 12.6-Jy limit of the current work. At a flux level of around 50 Jy the ERO counts appears to increase more rapidly (perhaps indicating the appearance of a new population of very red and very faint radio sources), but then flattens out at faint fluxes. We believe that this flattening is probably a result of the depth of our available -band imaging which is restricting the identification of the faintest and typically reddest sources (see Fig. 3). We see fairly constant -band to radio flux ratios as a function of radio flux (see Fig. 3), this is in contrast to the strong decrease in this ratio with increasing radio flux above 1 mJy (Waddington et al. 2000), suggesting a different physical process (star formation, rather than AGN activity) may be responsible for the faint emission from the sources in our catalog.
The distribution of EROs in Fig. 3 shows that these galaxies have typically lower near-infrared to radio flux ratios than average radio source in the field (many of which are cluster members, Morrison et al. 2002). The similarity of the K-corrections in these two wavebands over the redshift range we cover (see §3.5) suggests that this is an intrinsic feature of these galaxies. Assuming that the local far-infrared to radio correlation holds for these galaxies, then we conclude that the radio-detected EROs have far-infrared/optical ratios of –200 (see §4.2). Locally such high ratios are usually only seen in the advanced stages of mergers of massive galaxies (e.g. Mirabel & Sanders 1989). In comparison, using the median -band magnitude for the radio-undetected EROs we obtain a limit of , equivalent to (for an star-forming galaxy at the equivalent FIR luminosity would translate into a limit on the SFR of M⊙ stars of M⊙ yr-1).

Finally, we searched the archival 49.4-ks XMM-Newton/EPIC X-ray image of this field to identify any ERO which may be associated with a luminous X-ray sources (Alexander et al. 2002; Stevens et al. 2002; Page et al. 2002). We find no such X-ray bright EROs within our 72.7 sq. arcmin search region and place typical 3- limits on the unabsorbed X-ray emission from individual sources of ergs s-1 cm-2 in the 2–10 KeV band.
3.3. ERO companions
To search for differences in the local environment of the radio-detected and undetected ERO populations we look at the typical nearest-neighbor distance in our photometrically-selected catalog (Georgakakis et al. 1999; Gallimore & Keel 1993). We note that the modest spatial resolution of the KPNO -band images means this test is relatively insensitive to the presence of close companions, –2′′ seperation. We find that the median nearest-neighbor distance is 10.91.6′′ for radio-detected ERO, compared to 15.20.8′′ for those EROs which are not detected in our radio map. A Kolmogorov-Smirnov test shows only a 10% chance that the two nearest-neighbor distributions are drawn from the same parent population. This suggests a higher frequency of neighbors for those EROs detected in our radio map, with seperations roughly corresponding to kpc at . However, these seperations are probably too large for the companion to be responsible for dynamically triggering the activity in the radio source. To investigate the sub-10-kpc scales, where the signatures of on-going mergers and strong dynamical interactions will be visible, we need to look at the detailed morphologies of the EROs (§3.4).
To further test the association of these neighboring galaxies with the EROs we analyse their colors. We find that the radio-detected sample has a median nearest-neighbor color of , while the closest galaxy to the radio-undetected EROs have – in both cases the nearest neighbors have a median magnitude of . Both of these colors are marginally redder than the average for a magnitude-matched subsample from the field: , suggestion that the nearest neighbors to the EROs may lie at a higher mean redshift, are more evolved or more obscured than the typical field galaxy. Both samples also have comparable fractions of EROs as nearest neighbors – 14% of the radio undetected sample have a nearest neighbor which is also an ERO (with ) compared to 12% for the radio-detected EROs. Given that EROs make up only 6% of the whole -band sample in this field it is clear that the EROs as a population must be clustered (Daddi et al. 2001; McCarthy et al. 2001; Chapman, McCarthy & Persson 2000).
3.4. ERO morphologies
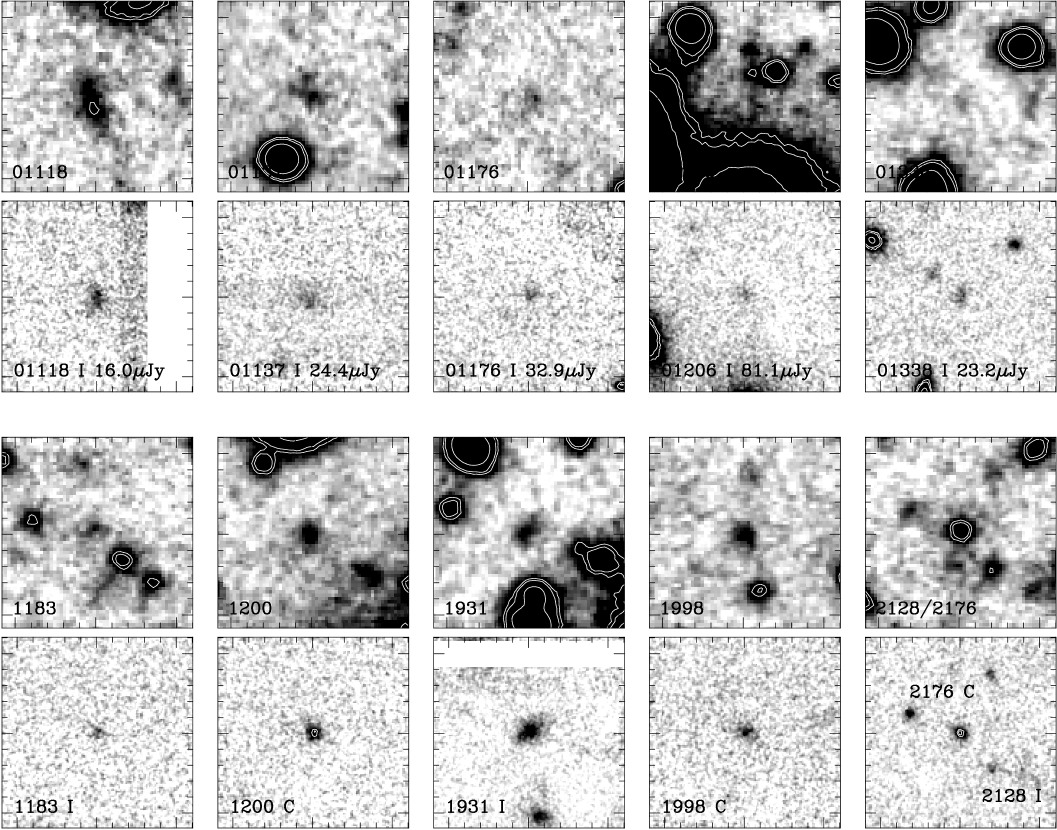
We can also exploit our high-resolution UKIRT -band and Subaru -band imaging to quantify the morphological mix within the two samples of EROs (Fig. 4). The UKIRT imaging provides restframe optical morphologies for 19 of the radio-undetected EROs (including the transient source #2549, §3.1, and the star #2418, §3.5) and 11 radio-detected EROs. The properties of these subsamples are consistent with the full samples (Table 2) with median -band magnitudes and colors of , and , respectively. In contrast the Subaru -band image covers the full ERO sample at slightly lower resolution, but only gives us a restframe UV view of the morphologies of these galaxies – which is very sensitive to the presence of both dust and unobscured star formation.
We visually classify the EROs in both passbands using a simple scheme designed to crudely distinguish between regular, centrally-concentrated galaxies, whose extreme colors may arise from a old stellar population, and more morphologically complex, disturbed or asymmetric galaxies, where their very red colors could indicate the presence of dust obscuration. Following Smith et al. (2002a) we define three broad classes: compact/relaxed systems (“C”); obvious disks, asymmetric or disturbed/amorphous morphologies (“I”) or too faint to reliably classify (“F”), see Table 1. Based on the near-infrared classifications we estimate that the morphologies of the radio undetected ERO sample are: 5 compact, 5 disks or disturbed/amorphous and 7 which are too faint to classify (29%:29%:42%), excluding #2549 and #2418. For the radio-detected sample the equivalent numbers are: 0, 9 and 2 respectively (0%:82%:18%). In both cases the uncertainties in the numbers in each class are probably 1–2 objects. We confirm that these two distributions are inconsistent with being drawn from the same parent population at the level.
The morphological mix of the whole sample is: 18%:50%:32%, identical to that measured for a lensed sample by Smith et al. (2002a). We find a similar distribution when we use the restframe UV classifications from our -band images: with the mix for the full sample being 11%:52%:37%, and the radio-detected EROs having a slightly higher incidence of disturbed/amorphous morphologies and a lower incidence of compact images than the radio-undetected subsample. Thus our sample appears to exhibit a lower fraction of compact, regular EROs compared to that presented by Moriondo et al. (2000), where 80% of their EROs were classified as compact/elliptical-like from an analysis of a somewhat brighter (median ) archival HST sample. This difference could either reflect a mismatch in the classification schemes; a tendency for the archival HST fields to target high-density regions, which may contain a higher fraction of bulge-dominated EROs; or a real change in the morphological mix of the ERO population with apparent magnitude (see §4.2).
Turning to the internal differences within the subsamples of EROs in our survey, although the samples are small and the classifications are necessarily crude and somewhat uncertain, it appears that the radio-detected EROs show a higher incidence of disky and disturbed/amorphous morphologies compared to the radio-undetected sample, which in contrast has a higher fraction of compact sources (no examples of which are seen in the radio-detected sample). We illustrate a few examples of the various class of ERO morphologies in Fig. 4. We also briefly note the median colors of the different morphological classes (both radio-detected and undetected): compact, ; disky/amorphous, ; faint, . Thus there is a hint that the compact population is bluer than the extended (disky, disturbed and amorphous) subsample, in agreement with the findings of Mannucci et al. (2002), but the large scatter in the colors of these subsamples suggests that they do not represent homogeneous populations.
Finally, we note that the radio emission from 7 of the radio-detected EROs, 33% of the sample, is resolved in our map on scales of 0.8–3.4′′. The median intrinsic size of these sources is , corresponding to kpc at in our adopted cosmology. The remaining 14 radio-detected EROs are unresolved with a typical limit on the size of their radio emission of ( kpc at ). For the 7 resolved EROs we can crudely compare their morphologies in the radio and optical passbands by determining the median offset in the position angles of the emission in these two bands. We find that the radio and -band emission have very similar scale sizes and that there is a median offset of only degrees between the position angles of the major axes in the two bands. This suggests that there is a close relationship between the extended radio and optical emission in these galaxies and we return to this point in §4.
3.5. ERO Colors
We begin our investigation of the colors of the EROs in this field by using the most basic diagnostic diagram proposed for this population: the – plane. Pozzetti & Mannucci (2000) proposed that evolved and dusty EROs could be separated using this plane – with the passive, evolved EROs typically showing bluer colors (see also Smith et al. 2002a; Mannucci et al. 2002). We therefore plot the distribution of all the well-detected EROs (see below for the definition of well-detected) on this plane in Fig. 5. Focusing on the relative distribution of the radio-detected and undetected EROs we see that the radio-detected EROs tend to fall red-ward, or close to, the division proposed by Pozzetti & Mannucci (2000). In contrast, the radio-undetected EROs show a much broader distribution, with roughly equal numbers of galaxies either side of the division (see also Mannucci et al. 2002). Figure 5 also allows us to classify #2418 as a probable star (this is confirmed by the form of its SED in Fig. 6).
To investigate the photometric properties of the ERO populations in more detail we now exploit our multiband photometry. We begin by simply constructing average colors for each sample. The median colors of the radio-detected and radio-undetected ERO samples are given in Table 2 (where the errors are the uncertainty on the median from bootstrap resampling). We find that the radio-undetected EROs are typically bluer than the radio-detected sample in colors long-ward of m – consistent with the color distribution of the two samples in Fig. 5. We also find that the radio ERO population may be slightly more homogeneous than either the whole ERO catalog or the radio-undetected sample. For example, the radio-undetected sample exhibits a broader spread of colors with a typical dispersion of around the median color (Table 2), compared to for the radio-detected sample (this is also illustrated by the broader range of SEDs for the radio-undetected sample in Fig. 6). The varied mix of colors for the radio-undetected EROs is not surprising as we expect that this sample probably contains both passive evolved galaxies and dusty active systems whose radio flux is below the sensitivity limit of our VLA map. The presence of passive, evolved galaxies in this sample is further supported by the more abrupt change in the colors of this sample at m, corresponding to the 4000Å break at . However, the relatively modest differences between the median colors of the radio detected and undetected samples also suggests that the radio-undetected ERO sample contains a reasonable fraction of galaxies with dusty SEDs (or that the relative redshift distributions of the two samples conspire so that the observed colors are more similar than they are in the restframe).
| Sample | Dispersion | Note | |||||||
|---|---|---|---|---|---|---|---|---|---|
| Radio detected | |||||||||
| All | 21 | ||||||||
| Radio undetected | |||||||||
| All | 45 | Excluding #2418 & #2549 | |||||||
| Dusty SED | 9 | ||||||||
| Evolved SED | 11 | ||||||||
| Badly fit | 8 | Excluding #2418 & #2549 | |||||||
| Radio detected & undetected | |||||||||
| Not fit | 20 | … | |||||||
3.5.1 Photometric classification of EROs
To further investigate the photometric classifications of individual ERO we have undertaken a simple test to determine whether the colors of a particular ERO are better described by a relatively feature-less, dust-dominated SED or a spectrum with a strong break. The simplest way to apply this test is to employ the hyperz photometric redshift code (Bolzonella et al. 2000) to compare the ERO colors to two different families of SEDs: dusty, young starbursts (or AGN) and almost dust-free evolved systems. For the dusty AGN we assume that their optical and near-infrared colors are dominated by a co-eval starburst (which produces the dust) – although the AGN may contribute significantly to the radio emission from the system. By relying on just two simple classes of SED we will clearly fail to describe any systems with more complex mixes of evolved stars and obscured and unobscured young stars (a situation which may be common place in many of these systems at high-, e.g. the edge-on bulge-strong disk galaxy ERO #1931, Fig. 4 and Table 1). However, by concentrating on those EROs which are well-fitted by these simple models we can determine the relative proportion of EROs at the extremes of these classes.
For this test we employ a single star formation model described by an exponential declining star formation rate with a e-folding time () of 1 Gyr, a Miller-Scalo IMF and solar metallicity. This model can provide an adequate description of the colors of luminous elliptical galaxies at the present-day (Bolzonella et al. 2000) and hence is a reasonable choice given the expectation that both the passive and star-forming ERO populations may represent the precursors of the elliptical galaxies seen in the local Universe. As a test of the sensitivity of our classifications to the details of the star formation model we have also used an instantaneous burst and a Gyr model in place of the Gyr model and find that the proportions of EROs in the different classes varies by less than 10%.
In our model the initial formation redshift, the dust reddening and the redshift of the ERO are all free parameters subject to the following constraints. For the starburst/AGNs the reddening, based on a Calzetti et al. (2000) dust model, can vary in the range –6, consistent with the range of reddening estimated for their spectroscopically-identified star forming EROs by Cimatti et al. (2002). In contrast for the passive models it is required to be – hence by restricting the range of possible reddening we isolate the two families of solutions which are capable of fitting the very red colors of the EROs: either unobscured but old stellar populations or highly obscured, actively star forming systems. In both cases the redshift of the ERO is allowed to vary between –3, a large enough range to comfortably encompass all of the EROs in Cimatti et al. (2002). The upper limit on the redshift removes the possibility of fitting infeasibly high redshifts due to the 4000Å break being confused with the Lyman break, although we note that at least one ERO in our sample has a proposed redshift of (#01206, Smail et al. 2002).
To obtain useful constraints from our analysis, we first require that the ERO is detected in at least 3 passbands at more than 3-, this reduces the samples to 17 radio-detected EROs and 30 radio undetected EROs. We list at the bottom of Table 2 the median -band magnitude and colors of those EROs which were removed from our analysis by this signal-to-noise ratio (SNR) cut. As expected these are fainter on average, , than the typical ERO in our sample, which has . This magnitude difference is equivalent to that expected for a change in the median distance modulus of the population of . As many of these EROs are undetected in a particular passband we have improved the signal-to-noise of their colors by calculating these from the median fluxes in the various passbands, including cases where the calculated flux is negative (Table 2). We find that these colors are consistent with those for the full samples, with the largest discrepancy being the color which differs by . We conclude that the EROs removed by our SNR cut are at most slightly redder than the sample we retain, and the main reason for their lower SNR is that they are simply fainter on average.
We fit the photometry (including limits) of the high-SNR radio-detected and radio-undetected samples to both families of model SEDs allowing for systematic errors on the calibrations of the different passbands. We then compare the relative of the best-fit models in both cases and classify the EROs on this basis into either evolved, “E”, dusty, “D”, or badly-fit, “B” (see Table 2). We plot the SEDs of the sources used in the analysis in Fig. 6. Encouragingly this test identifies #2418 and #2549 as pathological SEDs which are not well fit by either galaxy model () and we remove these from our sample, reducing it to 28 sources (Table 2).
Restricting our comparison to those EROs which are reasonably well-fit by either SED, (90% confidence limit) we find that 12 from the 17 EROs in the high-SNR, radio-detected sample are well-fitted, 11 of these by the dusty SED (65%). This supports the suggestion that the bulk of this population represent dusty, active galaxies and gives us good confidence that this model SED can be reliably used to identify dusty systems in the high-SNR, radio-undetected sample. We find only one radio-detected ERO which is better fit by an evolved SED, this is #11077, a relatively faint radio source with an irregular ERO counterpart. Examining the SED of this source we see that it is unique amongst the radio-detected EROs in having a blue color, which cannot be well-fitted by a dusty SED (Fig. 6). Comparing the morphology of the ERO in the - and -bands we find that the galaxy comprises two regions – a blue area to the east of the radio source and a very red area to the west – this complex morphology suggests that the simple model we use to fit may not be applicable to this galaxy.
The five high-SNR, radio-detected EROs which are not well-fit by the dusty SED (#01045, #01105, #01137, #11018 and #12861) are ill-fit by either family of model SEDs (–11). This could result from systematic errors in our photometry for these galaxies (although we have checked that their colors do not appear to be strongly effected by nearby galaxies), or because their SEDs are not well-matched to the two simple alternatives used in our analysis: e.g. composite systems with evolved stellar populations and AGN contributions, galaxies with complex dust geometries, or very high- starbursts which are also not included in our model (e.g. Waddington et al. 1999). We will discuss the properties of these sources in the context of a fuller photometric analysis of the complete radio population in this field in Owen et al. (2002).
Turning to the radio-undetected EROs we find that 20 of the 28 sources (79%) are reasonably described by one or other of the two families of model SEDs. Of these, 11 (39%) are better fit with a passive, evolved SED, compared to 9 (32%) which are well-fitted by a dusty SED. The median -band magnitudes of the two classes are for the evolved subsample and for the dusty sources, if we include with the latter the 11 well-fit dusty, radio-detected EROs () we obtain a median magnitude of for all of the EROs whose colors are well-fit by a dusty SED. Thus there is a slight tendency for the EROs with dusty SEDs to be fainter than those with evolved SEDs. The 8 radio undetected EROs which are not well-fit with either family of model SEDs (ignoring #2418 and #2549) are surprisingly bright on average . To test whether this results from an error in the relative calibration of our photometry we increase the estimate of the systematic errors in the relative calibration of the photometry from to 0.2 and confirm that this does not significantly effect the average magnitude of the badly-fitting SEDs, although it does reduce their number from 8 to 4 – with the EROs making up the difference being equally classed as dusty and evolved systems. We also confirm that photometry of these badly-fit EROs is not unduly affected by crowding.


The median colors of the various subsamples of radio-undetected EROs are given in Table 2. The dispersion of the colors of the individual EROs in each subsample around their median are also listed there, these show that the dispersion within the subsamples of radio undetected EROs classed as dusty or evolved is less than that seen for the whole sample. This confirms that as expected the photometric classifications isolate more homogeneous subsamples from the overall radio-undetected ERO population, with the exception of the badly-fit subsample whose larger dispersion suggests that it still contains a mix of SED types.
3.5.2 The mix of dusty and evolved EROs
The strong preference for fitting the colors of high-SNR radio-detected EROs with the dusty SED model, 11/12 well-fit examples, gives us confidence that this model can be reliably employed to identify similarly dusty, active systems in the radio-undetected ERO sample and hence estimate the prevalence of such galaxies in the full ERO population.
Taking the estimate that at least 20% (9/45) of the radio-undetected EROs have dusty SEDs and including the 11 high-SNR, radio-detected EROs with similar photometric classifications, we conclude that at least % (20/45) of those EROs with well-sampled SEDs have colors compatible with dusty starbursts, or % (20/66) of all EROs with and (median ). This is consistent with the estimate of the proportion of dusty starbursts at (median ) of 33–67% from Cimatti et al. (2002).
There are two different assumptions which can now be made to broaden this constraint: one addresses the failure rate for fitting dusty EROs with our model SED, the other with the number of dusty systems in the low-SNR ERO sample. Firstly, we could assume that the proportion of dusty SEDs in the high-SNR radio-detected sample is the same as that measured for those EROs with well-fitted SEDs, 92% (11/12), i.e. that the majority of the radio-detected EROs have dusty SEDs. Based on this we can then estimate the failure rate for fitting the colors of a dusty ERO with our model template as 5/16. Adopting the same failure rate for the dusty galaxies in the high-SNR radio-undetected sample, which have similar quality photometry, means that half of the badly-fit EROs are actually dusty galaxies (we would get the same estimate if we had simply proportioned the badly-fit ERO sample on the basis of the relative numbers of the successful fits). Hence we would estimate that at least 46% (13/28) of the high-SNR radio-undetected EROs have dusty SEDs. Adding in the radio-detected EROs then leads to a lower limit of % on the proportion of dusty starbursts in the full ERO sample. Secondly, we could assume, based on the overall similarity of their median colors, that the high-SNR EROs are representative of the full samples. If this assumption is adopted then we would again conclude that a minimum of % of the EROs in our full sample have colors which are well-fit by a dust-reddened starburst.
Hence, either of these assumptions would suggest that a minimum of about a half of the and ERO population have colors consistent with those expected for dusty starbursts. As these two assumptions are independent, we can also combine them by applying the mis-classification correction to the radio-detected and undetected samples (giving 16/17 and 13/28) and then assuming that the relative proportions of EROs of the photometric types in the high-SNR samples apply independently to the full samples (yielding 20/21 and 21/45). In this way we estimate that perhaps % of the full ERO sample are distant, dusty starburst/AGNs, with the remainder being passive systems (although these may also include a small number of very high-redshift galaxies, e.g. Waddington et al. 1999). This estimate of the proportion of evolved and dusty EROs in the population is of course also sensitive to the strong clustering of the passive ERO population.
Our photometric classification also provides some other information about the EROs: in particular the best-fit redshift and reddening. However, the limited precision of our photometry and the strong degeneracies between these parameters means that they should be viewed with caution. For the high-SNR, radio-detected EROs, which are well-fit by the dusty SED, the median redshift is , with a quartile range of –1.5. This range is very similar to that seen in the spectroscopic survey of Cimatti et al. (2002) and gives us some confidence in the average properties we determine for this population. The median reddening for this sample is . For the radio-undetected EROs, those galaxies which are fitted with a dusty SED give a similar median redshift of and a slightly lower reddening of . These estimated reddenings are consistent with that estimated for their composite spectrum of star-forming EROs by Cimatti et al. (2002), . For both subsamples the median -band luminosities at the estimated redshifts corresponds to , or when corrected for reddening. The unobscured luminosities of these galaxies would be comparable to galaxies today, however, their young stellar populations would be expected to fade substantially and so it is clear that these galaxies are likely to evolve into sub- galaxies at the present-day, unless the current starburst continues for yrs.
Next, we look at the relationship between our crude restframe visual morphologies and the preferred photometric classification for 28 EROs (8 radio-detected and 20 radio-undetected, Table 1). The morphological mix in both cases is similar to the proportions of the different SED types, if we interpret the compact EROs as passive, evolved systems (Mannucci et al. 2002). For the radio-undetected sample we find a broad equality between the classes: 29%:29%:42% for compact:disky/amorphous:faint, similar to 39%:32%:29% for the evolved, dusty and badly-fit SEDs. Similarly, for the radio-detected sample, which is dominated by dusty SEDs, the morphological mix is: 0%:82%:18% compared to the distribution of SED fits: 6%:65%:29%. However, a one-to-one comparison for individual EROs shows that while the distributions appear to be telling the same story, the individual galaxies are much more mixed: half of those EROs with dusty SEDs have disky, amorphous or disturbed morphologies, but none of the EROs with passive SEDs have compact morphologies (this morphological class is almost evenly split between dusty SEDs and failed fits). We also note that there is no clear trend in the SEDs of those radio-detected EROs which are resolved in our VLA map.
To summarize, we place a firm lower limit of % on the proportion of dusty starbursts in the full and ERO population. Adopting two separate corrections for the number of dusty EROs which are missed either due to the failure of our photometric classification or because they were removed due to their poor photometry, we propose that –50% is a more realistic lower limit on the fraction of dusty EROs. Finally, by combining these corrections we suggest that the actual fraction of EROs with dusty starburst/AGN-like colors is probably close to %.
4. Discussion
4.1. The evolution of dusty and evolved EROs
We have estimated the relative proportion of dusty, active and passive, evolved systems in the ERO population. By comparing this to the mix of classes estimated for the sample by Cimatti et al. (2002) we can identify any decline in either class of EROs which might be responsible for the apparent break in the ERO counts at –20 (McCarthy et al. 2001; Smith et al. 2002a). The similarity of the two estimates suggests that there is no evidence for a significant shift in the mix of these two sub-populations across –20, although it should be noted that the Cimatti et al. sample is selected using a slightly bluer color criteria, , which complicates this comparison. This apparent lack of a substantial shift in the nature of the ERO population may indicate that the break arises instead from the volume sampled – with EROs populating a relative narrow redshift range. This volume would be bounded at the low redshift end by the requirement that the galaxy is observed at high enough redshift, i.e. sufficiently far into the restframe UV, to enable a dust-reddened starburst or evolved stellar population to appear extremely red, (Daddi et al. 2001; Firth et al. 2002). Observationally this appears to require –1 (§3.5; Cimatti et al. 2002). At the upper-end the redshift limit may be imposed either by the luminosity function, passive bluing of the stellar population, or the increasing fraction of unobscured star formation in both sub-classes of ERO (the continuity between high- SCUBA galaxies and the radio-selected ERO population suggested below would argue against the latter suggestion). If the break in the counts is due to the surveys reaching beyond the volume containing the ERO population then the break (Fig. 2) should roughly correspond to for a composite luminosity function with a Schechter form. This would imply that the characteristic luminosity of the ERO population is very similar to that seen in the local field, , and that the ERO luminosity function has a faint end slope, , which is shallower than (the slope of the differential counts beyond the break). To illustrate this we plot a toy model in Fig. 2, this has a mix of Gaussian luminosity functions each with mean luminosity of ( at , Cole et al. 2001) and a dispersion of (similar to the width of the luminosity function of elliptical galaxies locally). These are combined to produce a redshift distribution with a mean redshift of and a dispersion of (Cimatti et al. 2002; Firth et al. 2001), and the cumulative counts calculated using a simple K-correction. Clearly this toy model (with some further tuning) can reasonably reproduce the ERO counts, indicating that a combination of a narrow luminosity function and a narrow redshift range are a sufficient, if not unique, explanation of the form of the counts of the whole ERO population across –21.
However, such a model has two obvious shortcomings – firstly, it requires that the evolutionary behavior of the dusty and passive ERO populations is similar, which seems highly unlikely, and secondly the required evolution means that the dusty, active EROs selected in our radio map are distinct from the higher redshift and fainter counterparts to the SCUBA galaxies, rather than representing a simple continuity of the population to lower redshifts and brighter -band fluxes. For these reasons we reject this model and construct a second toy model.
For the second model we assume that the number counts of dusty EROs are well-described by the power-law slope estimated for the radio detected population in §3.1, but with a normalization increased to reproduce the % fraction of the ERO population which we estimate have dusty SEDs. To this we add a Gaussian population representing the passive sub-population and normalize the combined sample to reproduce the weighted cumulative surface density of EROs at from Thompson et al. (1999) and Smith et al. (2002a). Representative parameters for the passive sub-population require a mean magnitude of ( at assuming no evolution, or assuming passive evolution from ) and a FWHM of 1.2 mag. We illustrate the cumulative counts of both sub-populations and the combined population in Fig. 2. We note that this model predicts that the relative proportions of dusty and evolved EROs for a sample is 35%:65%, in agreement with the current limits from Cimatti et al. (2002). Clearly this model, even without elaborate tuning, can provide an adequate description of the current data, while at the same time providing continuity between the dusty EROs detected in our VLA map and the higher redshift and fainter counterparts to submm sources (Smail et al. 2002; Ivison et al. 2002) and we therefore prefer it. A clear distinction between the alternative models will come from extending the counts of EROs fainter, to –23, and estimating the relative mix of evolved and dusty systems at these depths. However, the depth of the imaging required for such a survey, and , will make it observationally demanding.
4.2. Star-formation in the dusty ERO population
The resolution of over a third of the radio-detected EROs in our VLA map, along with the close correlation between the radio and optical morphologies of these EROs, suggests a common mechanism for the emission at these two wavelengths. The simplest explanation is that the emission in both bands is powered by massive star formation within an extended region – on a scale of kpc. Thus for at least a third of the radio-detected EROs, star formation is likely to contribute the majority of the radio emission (this includes one of the brightest radio EROs, #01053). Furthermore, we note that using the median 1.4-GHz surface brightnesses of these resolved EROs and the star formation calibration discussed below, they are expected to have high star formation surface densities: M⊙ yr-1 kpc-2, more than sufficient to drive powerful winds.
4.2.1 The fraction of AGN-dominated EROs
To reliably quantify the star formation occurring in the complete radio-detected ERO sample we must estimate the contamination from AGN-dominated systems. The AGN fraction in the whole Jy radio population can be determined from the spectroscopic and morphological surveys of Jy radio sources (e.g. Muxlow et al. 1999; Roche, Lowenthal & Koo 2002). These suggest that at most 20% of radio sources at Jy are likely to be AGN. However, these estimates are typically based on samples of radio sources with brighter optical counterparts than the ERO sample analysed here (and the AGN tend to be the bluer sources in even these samples, Roche, Lowenthal & Koo 2002; Waddington et al. 2000). Nevertheless, non-thermal emission is seen in a handful of well-studied EROs (Pierre et al. 2001; Willott et al. 2001; Smith et al. 2001; Cowie et al. 2001) indicating that AGN are not completely absent from the ERO population, but the fraction of these in complete photometrically selected ERO samples is not well determined (Cimatti et al. 2002). The most useful constraint on this fraction for our purpose is that estimated from the number of ERO counterparts to faint X-ray sources (Alexander et al. 2001, 2002; Brusa et al. 2002; Mainieri et al. 2002). While we earlier confirmed that none of the EROs in our sample is associated with a luminous X-ray source, using archival XMM-Newton observations, much more stringent limits are now available on X-ray counterparts to EROs from recent Chandra and XMM-Newton observations of blank fields (which have lower backgrounds than our cluster field).
Alexander et al. (2002) identify six and X-ray sources in a 70.3 sq. arcmin region within the 1-Ms Chandra Deep Field North exposure, giving a surface density of arcmin-2. Based on the relative numbers of and sources and the number counts of EROs we would expect roughly arcmin-2 X-ray-detected EROs with and . This estimate assumes that the X-ray-detected fraction is not a strong function of color or -magnitude, although we note that 2/6 sources in the Alexander et al. (2002) sample have and hence are borderline cases. Compared to our ERO surface density of arcmin-2 this indicates that around % of the ERO population are detected in very deep X-ray observations.
However, the Chandra exposure used by Alexander et al. (2002) is sufficiently sensitive that it will detect not only obscured AGN sources, ergs s-1, but also powerful star forming galaxies at (Ranalli et al. 2002). If we instead restrict the X-ray sample to those EROs which are too X-ray luminous to be ULIRG-like starbursts at , i.e. 0.1–2.4 KeV ergs s-1 (twice the X-ray luminosity of the local X-ray-bright starburst NGC 3256, which has , Moran et al. 1999), then the number of probable AGN-dominated sources in the Alexander et al. (2002) sample would drop to three (two of which have borderline, , colors), or an estimated surface density of arcmin-2 using our ERO criteria. We conclude that at most 3% of the ERO population with and are likely to host energetically dominant AGN. This is consistent with the estimates from ERO counterparts to hard X-ray sources detected by XMM-Newton in Franceschini et al. (2002), as well as the recent estimate that 1–2% of the ERO population have hard X-ray counterparts by Brusa et al. (2002) and Mainieri et al. (2002).
While the occurrence of AGN-dominated sources in the ERO population is obviously low, the estimates derived above do not tell us how frequently radio-selected EROs are detected in the X-ray waveband. Fortunately, we can also crudely estimate this from the Alexander et al. (2002) survey. Three of the X-ray-detected sources with in Alexander et al. (2002) are also detected in deep 1.4-GHz observations, two of these have X-ray and radio emission consistent with an X-ray bright starburst at , suggesting a surface density of arcmin-2 for X-ray-detected AGNs with Jy ERO hosts, corresponding to % of the whole radio-detected ERO population. This rate of AGN contamination is consistent with our identification of only one radio-detected ERO with an evolved SED (assuming the radio emission from this galaxy arises from a weak AGN, see §3.5), corresponding to 6% of the sample. We therefore adopt 6% as the AGN contamination in our sample and conservatively assume that the radio emission from any EROs hosting an AGN is dominated by the AGN.
4.2.2 The star formation density in EROs
We can now use our ERO sample to estimate the star formation density in the most obscured starbursts at (Cram et al. 1998; Oliver et al. 1998; Haarsma et al. 2000). We calculate two estimates of the star formation density – first we take the minimum number of galaxies in our sample which are likely to be dusty, active systems based on the analysis of their optical-near-infrared SEDs: this subsample comprises 11 high-SNR, radio-detected EROs and 9 radio non-detections, and provides a conservative lower bound on the estimated star formation density.
Those radio-undetected EROs with dusty SEDs are likely to either be more distant or have typically lower star formation rates (and hence radio fluxes) than the radio-detected examples. Based on the analysis in §3.5.2 there is a hint that these galaxies have similar redshifts to the radio-detected EROs, but lower reddening’s – and hence perhaps lower star formation rates (Hopkins et al. 2001). Using their estimated surface density and extrapolating the cumulative number counts of radio-detected EROs in our field from §3.2, we would expect most of the dusty, radio-undetected EROs to have radio fluxes above Jy and hence we assume that the typical dusty, radio-undetected ERO has a radio flux of Jy.
For the second estimate we adopt the incompleteness estimates for the photometric classification from §3.5 and hence use 20 radio detections and 21 radio-undetected EROs. Simply summing the 1.4-GHz fluxes for these two subsamples we obtain a total radio flux of Jy for the conservative case and 1370 Jy for the more realistic estimate (these include contributions from the radio-undetected starbursts of 90 Jy and 210 Jy respectively). Applying our estimated AGN contamination reduces both of these estimates by 6%, however, if this contamination preferentially effects the most luminous, unresolved radio EROs then the radio fluxes could be reduced by as much as % (roughly half the difference between our “conservative” and “realistic” cases).

Hence we estimate cumulative restframe 1.4-GHz luminosities from star formation in the two subsamples of W Hz and W Hz respectively. These assume a K-correction based on a spectrum typical of star forming galaxies (Richards 1998), which gives a correction of , where the error is dominated by the redshift range of the galaxies. We now use the local correlation between 1.4-GHz luminosity and far-infrared luminosity (Condon et al. 1991) to convert this estimate into a cumulative far-infrared luminosity for the sample, we note that the validity of this correlation has recently been confirmed at the redshifts studied here by Garrett (2002). In this way we obtain cumulative far-infrared luminosities of: and respectively. We estimate that these correspond to SFRs for M⊙ of M⊙ yr-1 and M⊙ yr-1 using the conversion in Condon (1992). If we instead adopt the new calibration of Yun, Reddy & Condon (2001), we would estimate star formation rates roughly half of the quoted values (see also Carilli et al. 2002). However, for comparison with previous work we retain the Condon (1992) calibration. Assuming a Salpeter IMF from 0.1–100 M⊙ these rates are higher.
To calculate the volume probed by our ERO sample we use the photometric redshift estimates for the 20 radio-detected and undetected EROs which are classed as dusty starbursts and find a quartile range of –1.5 (in reasonable agreement with the spectroscopically determined redshift range from Cimatti et al. 2002, –1.4, see Daddi et al. 2002), which gives a corresponding volume of Mpc3 at a median redshift of . The quoted uncertainty corresponds to changing either of the bounds on the volume by and encompases the estimate we would derive if we had instead adopted the redshift range for EROs from Daddi et al. (2002).
Combining this volume with the star formation rates we estimate equivalent star formation densities of 0.1–100 M M⊙ yr-1 Mpc-3 and M⊙ yr-1 Mpc-3 (if the AGN contamination is predominantly in the most luminous, unresolved radio sources the latter estimate will fall to M⊙ yr-1 Mpc-3). We compare these measurements to other estimates of the star formation density in Fig. 7.
Our measurement of the star formation density in the radio-detected ERO population at is comparable to estimates of that in H-selected galaxies at these epochs (Yan et al. 1999), and greater than that seen in optically-selected galaxies (Lilly et al. 1995; Connolly et al. 1997). There is little or no overlap between the ERO population used in our analysis and the classes of galaxies which are employed in these previous studies and hence their contributions to the total star formation density are distinct. This implies that the activity in obscured galaxies makes a sizable contribution to the total star formation at , especially when allowance is made for the proportion of the obscured star forming population which are missing from our ERO sample due to the escape of a small fraction of UV light. The significant contribution from obscured star formation at confirms earlier claims by Flores et al. (1999) and Haarsma et al. (2001) and is particularly important as this era represents the peak in the star formation activity in the Universe (note that when integrated over cosmic time, the distribution in Fig. 7 is highly peaked at –2). This result therefore extends the conclusions of the mid-infrared, submillimeter and radio surveys, that the use of obscuration-independent measures of the star formation rate is critical to reliably estimate the total star formation density, from –3 to the era when most of the stars seen in galaxies today were formed.
4.3. Dusty EROs in the Far-infrared and Submillimeter
We now estimate the volume density of the most strongly star forming EROs. Based on the photometric redshifts for the 11 radio-detected EROs which are well-fit by a dusty SED, we estimate a median radio luminosity of W Hz-1 (compared to the Galaxy’s radio luminosity of W Hz-1). Assuming these galaxies follow the local radio–far-infrared correlation, this translates into a median far-infrared luminosity of for the subsample. The brightest five EROs in this subsample have inferred far-infrared luminosities above which classes them as ultraluminous infrared galaxies (ULIRGs). Based on these five galaxies we estimate a surface density of radio-detected ULIRG EROs of arcmin-2. This estimate could be increased by to account for radio-detected EROs which are not well-fit by our model SEDs, although equally any increases should be offset against any AGN contribution to the radio luminosities of these galaxies.
Using the volume containing the dusty ERO sample given in §4.2 we estimate an equivalent space density of ULIRG EROs as Mpc-3 (and Mpc-3 for all dusty EROs brighter than ). This is significantly higher than the space density of comparable luminosity events locally, Mpc-3 (Sanders & Mirabel 1996), even before allowance is made for the fact that some high- ULIRGs will be missing from our ERO selection due to their blue colors (Trentham et al. 1999; Goldader et al. 2002). Based upon the far-UV colors of local ULIRGs it appears that more than half of this population would be too blue at –2 to be included in our ERO sample. Hence, if local ULIRGs are good analogs for the events which produce the high- ULIRG population then our volume density of ULIRGs would require an upwards revision by a factor of . We conclude that there has been at least an order of magnitude decrease in the number density of these luminous infrared events between –2 (8–10 Gyrs ago) and the present-day. This trend is consistent with the evolutionary models of Blain et al. (1999a), which also fit the number counts of SCUBA galaxies at higher redshifts (Fig. 7).
We can also estimate the submillimeter fluxes from the radio-detected EROs and hence investigate their relationship to the 850-m selected samples detected by SCUBA. Based on the individual radio fluxes and estimated redshifts for the EROs we would predict a median 850-m flux of 2 mJy and a range of 0.3–5 mJy (Carilli & Yun 2000). This places the bulk of these galaxies below the flux limit of typical SCUBA observations of faint radio sources (e.g. Chapman et al. 2001) and at least half of them below the confusion limit of the deepest (unlensed) SCUBA surveys. Clearly the radio/ERO selection allows us to probe the star forming population to lower star formation rates (and also lower redshifts) than typically achieved in submm surveys as demonstrated by our detection of all three cataloged submm sources in our field (see Ledlow et al. 2002).
Nevertheless, the most luminous radio-detected EROs should overlap with samples of ERO counterparts to SCUBA galaxies. We can test this by comparing the surface densities of these two populations. Our estimate of the surface density of mJy radio-detected EROs is arcmin-2 at . This can be compared to the claim that % of the counterparts to SCUBA galaxies brighter than 2 mJy have and , equivalent to a surface density of arcmin-2, (Smail et al. 1999a, 2002; see also Mohan et al. 2002) and the estimate surface density of EROs brighter than 8 mJy of 0.03 arcmin-2 from Ivison et al. (2002). Allowing for the large uncertainties in these estimates, and the possible upward revision of the density of radio-selected ULIRGs to account for badly-fit SEDs (including the known SCUBA ERO #01206), we conclude that they are in reasonable agreement. This suggests that by combining sensitive radio and submillimeter surveys it will be possible to track the evolution of the star formation density in highly-obscured galaxies from to –5 (Owen et al. 2002; Chapman et al. 2002b).
Finally, we estimate the contribution from the dusty ERO population to the far-infrared background at a wavelength corresponding to the peak of their dust emission: m. Scaling from the 1.4-GHz emission we estimate that the dusty ERO population produces W m-2 sr-1 at m, compared to estimates of the background at this wavelength of W m-2 sr-1 (Hauser et al. 1998; Lagache & Puget 2000). Thus the dusty EROs could contribute –10% of the far-infrared background at its peak at m. This compares to the SCUBA population which produces % of the background at 850m (Blain et al. 1999b; Smail et al. 2002; Cowie et al. 2002) and probably the bulk of the far-infrared background at m (where the dust emission peaks for a population with a characteristic temperature of 40 K at –3). Both the dusty ERO and the SCUBA population contribute % of the extragalactic background at m, underlining the very different nature of the populations selected in the optical and the submillimeter/radio wavebands.
4.4. The Passive ERO Population
Our suggestion that at least a half of the faint ERO population are dust-enshrouded starbursts obviously reduces the estimated volume density of passive, evolved EROs. We estimate that passive EROs at have a volume density of Mpc-3 for galaxies with a typical luminosity of . Passive evolution of the stellar populations would produce mags of brightening in the observed -band to this redshift, meaning that these galaxies would have at the present day if they evolve passively. This assumes that the passive EROs inhabit the same volume estimated for the dusty ERO population, although as we discussed in §4.1 these systems may lie in a smaller volume and hence this volume density should be taken as a lower limit. In this regard we note that the passive sample from Cimatti et al. (2002) have , where the error represents the 1- dispersion, and a quartile range of –1.2, somewhat narrower than the redshift range we use – and suggesting a volume for the sample closer to Mpc3. Adopting this volume would roughly double our estimate of the volume density of passive EROs.
The most frequently proposed local analogs to passive EROs are elliptical galaxies, although it is clear that apparently passive EROs embrace a wider cross-section of the population than just disk-less bulges (Smith et al. 2002b). It is consequently difficult to compare the volume density of this population with that of their possible descendants at the present-day. However, we note that the combination of our reduction in the proportion of passive galaxies in the ERO population, coupled with the increase in the diversity of their morphological counterparts identified by Smith et al. (2002b), means that previously well-fitting pure luminosity evolution models with a high redshift of formation, , will now over predict the ERO counts at (Daddi et al. 2000; Firth et al. 2001; Smith et al. 2002a). This suggests there may be some scope for the recent formation (or transformation) of some fraction of the local elliptical galaxy population (e.g. Aguerri & Trujillo 2002). Nevertheless, the reduction in the proportion of passive systems in the ERO population is still not sufficient to reconcile the observed surface density of evolved EROs with that predicted by semi-analytic galaxy formation models (Smith et al. 2002a; Cole et al. 2000).
The proposed reduction in the passive ERO fraction also has ramifications for several previous results based on the properties of the whole ERO population. The most obvious is the interpretation of the strong clustering signal seen in ERO samples (Daddi et al. 2001, 2002; McCarthy et al. 2001). The strong angular clustering of the ERO population, especially for the brightest examples, appears to vindicate the predictions of hierarchical galaxy formation models assuming these galaxies represent the passive, evolved progenitors of present-day ellipticals (Firth et al. 2001). In the same manner, the apparent agreement between the angular clustering of Lyman-break objects at and theoretical models of halo clustering has provided support for the suggestion that these objects are the progenitors of massive ellipticals (Giavalisco & Dickinson 2001).
However, the presence of a large proportion of, perhaps weakly clustered, dusty EROs in the bright ERO population would tend to dilute the angular clustering signal arising from the strongly clustered passive EROs, unless there is a strong cross-correlation between the two populations (see Daddi et al. 2002 and §3.3). Indeed, a further element comes into play when attempting to interpret the projected clustering of ERO samples: the redshift depth of the volume containing the galaxies. If the passive ERO population lies in a relatively narrow redshift range (see the toy models in §4.1; Firth et al. 2001) then the dilution effect from the depth of the sample will be less than anticipated, requiring an intrinsically less strongly clustered population to produced a given angular clustering signal (Daddi et al. 2001). Thus the effects of a narrower redshift depth for the evolved ERO subsample and the increased proportion of weakly-clustered, but typically faint, dusty EROs may cancel each other out leaving the estimated correlation length for the bright, evolved EROs close to that required for the progenitors of the elliptical galaxies seen in the local Universe, as estimated by Daddi et al. (2001) and McCarthy et al. (2001). We conclude that the complex interplay between the sample volume and the mix of evolved and obscured galaxies in the ERO population as a function of apparent magnitude means that the interpretation of the angular clustering of this class of galaxies is far from trivial.
5. Conclusions
The main conclusions of this work are:
1) We catalog 68 EROs within a 72.8 arcmin2 field which has the deepest 1.4-GHz observations of any region on the sky. We find that 31% of these EROs are detected in the radio map down to a flux limit of 12.6 Jy, of these radio-detected EROs, 33% are resolved in our VLA map with a typical FWHM of – equivalent to kpc at . Moreover, the radio emission in these EROs mirrors their -band morphologies, suggesting that star formation is responsible for the bulk of the radio flux.
2) Using our deep imaging we photometrically classify the radio-detected and undetected EROs into dusty or evolved systems based on simple SED models. We first analyse the colors of those radio-detected with high quality photometry and conclude that the majority of these are adequately described by a highly dust-reddened starburst spectrum. This provides support for applying this analysis to the radio-undetected EROs to search for similar obscured, active galaxies.
3) Using our simple photometric models we estimate that more than 32% of the radio-undetected EROs with high quality photometry, or a minimum of 20% of all radio-undetected EROs, have the colors of dusty starbursts, similar to the radio-detected EROs. We estimate the rate of mis-classification of EROs in our analysis assuming that most of the radio-detected EROs are actually dusty starbursts, and based on this propose that % of the EROs with radio fluxes Jy have dusty SEDs. From the continuity of the number counts of radio-detected EROs we would expect that most of these sources would have 1.4-GHz fluxes around 5 Jy. We also find that one of the 68 EROs has an SED consistent with galactic star, while another apparent ERO appears to be a transient source.
4) Combining the samples of radio-detected and undetected EROs which are photometrically classified as dusty we place a firm lower limit of % on the proportion of dusty starbursts in the whole ERO population. To obtain a more realistic estimate we adopt a correction for mis-classification and assume the resulting proportions of dusty and evolved EROs are representative of the full sample (not just those with the best photometry) we estimate that at least 45–50%, and possibly up to %, of the whole ERO population with and are probably dusty, active galaxies. Our fitting procedure also suggests a median redshift of with a quartile range of –1.5. This is in reasonable agreement with the spectroscopic survey of somewhat brighter and bluer EROs by Cimatti et al. (2002). Assuming that AGN do not dominate the radio emission from these galaxies, we estimate a volume density of EROs with far-infrared luminosities of (i.e. ULIRGs) of Mpc-3, this is over an order of magnitude higher than for equivalent luminosity events at and confirms the strong evolution of the most dusty, active galaxies out to (Blain et al. 1999a).
5) We use the local far-infrared–radio correlation to estimate star formation rates from the radio fluxes of the dusty EROs, assuming that their radio emission is purely powered by massive star formation. Combining these estimates with the probable volume spanned by our dusty ERO subsample we can calculate the star formation density in this obscured population. Adopting conservative assumptions we find that the star formation density in star forming EROs at probably exceeds 0.1–100 M M⊙ yr-1 Mpc-3 and maybe as high as M⊙ yr-1 Mpc-3. This measurement is comparable to estimates of the star formation density in H-selected galaxies at these epochs, and greater than that seen in optically–selected galaxies, showing that the activity in obscured systems may make a significant contribution to the total star formation at . We also estimate that the dusty ERO population may produce up to 5–10% of the far-infrared background at its peak at m, underlining the cosmological significance of these events for understanding the history of star formation in the Universe.
6) We propose that the apparent break in the integrated counts of the EROs at –20 reflects the peak of the contribution from passive, evolved galaxies to this population. At magnitudes fainter than we predict that the population will be increasing dominated by dusty, active galaxies. The continuity in the properties of these faint dusty EROs connects them to samples of submm-selected obscured starbursts at higher redshifts and fainter -band magnitudes. This proposal can be tested by studies of the multiwavelength properties of extremely faint samples of EROs, , and their relationship to the blank-field populations of radio sources.
7) By identifying the likely contribution from dusty EROs to the total ERO population we estimate that the volume density of passive, evolved galaxies brighter than is Mpc-3. Recent results point to a morphological diversity in the passive ERO population which would suggest that these galaxies should not be simply viewed as passively evolving ellipticals (Smith et al. 2002b). We conclude that previously well-fitting pure luminosity evolution models, which described the number counts of the whole ERO sample as due to a passively evolving elliptical population formed at high redshifts, will probably over predict the number of truly passive EROs and hence there is scope for the recent (trans)formation of some local elliptical galaxies. Nevertheless, the presence of luminous, passive galaxies at does point to a phase of massive spheroid formation at higher redshifts, consistent with the interpretation of the SCUBA population as the formation phase of massive, proto-ellipticals (Lilly et al. 1999; Smail et al. 2002, 2003). The typical, reddening-corrected luminosities of the radio-detected ERO population at suggests that these galaxies will evolve into sub- systems by the present-day unless their star formation activity continues at a high rate for yrs.
The area analysed in this work covers a small fraction of the sensitive field of our VLA map – we expect to be able to quadruple the ERO sample available for analysis in the near future. In addition we are undertaking a full photometric analysis of the optically-bright Jy radio sources in this field using our panoramic imaging dataset (Owen et al. 2002), constrained by deep spectroscopy from GMOS on Gemini.
Acknowledgements
We thank Taddy Kodama, F. Nakata and S. Okamura for kindly allowing us to use their exquisite Subaru Suprime-Cam imaging. We also acknowledge useful conversations with Dave Alexander, Andrew Blain, Scott Chapman, Andrea Cimatti, Adriano Fontana, Bianca Poggianti, Alice Shapley, Graham Smith and Chuck Steidel. We thank an anonymous referee for their thorough and constructive comments which improved the clarity and presentation of this work. IRS acknowledges support from a Royal Society University Research Fellowship and a Philip Leverhulme Prize Fellowship. GEM gratefully acknowledges the support of JPL (contracts #1147 and #1166) and also the support of Vanguard Research, Inc.
References
- (1) Aguerri J.A.L., Trujillo I., 2002, MNRAS, in press
- (2) Alexander D.M., Brandt W.N., Hornschemeier A.E., Garmire G.P., Schneider D.P., Bauer F.E., Griffiths R.E., 2001, AJ, 122, 2156
- (3) Alexander D.M., Vignali C., Bauer F.E., Brandt W.N., Hornschemeier A.E., Garmire G.P., Schneider D.P., 2002, AJ, in press
- (4) Barger A.J., Cowie L.L., Richards E., 2000, AJ, 119, 2092
- (5) Benn C.R., Rowan-Robinson M., McMahon R., Broadhurst T.J., Lawrence A., 1993, MNRAS, 263, 98
- (6) Bertin E., Arnouts S., 1996, A&A, 117, 393
- (7) Blain A.W., Smail I., Ivison R.J., Kneib J.-P., 1999a, MNRAS, 302, 632
- (8) Blain A.W., Kneib J.-P., Ivison R.J., Smail I., 1999b, ApJ, 512, L87
- (9) Bolzonella M., Miralles J.-M., Pelló R., 2000, A&A, 363, 476
- (10) Brusa M., Comastri A., Daddi E., Cimatti A., Vignal C., in “X-ray spectroscopy of AGN with Chandra and XMM/Newton”, eds. Boller Th., Komossa S., Kahn S., Kunioda H., 2002.
- (11) Calzetti, D., Armus, L., Bohlin, R.C., Kinney, A.L., et al., 2000, ApJ, 533, 682
- (12) Carilli C.L., Yun M.S., 2000, ApJ, 530, 618
- (13) Carilli C.L., Poggianti B.M., et al., 2002, in prep
- (14) Chapman, S.C., McCarthy P.J., Persson, S.E., 2000, AJ, 120, 1612
- (15) Chapman S.C., Richards E.A., Lewis G., Wilson G., Barger A., 2001, ApJ, 548, L147
- (16) Chapman S.C., Barger A.J., Cowie L.L., Borys C., et al., 2002a, ApJ, submitted
- (17) Chapman S.C., Blain A.W., Ivison R.J., Smail I., 2002b, Nature, submitted
- (18) Chen, H.-W., McCarthy, P.J., Marzske, R.O., Wilson, J., et al., 2002, ApJ, 570, 54
- (19) Cimatti A., Daddi E., Mignoli M., Pozzetti, L., Renzini A., et al., 2002, A&A, 381, L68
- (20) Cole S., Lacey C.G., Baugh C.M., Frenk C.S., 2000, MNRAS, 319, 204
- (21) Cole S., Norberg P., Baugh C.M., Frenk C.S., et al., 2001, MNRAS, 326, 255
- (22) Condon J.J., 1992, ARAA, 30, 575
- (23) Condon J.J, Anderson M.L., Helou G., 1991, ApJ, 376, 95
- (24) Connolly A., Szalay A.S., Dickinson M., Subbarao M.U., Brunner R.J., 1997, ApJ, 486, L11
- (25) Cowie L.L., Barger A.J., Bautz M.W., Capak P., Crawford C.S., Fabian A.C., Hu E.M., Iwamuro F., Kneib J.-P., Maihara T., Motohara K., 2001, ApJL, 551, 9
- (26) Cowie L.L., Barger A.J., Kneib J.-P., 2002, AJ, in press
- (27) Cram L., Hopkins A., Mobasher B., Rowan-Robinson M., 1998, ApJ, 507, 155
- (28) Daddi E., Cimatti A., Pozzetti L., Hoekstra H., Rottgering H.J.A., Renzini A., Zamorani G., Mannucci F., 2000, A&A, 361, 535
- (29) Daddi E., Broadhurst T.J., Zamorani G., Cimatti A., Rottgering H., Renzini A., 2001, A&A, 376, 745
- (30) Daddi E., Cimatti A., Broadhurst T.J., Renzini A., Zamorani G., et al., 2002, A&A, in press
- (31) Dey A., Graham J.R., Ivison R.J., Smail I., Wright G.S., Liu M.C., 1999, ApJ, 519, 610
- (32) Dressler A., Oemler A., Sparks W.B., Lucas R.A., 1994, ApJ, 430, 107
- (33) Dressler A., Oemler A., Couch W.J., Smail I., Ellis R.S., Barger A., Butcher H., Poggianti B.M., Sharples R.M., 1997, ApJ, 490, 577
- (34) Dressler A., et al., 2002, ApJ, in prep
- (35) Flores H., Hammer F., Thuan T.X., et al., 1999, ApJ, 517, 148
- (36) Firth A.E., Somerville R.S., McMahon R.G., Lahav O., et al., 2002, MNRAS, submitted
- (37) Franceschini A., Fadda D., Cesarsky C., Elbaz D., Flores H., Granato G.L., 2002, ApJ, submitted
- (38) Gallego J., Zamorano J., Rego M., Vitores A.G., 1997, ApJ, 475, 502
- (39) Gardner J.P., Cowie L.L., Wainscoat R.J., 1993, ApJL, 415, 9
- (40) Gallimore J.F., Keel W.C., 1993, AJ, 106, 1337
- (41) Gal-Yam A., Ofek E.O., Filippenko A.V., Chornock R., Li W., 2002, PASP, submitted
- (42) Garrett M.A., 2002, A&A, in press
- (43) Georgakakis A.E., Mobasher B., Cram L., Hopkins A., 1999, MNRAS, 310, L15
- (44) Giavalisco M., Dickinson M., 2001, ApJ, 550, 177
- (45) Goldader J.D., Meurer G., Heckman T.M., Seibert M., Sanders D.B., et al., 2002, ApJ, in press
- (46) Haarsma D.B., Partridge R.B., Windhorst R.A., Richards E.A., 2000, ApJ, 544, 641
- (47) Hammer F., Crampton D., Lilly S.J., Le Fevre O., Kenet T., 1995, MNRAS, 276, 1085
- (48) Hauser M.G., Arendt R.G., Kelsall T., Dwek E., Edegard N., et al., 1998, ApJ, 508, 25
- (49) Hawarden T.G., Leggett S.K., Letawsky M.B., Ballantyne D.R., Casali M.M., 2001, MNRAS, 325, 563
- (50) Hopkins A., Connolly A.J., Haarsma D.B., Cram L.E., 2001, AJ, 122, 288
- (51) Iye M., Iwamuro F., Maihara T., Miyazaki S., Okamura S., et al., 2000, PASJ, 52, 9
- (52) Ivison, R.J., Greve, T., Smail, I., Dunlop, J.S., et al., 2002, MNRAS, submitted
- (53) Kodama T., Smail I., Nakata F., Okamura S., Bower R.G., 2001, ApJL, 562, L9
- (54) Lagache G., Puget J.L., 2000, A&A, 355, L17
- (55) Ledlow M., Smail I., Owen F.N., Keel W.C., Ivison R.J., Morrison G., 2002, ApJL, in press
- (56) Lilly S.J., Tresse L., Hammer F., Crampton D., Le Fevre O., 1995, ApJ, 455, L108
- (57) Lilly S.J., Eales S.A., Gear W.K.P., Hammer F., Le Fevre O., et al., 1999, 518, 641
- (58) Lutz D., Dunlop J.S., Almaini O., Andreani P., Blain A., et al., 2001, A&A, 378, L70
- (59) Mainieri V., et al., 2002, A&A, 393, 425
- (60) Mannucci F., Pozzetti L., Thompson D., Oliva E., Baffa C., et al., 2002, MNRAS, 329, L57
- (61) Martini P., 2001, AJ, 121, 598
- (62) McCarthy P.J., Carlberg R.G., Chen H.-W., Marzke R.O., et al., 2001, ApJ, 560, L131
- (63) Mirabel I.F., Sanders D.B., 1989, ApJ, 340, L53
- (64) Mobasher B., Cram L., Georgakakis A., Hopkins A., 1999, MNRAS, 308, 45
- (65) Mohan N.R., Cimatti A., Rottgering H.J.A., Andreani P., et al., 2002, A&A, in press
- (66) Moriondo G., Cimatti A., Daddi E., 2000, A& A, 364, 26
- (67) Moran E.C., Lehnert M.D., Helfand D.J., 1999, ApJ, 526, 649
- (68) Morrison G.E., 1999, PhD Thesis, University of New Mexico
- (69) Morrison G.E., Owen F.N., Smail I., Dressler A., et al., 2002, ApJ, in prep
- (70) Muxlow T.W.B., Wilkinson P.N., Richards A.M.S., Kellermann K.I., et al., 1999, NewAR, 43, 623
- (71) Oliver S., Gruppioni C., Serjeant S., 1998, MNRAS, submitted
- (72) Owen F.N., et al., 2002, in prep
- (73) Packham C., Thompson K., Knapen J.H., Zurita A., Smail I., Greimel R., et al., MNRAS, 2002, submitted
- (74) Page M.J., Stevens J.A., Mittaz J.P.D., Carrera F.J., 2002, Science, 294, 2516
- (75) Persson S.E., McCarthy P., Dressler A., Matthews K., 1993, in The Evolution of Galaixes and their Environments, eds., Shull M., Thronson, H., NASA Tech. Report, GPO, p78
- (76) Pierre M., Lidman C., Hunstead R., Alloin D., Casali M., Cesarsky C., Chanial P., Duc P.-A., Fadda D., Flores H., Madden S., Vigroux L., 2001, A&A, 372, L45
- (77) Poggianti B.M., Wu H., 2000, ApJ, 529, 157
- (78) Pozzetti L., Mannucci F., 2000, MNRAS, 317 L17
- (79) Ranalli P., Comastri A., Setti G., 2002, in New Visions of the X-ray Universe, eds Jansen, F., (astro-ph/0202241)
- (80) Richards E.A., 1998, PhD Thesis, U. of Virginia
- (81) Richards E.A., 1999, ApJ, 513, L9
- (82) Richards E.A., 2000, ApJ, 533, 611
- (83) Richards E.A., Kellermann K.I., Fomalont E.B., Windhorst R.A., Partridge R.B., 1998, AJ, 116, 1039
- (84) Richards E.A., Fomalont E.B., Kellermann K.I., Windhorst R.A., et al., 1999, ApJ, 562, L73
- (85) Roche N., Lowenthal J., Koo D., 2002, MNRAS, in press
- (86) Roche, N., Almaini, O., Dunlop, J.S., Ivison, R.J., Willott, C., 2002, MNRAS, submitted
- (87) Sanders D.B., Mirabel I.F., 1996, ARA&A, 34, 749
- (88) Schindler S., Belloni P., Ikebe Y., Hattori M., Wambsganss J., Tanaka Y., 1998, A&A, 338, 843
- (89) Serjeant S., Mobasher B., Gruppioni C., Oliver S., 1999, MNRAS, 317, L29
- (90) Seitz C., Kneib J.-P., Schneider P., Seitz S., 1996, A&A, 314, 707
- (91) Smail I., Ivison R.J., Kneib J.-P., Cowie L.L., Blain A.W., Barger A.J., Owen F.N., Morrison G., 1999a, MNRAS, 308, 1061
- (92) Smail I., Morrison G., Gray, M.E., Owen F.N., Ivison R.J., Kneib J.-P., Ellis, R.S., 1999b, ApJ, 525, 609
- (93) Smail I., Ivison R.J., Blain A.W., Kneib J.-P., 2002, MNRAS, 331, 495
- (94) Smail I., Ivison R.J., Gilbank D.G., Dunlop J.S., Keel W.C., Stevens J.A., 2003, ApJ, in press
- (95) Smith G.P., Treu T., Ellis R.S., Smail I., Kneib J.-P., Frye B.L., 2001, ApJ, 562, 635
- (96) Smith G.P., Smail I., Kneib J.-P., Czoske O., Ebeling H., Edge A.C., Pello R., Ivison R.J., Packham C., Le Borgne J.-F., 2002a, MNRAS, 330, 1
- (97) Smith G.P., Smail I., Kneib J.-P., Davis C.J., Takamiya M., Ebeling H., Czoske O., 2002b, MNRAS, in press
- (98) Snigula J., Drory N., Bender R., Botzler C.S., Feulner G., Hopp U., 2002, MNRAS, in press
- (99) Soifer B.T., Matthews K., Neugebauer G., Armus L., Cohen J.G., Persson S.E., Smail I., 1999, AJ, 118, 2065
- (100) Stanford S.A., Eisenhardt P.R.M., Dickinson M., 1995, ApJ, 450, 512
- (101) Stevens, J.A., Page, M.J., Ivison, R.J., Smail, I., Lehmann I., Hassinger, G., Szokoly G., 2002, MNRAS, submitted
- (102) Thompson D., Beckwith S.V.W., Fockenbrock R., Fried J., Hippelein H., Huang J.-S., von Kuhlmann B., Leinhert C., Meisenheimer K., Phleps S., Roeser H.-J., Thommes E., Wolf C., 1999, ApJ, 523, 100
- (103) Trager S.C., Faber S.M., Dressler A., Oemler, A., 1997, ApJ, 485, 92
- (104) Trentham N., Kormendy J., Sanders D., 1999, AJ, 117, 1152
- (105) Waddington I., Windhorst R.A., Cohen S.H., Partridge R.B., Spinrad H., Stern D., 1999, ApJ, 526, L77
- (106) Waddington I., Windhorst R.A., Dunlop J.S., Koo D.C., Peacock J.A, 2000, MNRAS, 317, 801
- (107) Willott C.J., Rawlings S., Blundell K.M., 2001, MNRAS, 324, 1
- (108) Windhorst R.A., Gordon J.M., Pascarelle S.M., Schmidtke P.C., Keel W.C., Burkey J.M., Dunlop J.S, 1994, 435, 577
- (109) Yan L., McCarthy P.J., Freudling W., et al., 1999, ApJ, 519, 47
- (110) Yan L., 2001, in Gas & Galaxy Evolution, Hibbard J.E., Rupen M.P., van Gorkom J.H., ASP Conf. Series, 240, p117
- (111) Yun, M.S., Reddy, N.A., Condon, J.J., 2001, ApJ, 554, 803
| ID | R.A./Dec. | SEDb | Morphc | |||||||||
|---|---|---|---|---|---|---|---|---|---|---|---|---|
| (J2000) | (Jy) | |||||||||||
| 01045 | 09 42 29.260 47 00 31.30 | 19.10 | 5.31 | B | …/C | |||||||
| 01049 | 09 42 29.750 47 03 22.50 | 18.72 | 5.53 | D | …/I | |||||||
| 01050 | 09 42 30.500 46 56 41.70 | 19.88 | 5.74 | D | …/I | |||||||
| 01053 | 09 42 30.610 47 00 21.70 | 17.51 | 5.60 | D | …/I | |||||||
| 01071 | 09 42 32.940 46 57 31.70 | 18.97 | D | …/F | ||||||||
| 01081 | 09 42 34.140 47 00 14.40 | 20.20 | 5.44 | D | …/I | |||||||
| 01105 | 09 42 37.980 47 01 20.90 | 19.33 | 5.88 | B | …/I | |||||||
| 01110 | 09 42 38.880 47 01 33.60 | 19.95 | 6.13 | D | …/I | |||||||
| 01115 | 09 42 40.000 47 02 28.10 | 19.89 | 5.45 | D | …/I | |||||||
| 01118 | 09 42 40.340 47 00 16.30 | 18.88 | 5.32 | D | I/I | |||||||
| 01137 | 09 42 43.430 46 56 23.00 | 19.62 | 5.30 | B | I/I | |||||||
| 01150 | 09 42 44.840 46 56 37.50 | 19.66 | … | F/F | ||||||||
| 01157 | 09 42 46.250 46 59 30.20 | 20.07 | … | I/F | ||||||||
| 01176 | 09 42 49.970 46 57 40.60 | 20.08 | 5.66 | D | I/I | |||||||
| 01206 | 09 42 54.540 46 58 44.10 | 20.10 | … | Id/F | ||||||||
| 01273 | 09 43 02.680 47 01 42.60 | 20.05 | 5.97 | D | F/F | |||||||
| 01338 | 09 43 09.750 47 00 04.10 | 20.03 | … | I/F | ||||||||
| 11018 | 09 43 13.067 46 55 50.07 | 18.59 | 5.94 | B | I/I | |||||||
| 11077 | 09 43 00.187 46 56 01.51 | 19.10 | 5.87 | E | I/I | |||||||
| 12861 | 09 42 58.729 47 03 39.62 | 19.60 | 6.73 | B | …/I | |||||||
| 13963 | 09 43 13.663 47 02 07.60 | 20.45 | D | I/I | ||||||||
| 1091 | 09 42 27.721 46 56 07.02 | 19.47 | … | …/F | ||||||||
| 1097 | 09 42 30.347 46 56 05.44 | 20.15 | 5.34 | B | …/I | |||||||
| 1136 | 09 42 40.436 46 56 13.55 | 19.69 | 5.56 | D | F/C | |||||||
| 1183 | 09 42 55.042 46 56 26.84 | 19.98 | 5.31 | E | I/I | |||||||
| 1188 | 09 42 56.197 46 56 24.13 | 19.46 | … | F/F | ||||||||
| 1200 | 09 42 52.459 46 56 31.11 | 18.71 | B | C/I | ||||||||
| 1206 | 09 43 04.291 46 56 32.52 | 19.91 | … | F/F | ||||||||
| 1321 | 09 43 01.416 46 56 59.37 | 19.52 | 6.15 | E | I/I | |||||||
| 1349 | 09 42 36.967 46 57 06.70 | 19.55 | 5.54 | E | …/I | |||||||
| 1473 | 09 42 54.991 46 57 37.60 | 19.35 | 5.66 | B | C/C | |||||||
| 1523 | 09 42 55.919 46 57 46.88 | 19.57 | 5.32 | D | Cf/C | |||||||
| 1571 | 09 42 49.721 46 57 54.12 | 19.92 | … | F/F | ||||||||
| 1574 | 09 42 53.270 46 57 56.70 | 19.50 | D | I/I | ||||||||
| 1578 | 09 42 48.720 46 58 00.70 | 19.91 | … | F/F | ||||||||
| 1762 | 09 42 35.264 46 58 38.27 | 19.56 | 5.30 | E | …/F | |||||||
| 1831 | 09 42 29.994 46 58 53.86 | 20.25 | … | …/F | ||||||||
| 1931 | 09 42 59.183 46 59 17.34 | 18.68 | B | Ie/I | ||||||||
| 1961 | 09 42 27.404 46 59 19.52 | 20.33 | … | …/F | ||||||||
| 1998 | 09 42 46.730 46 59 29.12 | 19.78 | 5.53 | D | C/I | |||||||
| 2047 | 09 42 45.795 46 59 36.12 | 20.26 | 5.85 | E | F/I | |||||||
| 2128 | 09 43 12.079 46 59 58.69 | 18.86 | 5.39 | D | I/F | |||||||
| 2176 | 09 43 12.745 47 00 02.55 | 19.85 | 6.03 | D | C/I | |||||||
| 2334 | 09 42 36.727 47 00 27.71 | 20.21 | … | …/F | ||||||||
| 2351 | 09 42 23.653 47 00 33.41 | 19.85 | … | …/… | ||||||||
| 2405 | 09 42 34.421 47 00 44.61 | 20.29 | 5.51 | E | …/I | |||||||
| 2418g | 09 42 42.925 47 00 53.59 | 17.79 | 6.08 | B | …/C | |||||||
| 2510 | 09 42 38.542 47 01 11.67 | 19.14 | 5.37 | B | …/I | |||||||
| 2528 | 09 42 29.343 47 01 10.44 | 20.34 | … | …/F | ||||||||
| 2549h | 09 42 57.330 47 01 17.81 | 19.01 | B | …/F | ||||||||
| 2593 | 09 42 30.669 47 01 27.41 | 19.55 | 5.92 | D | …/I | |||||||
| 2637 | 09 42 36.916 47 01 37.91 | 19.42 | 5.96 | B | …/I | |||||||
| 2762 | 09 43 07.026 47 03 08.20 | 20.11 | … | …/F | ||||||||
| 2769 | 09 43 01.067 47 02 59.08 | 19.57 | … | …/F | ||||||||
| 2770 | 09 43 00.967 47 03 16.07 | 19.65 | 5.90 | D | …/I | |||||||
| 2778 | 09 42 43.902 47 03 15.18 | 20.15 | … | …/F | ||||||||
| 2801 | 09 43 01.485 47 03 16.40 | 20.13 | … | …/F | ||||||||
| 2807 | 09 43 06.467 47 03 11.84 | 19.78 | … | …/F | ||||||||
| 2862 | 09 42 30.473 47 03 17.54 | 19.03 | 5.49 | E | …/I | |||||||
| 2972 | 09 42 26.348 47 03 45.41 | 19.39 | 5.79 | … | …/F | |||||||
| 2976 | 09 42 28.057 47 04 00.26 | 19.14 | … | …/F | ||||||||
| 2980 | 09 42 37.738 47 03 49.80 | 19.70 | 5.37 | E | …/I | |||||||
| 2984 | 09 42 30.238 47 03 44.30 | 19.61 | 5.59 | E | …/I | |||||||
| 3004 | 09 42 55.478 47 04 14.86 | 19.44 | 6.17 | E | …/I | |||||||
| 3082 | 09 43 03.066 47 04 04.24 | 19.78 | 5.68 | E | …/I | |||||||
| 3732 | 09 42 37.383 47 03 32.32 | 18.59 | 5.62 | B | …/C | |||||||
| 3930 | 09 42 53.314 47 02 05.63 | 20.11 | 5.40 | D | F/C | |||||||
| 3942 | 09 42 27.216 47 02 09.18 | 19.31 | 5.79 | B | …/I |
) Photometric errors in 0.01 mags are listed in []. ) Best-fitting model SED: D, dusty; E, evolved; B, badly fit. ) Morphological classification in - and -bands: “C”, compact/regular; “I”, disky, disturbed or amorphous; “F”, too faint to classify. ) SMM J09429+4658 (Smail et al. 1999). ) ERO #333 (Smail et al. 1999). ) ERO Cl 0939+4713 A (Persson et al. 1993). ) M star. ) Transient source.