Chandra imaging spectroscopy of 1E 1740.7 – 2942
Abstract
We have observed the black hole candidate 1E 1740.7 –2942, the brightest persistent hard X-ray source within a few degrees of the Galactic centre, for 10 ksec with Chandra (ACIS-I) on August 2000. Attempting to compensate for pile-up effects we found the spectra were well-fit by an absorbed power law, with photon indices (readout streak) and (annulus), consistent with a black hole low/hard state. We have analysed a public observation performed by Chandra which utilised short frames in order to avoid severe pile-up effects: subtracting the core point spread function from the whole image, we did not find evidence for any elongated feature perpendicular to the radio jet axis, as reported in a recent analysis of the same data. Moreover, comparing the radial profiles with those of an unscattered X-ray point source, we found indication of an extended, previously undetected, X-ray scattering halo. The measured halo fractional intensity at 3 keV is between 30 and 40 percent within 40 arcsec but drops below detectable levels at 5 keV. Finally, by placing a limit on the X-ray flux from the radio emitting lobe which has been identified as the hot spot at the end of the northern jet of 1E 1740.7 – 2942, we are able to constrain the magnetic energy density in that region.
keywords:
binaries: general – stars: individual (1E 1740.7 – 2942) – X-ray: general – ISM: dust, extinction1 Introduction
The Black Hole Candidate (BHC) 1E 1740.7 – 2942 is the brightest hard
X-ray source close to the centre of our Galaxy, with a hard X-ray
spectrum and luminosity comparable to Cygnus X-1 (Liang & Nolan 1984;
Sunyaev et al. 1991a; Liang 1993). Interest in this source increased
following the discovery of its association with a double sided
radio-emitting jet by Mirabel et al. (1992), since when it has been
classified as a “microquasar”. Unfortunately 1E 1740.7 – 2942
suffers from extremely high galactic extinction: intense searches,
both in the optical and IR band, have failed to identify a counterpart
(Prince & Skinner 1991; Mereghetti et al. 1992; Djorgovski et al. 1992;
Mirabel & Duc 1992; Marti et al. 2000; Eikenberry et al. 2001). It has
been proposed that 1E 1740.7 – 2942 is accreting from a nearby molecular
cloud in which the source is likely to be embedded (Bally & Leventhal
1991; Mirabel et al. 1991; Phillips et al. 1995; Yan & Dalgarno 1997).
Recently, Smith et al. (2001) reported the detection of a weak
periodic modulation in the long-term X-ray lightcurve: a period of
about 12.5 days has been estimated. In addition much effort has been
devoted to the possible identification of 1E 1740.7 – 2942 with a source
of 511 keV annihilation radiation, but any definitive confirmation has
been not reported so far (Bouchet et al. 1991; Sunyaev et al. 1991b;
Anantharamaiah et al. 1993; Jung et al. 1995). Due to its very high
hydrogen column density ( cm-2 – e.g. Sheth
et al. 1996; Churazov et al. 1996; Sakano et al. 1999) this object is in
principle an ideal candidate to investigate the properties of the
X-ray scattering halos which are known to be generated by dust grains
along the line of sight and which provide an unique opportunity to probe
the dust component of the interstellar medium (see Predehl & Schmitt
1995) as well as potentially measuring the distance (Predehl et al. 2000).
X-ray halos have been observed by Einstein, ROSAT and
ASCA, but thanks to the Chandra’s angular and energy
resolution it is now possible to detect and investigate them in far
greater detail than ever before. More recently Cui et al. (2001)
observed 1E 1740.7 – 2942 with Chandra HETGS and reported the
detection of an elongated X-ray feature in the zeroth-order image, with
an extension of about 3 arcsec, orientated roughly perpendicular to
the radio-jet axis.
This paper is structured as follows: in section 2 we
describe the observation and present our results focusing on the
spectral analysis and on the overall structure of the source, which
has been reconstructed both from our observation and from another
public observation (see Cui et al. 2001), in which the effects of the
pile-up do not distort the central region of the image. In section 3
we show some preliminary results on the X-ray halo investigation,
comparing the radial profiles of 1E 1740.7 – 2942 with those of an X-ray
point-like source which is supposed to be unscattered, while in the
fourth section we provide an estimate of X-ray and radio fluxes coming
from the radio emitting region which as been identified as the hot
spot at the end of the northern jet of 1E 1740.7 – 2942. The last
section is devoted to our summary and conclusions.
2 Observation and data analysis
We observed 1E 1740.7 – 2942 with the Chandra Advanced CCD Imaging Spectrometer (ACIS, Garmire 1997) on 2000 August 30 16:59-20:00 with the nominal frame time of 3.2 sec, for a total on source time of about 10 ks. Standard processing of the data was performed by the Chandra X-ray Center (CXC). The Chandra Interactive Analysis of Observations (CIAO) tools (version 2.2) together with XSPEC (version 11.1) have been used for analysing the data. The ACIS-I camera consists of an array of four front-illuminated CCDs. The physical pixel size is 0.24 m, which at the aim-point of the telescope is comparable to the 0”.5 spatial resolving power of the High Resolution Mirror Assembly (HRMA). Each CCD contains 1024 x 1024 pixels organized into four readout nodes each of which reads out 1024 rows and 256 columns of pixels. The source was positioned close to the aim-point of the telescope, which is about 960 rows away from the readout node, on ACIS-I device I3. As expected due to the relatively high luminosity of 1E 1740.7 – 2942, the image suffers from severe pile-up effects, which affect especially the central region, giving rise to an apparent “hole” of no events at the centre of the source. That means that the total energy of the events is larger than the threshold ( 15 keV) and is then rejected. In addition clearly visible is the “readout streak”, which arises as a result of all pixels in the column in which the bright source lies being exposed to that source for 40 microseconds. The measured count rate for a circular region with a radius of 4 pixels centered on 1E 1740.7 – 2942 is 0.053 count/sec. Note that, based on previous observations of 1E 1740.7 – 2942, PIMMS predicts a pile-up fraction for Chandra ACIS-I of .
2.1 X-ray spectrum
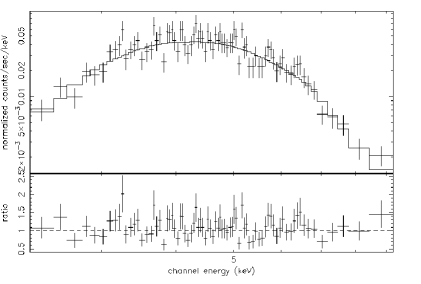
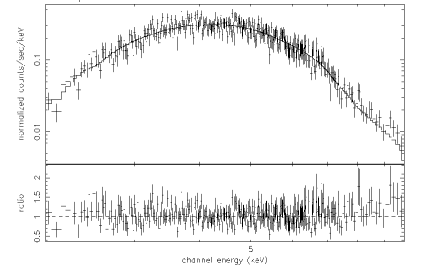
Despite the poor statistics we were able to extract the spectrum from the readout streak which does not suffer of pile-up effects due to about 80
times shorter exposure. In order to do this we isolated a region of width 5 pixels (PSF FWHM is about 2 pixels), centered on the readout streak, extending from just outside the core region to the edge of the CCD. The result is shown in Fig. 1, left panel. The best fit model (=82/80) requires an absorbed power law with a photon index . The hydrogen column density turns out to be extremely high, even for a source located in the Galactic centre: cm-2. The integrated unabsorbed 2-10 keV flux is erg/cm2/sec, corresponding to an unabsorbed soft X-ray luminosity of erg s-1, at a distance of 8.5 kpc. An alternative approach delivering more counts but possibly more vulnerable to pile-up effects, is to take the X-ray spectrum from an annulus about the piled-up core. In this case we have extracted the spectrum from an annulus between 4 and 30 arcsec (Fig. 1, right panel). The best fit parameters are: , for with , i.e. consistent with those obtained from the readout streak. We do not believe that scattering in the dust halo reported in section 3 will significantly affect this spectral analysis, as the strongest scattering will occur at energies which are heavily absorbed. Our analysis is consistent with a black hole low/hard state, in agreement with Main et al. (1999), who performed a long term monitoring of 1E 1740.7 – 2942: the source was observed 77 times over a period 1000 days: its photon index varied between about 1.4 and 1.8. Note that other recent papers (Sakano et al. 1999, Cui et al. 2001) have however reported rather harder spectra than expected for the low/hard X-ray state, with .
2.2 Morphology
Cui et al. (2001) observed 1E 1740.7 – 2942 for about 10 ks with
Chandra HETGS (Observation Identity 94) adopting an
alternating exposure data mode, with three long frames (nominal 3.2 sec
readout time)
and one short (readout time of 0.3 sec) in order to mitigate
pile-up. Inspecting the zeroth-order image they found evidence of an
elongated X-ray feature,
with an extent of about 3 arcsec,
roughly perpendicular to the axis of the radio lobes. In order to
establish the
reality of this
structure they ran MARX simulations for the HETGS zeroth-order image of a
point source and fitted the simulated Point Spread Function (PSF) to the
short-frame
radial profile, collapsed along the elongation of such a feature. Based on
this approach they estimated that the measured profile is not point like at a
confidence level of 99.9 .
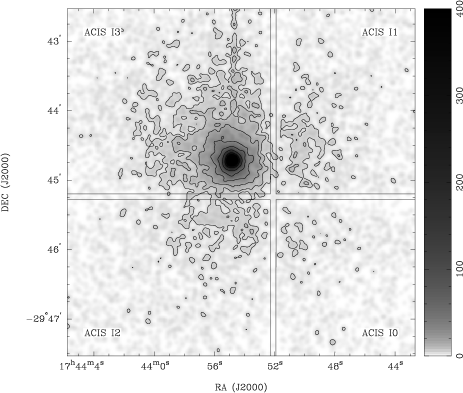
In
Fig. 2 we show our ACIS-I image of 1E 1740.7 – 2942, smoothed with a 4
arcsec Gaussian: we do not see any asymmetry in the X-ray
emission
on scales of a few arcmin.
However, these data are not useful for investigating the elongated feature
reported by Cui et al. , due to the aforementioned pile-up effects.
Nevertheless, we
have also looked at the data of Cui et al. (2001), now publicly available, by
using a quite
different
approach, as follows: the CIAO package tool mkpsf performs an
interpolation
between
PSF
library files, which consist of two dimensional simulated
monochromatic PSF images, stored in multi-dimensional FITS
“hypercubes”
with energies
ranging from 0.277 keV to 8.6 keV and azimuth/elevation steps of either 1
or 5 arcminutes. We extracted the
Chandra PSF
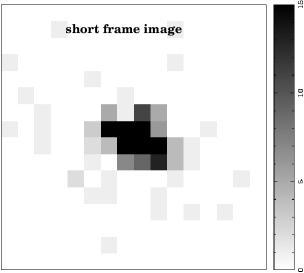
in the brightest point of the image at 5.5 keV, where the energy histogram of
the short frame image reaches its maximum.
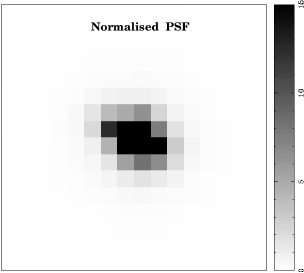
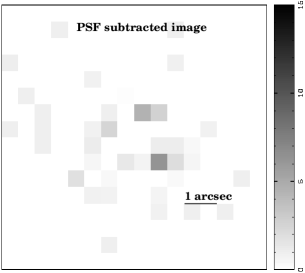
Then we normalised the PSF we obtained
to the total number of counts of the source and subtracted it from the short
frame
image of 1E 1740.7 – 2942, in order to identify some excess.
The result is shown in Fig. 3 : simple visual inspection of the PSF (central panel) suggests that the apparent E-W elongation could be an artifact because it appears in the PSF image itself. This conclusion is confirmed by the subtraction (right panel), which does not reveal the presence of any significant asymmetry. The visible residuals appear to be due to the fact that the normalised PSF, which is of course energy dependent, has been calculated at 5.5 keV, where the short frame image shows its maximum in the number of counts versus energy plot. Furthermore, our experience with observations of unscattered point sources (see below) suggests that the genuine wings of the PSF are even broader than those of the library PSFs.
3 X-ray halo
It is well known that sufficiently dense dust clouds along the line of
sight to a bright X-ray source are expected to produce halos of faint
and diffuse high energy emission because of the (small angle)
scattering of the primary radiation by cosmic dust grains.
Our goal was to extract the radial profiles of 1E 1740.7 – 2942 in
different energy bands and compare them to the Chandra’s PSF in
order to identify any X-ray excess. Following the CIAO threads we
decided to use annuli from 3-100 arcsec with 2 arcsec binning, while
an annulus from 100-110 arcsec has been used for the background
region. As first step we compared the measured profile with that of
the Chandra PSF we obtained through an interpolation of
library PSFs, as we explained in the previous section. However, these
library PSFs have not been derived from on-orbit calibration
information; a detailed comparison to observations is still
incomplete. There are indications that the shape of the library PSFs
do not match the real data very well. In particular the wings (for
distances in excess of about 10 arcsec), which result mainly from
scattering from the microroughness on the X-ray optic surfaces, seem
to be quite different 111See:
http://asc.harvard.edu/ciao/caveats/psflib.html and
http://cxc.harvard.edu/cal/Hrma/hrma/psf/psfwings/psfwings.html
. Following
the same path described in the preceding section, we generated the
Chandra PSF, by interpolation of library files, in the centre
of our image. Then we extracted the PSF radial profile and normalised
it to 1E 1740.7 – 2942 at a radial distance of 4 arcsec ( 8 pixels)
(at which radial distance pile-up effects are negligible). The slope of the
PSF radial profile generated in this way is quite steep
compared to the data: if fitted by a simple power law model,
the profile of the PSF (in count/sec/pixel vs. pixel) has a while the profile of 1E 1740.7 – 2942 is well fitted by a
power law.
In order to rule out the suspicion that such a discrepancy was
not due to an underestimation of the PSF wings we decided to use as
point-like source a public Chandra observation of the high
Galactic latitude Active Galactic Nucleus PKS 2155-304 (Observation
Identity 3167). Predehl & Schmitt (1995), who performed a very
accurate study on X-ray halos around 25 point source observed by
ROSAT, have identified this object as an unscattered X-ray
point source.
Our aim was to obtain the radial profile of this source in units of count sec-1arcsec-2 vs. arcsec and, again, compare it to the 1E 1740.7 – 2942 profile. We calculated the surface brightness distributions using 50 annuli from 0.5-125 arcsec (1–300 pixels). Due to the severe pile-up effects in our observation of 1E 1740.7 – 2942, the comparison between the two profiles is strongly sensitive to the normalisation factor: as we did before, we chose to normalise them to the measured surface brightness distribution value at about 4 arcsec, i.e. in a region where the amount of lost and undetected events should be negligible. In Fig. 4 we show the results of our halo analysis in the two representative energy bands: 2.5-3.5 keV and 4.5-5.5 keV. Clearly distinguishable is the turn over due to the pile-up, which completely obliterates the information in the innermost regions for 1E 1740.7 – 2942.


Looking at the left panel, where the surface brightness distributions between 2.5 and 3.5 keV are plotted, we can see the profile of 1E 1740.7 – 2942 quite significantly exceeding that of PKS 2155-302 between about 5-30 arcsec.
The amount by which 1E 1740.7 – 2942 exceeds PKS 2155 – 304 is dependent on
a number of factors; seeking to minimize the effect of pile-up, as noted
above, we have
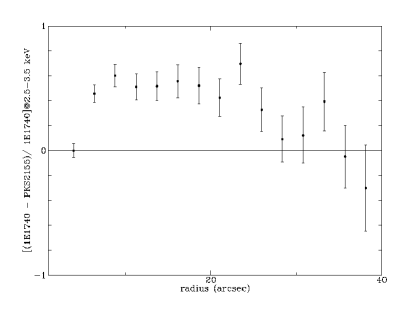
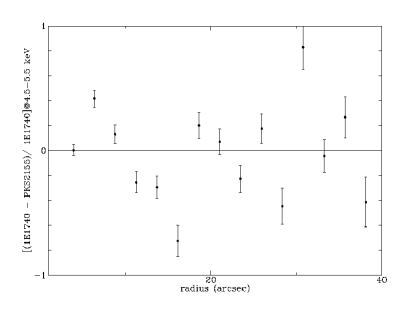
normalised the data sets at a radius of 4 arcsec. In Fig. 5 we
plot the fractional halo intensity, defined as halo/(source+halo), as a
function of angular distance from 1E 1740.7 – 2942. The excess, at a level
30–40 (mean value 32), is detected out to 40 arcsec
from the core, in the lower (2.5-3.5
keV)
energy band. In the higher energy band (4.5-5.5 keV) there is no significant
excess, although the poor statistics means the 3 upper limit is only
30.
Based on Predehl and Schmitt (1995) we would expect a total fractional
halo intensity (i.e. summed over all angles) of at 3 keV and at 5 keV for such a large . However, uncertainties in the angular
and energy dependence of both the pile-up and PSF, as well as in the angular
distribution of scattered photons, do not allow us to easily estimate this
value. We do note however that the apparent weakness of the halo at 5 keV may
suggest that
most of the absorption is made locally at the source. Actually such a
possibility has already been proposed in previous works, where 1E1740.7 – 2942
is supposed to be embedded in dense molecular cloud (Bally & Leventhal
1991; Mirabel et al. 1991; Phillips et al. 1995; Yan & Dalgarno 1997).
If there was
dust scattering emission potentially associated with a local evironment,
Chandra, with
its excellent angular resolution, should in principle be able to detect that,
although it would require a much longer observing time.
Obviously our analysis is biased by several approximations: first of all, the
severe pile-up effects, which make necessary the choice of a normalisation
factor between the source and PSF profiles. In addition, the choice of the PSF
itself, which, being different from the proper calibrated Chandra PSF,
certainly introduces errors due to for instance position dependence, different
background level and so on.
4 Constraining B in the radio lobes
1E 1740.7 – 2942 is associated with an unresolved, flat-spectrum radio core and two extended, optically thin radio lobes (Mirabel et al. 1992; Anantharamaiah et al. 1993). The high-energy electrons present in such lobes are expected to Comptonise the ambient photons and as a result should produce some high-energy X-ray emission. We have inspected our image for X-ray emission associated with the northern lobe (lobe ‘B’), in order to place limits on any Comptonised component. Unfortunately, this lobe partially lies on the gap between the ACIS-I3 and I2 chips; however after calculating the exposure maps we are still able to place a limit on the X-ray flux associated with the lobe. The net count rate in a circular region of radius 8 arcsec centred on lobe B is count/sec. We then ran a PIMMS simulation in order to evaluate the X-ray flux emerging from that region: we used the NH column density obtained from the readout streak spectrum and chose a power law model with a photon index of 1.5, i.e. the typical slope due to single-scattering Comptonisation. In that way we were able to estimate a firm upper limit to the X-ray flux, which turned out to be erg/cm2/sec. Note that at such an angular distance from the core, in fact, the contaminations to the X-ray emission from the PSF and dust scattering halo are far from being negligible; however without a good model we are not able to do any better than this currently. We then evaluated the radio flux between 1 and 6 GHz assuming a spectral index of (using the conventional definition: S), according to Mirabel et al. 1993, and a peak flux density of 0.27 mJy at 5 GHz (Anantharamaiah et al. 1993). In that way we obtained a radio flux of erg/cm2/sec, giving a ratio / 500. This ratio constrains the ratio of photon to magnetic energy densities, , subject to the caveat of our rather limited spectral coverage and assuming isotropic emission in both bands. In the galactic centre region, the photon energy density has been recently estimated to be eV cm-3, i.e. erg cm-3 (Strong, Moskalenko & Reimer 2000); thus our observations roughly constrain the magnetic field in the lobes to Gauss. Given that the equipartition fields associated with the radio jets and lobes of X-ray binaries are typically estimated to be of order mG or more (e.g. Spencer 1996), this is not surprising. Nevertheless, it does provide an entirely independent lower limit on the magnetic field in the lobes.
5 Conclusions
We have performed a detailed analysis of a 10 ksec Chandra ACIS-I observation of the black hole candidate 1E 1740.7 – 2942. The conclusions of this work are as follows:
-
•
We have utilised two approaches to measuring the X-ray spectrum without suffering the effects of pile-up, which are very strong in the core of our image. Using the readout streak, the 2-10 keV spectrum is well fitted by an absorbed power law with and Ncm-2. Using an annulus from 4–30 arcsec, providing more counts but potentially more prone to pile-up effects, we also fit an absorbed power law, with and with . Both results are consistent, as expected, with a black hole low/hard state, and furthermore indicate that the annulus approach does not suffer too badly, if at all, from pile-up.
-
•
We do not confirm the presence of an elongated X-ray feature (about 3 arcsec) reported by Cui et al. 2001. Analysing the same data set, now public, we did not find evidence for any asymmetric X-ray structure within about 4 arcsec from the centre. On larger angular scales there is no obvious asymmetry – in deeper images from our new data – to several arcmin.
-
•
We calculated and compared the surface brightness distributions of 1E 1740.7 – 2942 to those of an unscattered X-ray source in different energy bands. Despite complications due to pile-up effects and uncertain PSF, which lead the comparison between the profiles to be very sensitive to the normalisation factor, we found clear evidence for scattered X-rays in the energy range 2.5-3.5 keV at an angular separation 40 arcsec from the core. At higher energies and/or larger angular separations, the scattering halo is not clearly detectable.
-
•
We provide an upper limit on the ratio between X-ray and radio fluxes in the region which corresponds to the hot spot at the end of the northern radio jet emitted by 1E 1740.7 – 2942, from which we can crudely constrain G.
Even though 1E 1740.7 – 2942 is in principle an ideal candidate for the study of X-ray scattering halos because of its huge column density, which is proportional to the amount of dust grains along the line of sight, such an investigation is complicated by the fact that the source is almost completely absorbed below about 3 keV. Theoretically, the optical depth due to scattering scales as , making the softer, i.e. the absorbed, band more suitable for investigating X-ray halos. This demonstrates that a limit exists to the study of halos which can be perfomed with Chandra for such strongly absorbed sources like 1E 1740.7 – 2942, since the absorbing column is also proportional to the amount of dust scattering. Comparing the halo brightness with X-ray absorption would allow to directly quantify the amount and the density of that molecular clouds; a detailed analysis of the relation between halo and scattering dust properties is however beyond the aim of this paper.
Finally we would like to stress that, in order to correctly compare the radial profile of a source which is supposed to show an X-ray scattering halo or other extended features with that of a point-like source it will be necessary a detailed comparison between simulated and measured PSF wings profiles. However, until a complete calibration of the PSF wings are available, using real observations as a template remains our best option.
Acknowledgments
We would like to thank Michiel van der Klis for useful comments and the anonymous referee for his/her constructive criticism which helped significantly to improve the paper.
References
- [1] Anantharamaiah, K. R., Dwarakanath, K. S., Morris, D., Goss, W. M., Radhakrishnan, V. 1993, ApJ, 410, 110
- [2] Bally, J., Leventhal, M. 1991, Nature, 353, 234
- [3] Bouchet, L., et al. 1991, ApJ, 383, L45
- [4] Churazov, E., Gilfanov, M., & Sunyaev, R., 1996, ApJ, 464, L71
- [5] Cui, W., Schulz, N. S., Baganoff, F. K., Bautz, M.W., Doty, J. P., Garmire, G.P., Mirabel, I. F., Ricker, G. R., Rodriguez, L. F., Taylor, S. C. 2001, ApJ, 548, 394
- [6] Djorgovski, S. G., Thompson, D., Mazzarella, J., & Klemola, A. 1992, IAU Circ. 5596
- [7] Eikenberry, S. S., Fischer, W. J., Egami, E., Djorgovski, S. G. 2001, ApJ, 556, 1, 1
- [8] Garmire, G. P. 1997, BAAS, 190, 34.04
- [9] Jung, G. V., Kurfess, D. J., Johnson, W. N., Kinzer, R. L., Grove, J. E., Strickman, M. S., Purcell, W. R., Grabelsky, D. A., Ulmer, M. P. 1995, A&A, 295, L23
- [10] Liang, E. 1993, in AIP Conf. Proc. 280, Compton Gamma Ray Observatory, ed. M. Friedlander, N. Gehrels, & D. Macomb (New York: AIP), 418
- [11] Liang, E., & Nloan, P. 1984, Space Sci. Rev., 38, 353
- [12] Main, D. S., Smith, D. M., Heindl, W. A., Swank, J., Leventhal, M., Mirabel, I. F. & Rodriguez, L. F. 1999, ApJ, 525, 901
- [13] Marti J., Mirabel, I. F., Chaty, S., Rodriguez, L. F. 2000, A&A, 363, 184
- [14] Mathis, J. S., Lee, C. W., 1991, ApJ, 376, 490
- [15] Mereghetti, S., Caraveo, P., Bignami, G., & Belloni, T. 1992, A&A, 259, 205
- [16] Mirabel, I. F., & Duc, P. A. 1992, IAU Circ. 5655
- [17] Mirabel, I. F., Morris, M., Wink, J., Paul, J., Cordier, B. 1991, A&A, 251, L43
- [18] Mirabel, I. F., Rodriguez, L., Cordier, B., Paul, J., & Lebrun, F. 1992, Nature, 358,215
- [19] Phillips, J. A., Joseph, T., & Lazio, W. 1995, ApJ, 442, L37
- [20] Predehl, P., & Schmitt, J. H. M. M. 1995, A&A, 293, 889
- [21] Predehl, P., Burwitz, V., Paerels, F., Trümper, J. 2000, A&A, 357, L25
- [22] Prince, T., & Skinner, G. K. 1991, IAU Circ. 5252
- [23] Sakano, M., Imanishi, K., Tsujimoto, M., Koyama, K., & Maeda, Y. 1999, ApJ, 520, 316
- [24] Sheth, S., Liang, E., Luo, C., & Murakami, T. 1996, ApJ, 468, 755
- [25] Smith, D. M., Heindl, W. A., Swank, J. H. 2001, American Astronomical Society Meeting, 199, 108.01
- [] Spencer R.E., 1996, In ‘Radio emission from the stars and the sun’, Eds. A.R. Taylor and J.M. Paredes, ASP conf. series vol. 93, p.252
- [] Strong A.W., Moskalenko I.V., Reimer O., 2000, ApJ, 537, 763
- [26] Sunyaev, R., et al. 1991a, in AIP Conf. Proc. 232, gamma Ray Line Astrophysics, ed. P. Durouchoux & N. Prantzos (New York: AIP), 29
- [27] Sunyaev, R., et al. 1991b, ApJ, 383, L49
- [28] Yan, M., Dalgarno, A. 1997, ApJ, 481, 296