Viscous Effects on the Interaction between the Coplanar Decretion Disc and the Neutron Star in Be/X-Ray Binaries
Abstract
We study the viscous effects on the interaction between the coplanar Be-star disc and the neutron star in Be/X-ray binaries, using a three-dimensional, smoothed particle hydrodynamics code. For simplicity, we assume the Be disc to be isothermal at the temperature of half the stellar effective temperature. In order to mimic the gas ejection process from the Be star, we inject particles with the Keplerian rotation velocity at a radius just outside the star. Both Be star and neutron star are treated as point masses. We find that the Be-star disc is effectively truncated if the Shakura-Sunyaev viscosity parameter , which confirms the previous semi-analytical result. In the truncated disc, the material decreted from the Be star accumulates, so that the disc becomes denser more rapidly than if around an isolated Be star. The resonant truncation of the Be disc results in a significant reduction of the amount of gas captured by the neutron star and a strong dependence of the mass capture rate on the orbital phase. We also find that an eccentric mode is excited in the Be disc through direct driving due to a one-armed bar potential of the binary. The strength of the mode becomes greater in the case of a smaller viscosity. In a high-resolution simulation with , the eccentric mode is found to precess in a prograde sense. The mass capture rate by the neutron star modulates as the mode precesses.
keywords:
accretion, accretion discs – binaries: close – hydrodynamics – instabilities – stars: emission-line, Be – X-rays: stars.1 Introduction
The Be/X-ray binaries represent the largest subclass of high-mass X-ray binaries. About two-thirds of the identified systems fall into this category. These systems consist of a Be star (i.e., a B star with an equatorial disc) and, generally, a neutron star. The orbit is wide (several tens of days several hundred days) and eccentric ().
Most of the Be/X-ray binaries show only transient X-ray activity due to transient accretion of the circumstellar matter of the Be star, while some show persistent X-ray emission. Each Be/X-ray binary exhibits some or all of the following three types of X-ray activity:
-
1.
periodic (Type I) X-ray outbursts, coinciding with periastron passage (),
-
2.
giant (Type II) X-ray outbursts (), which show no clear orbital modulation,
-
3.
persistent low-luminosity X-ray emission ()
(Stella, White & Rosner 1986; see also Negueruela et al. 1998). These features imply a complicated interaction between the Be-star envelope and the neutron star.
A Be star has a two-component extended atmosphere, a polar region and a cool () equatorial disc. The polar region consists of a low-density, fast () outflow emitting UV radiation. The wind structure is well explained by the so-called line-driven wind model, in which the radiative acceleration results from the scattering of the stellar radiation in an ensemble of spectral lines (Castor, Abbott & Klein 1975; Abbott 1982). On the other hand, the equatorial disc, which is geometrically thin and nearly Keplerian, consists of a high-density plasma from which the optical emission lines and the IR excess arise. The radial velocity of the disc is smaller than a few , at least within stellar radii (Hanuschik 1994; Hanuschik 2000; Waters & Marlborough 1994). Although there is no widely accepted model for discs around Be stars, the viscous decretion disc model proposed by Lee, Saio & Osaki (1991) explains many of the observed features and thus seems promising (Porter 1999; see also Okazaki 2001). In this model, the matter supplied from the equatorial surface of the star drifts outwards because of the viscous effect and forms the disc. The basic equations for viscous decretion discs are the same as those for viscous accretion discs, except that the sign of (mass decretion/accretion rate) is opposite. The boundary conditions for decretion discs, however, are different from those for accretion discs. Therefore, the decretion disc has a structure different from that of the accretion disc (Pringle, 1991).
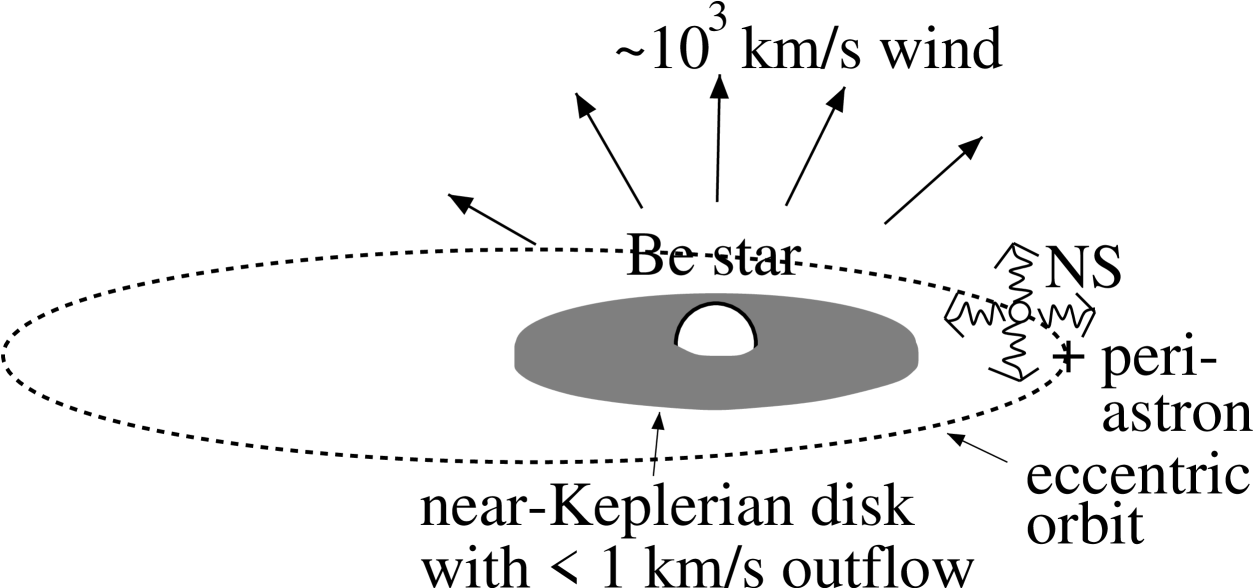
Until quite recently, models for Type I X-ray outbursts in Be/X-ray binaries had assumed a large disc around the Be star so that the neutron star can accrete gas when it passes through the disc near periastron. However, Negueruela & Okazaki (2001) and Okazaki & Negueruela (2001a) recently performed a semi-analytical study based on the viscous decretion disc model for Be stars and showed that the Be disc in Be/X-ray binaries is truncated at a radius smaller than the periastron distance, as long as , where is the Shakura-Sunyaev viscosity parameter (see Fig. 1 for a schematic view of a Be/X-ray binary). The truncation of the disc is due to the resonant torque exerted by the neutron star, which removes the angular momentum from the disc. The disc radii they obtained for seven particular systems (4U 0115+63, V 0332+53, A 0535+262, EXO 2030+375, 2S 1417624, GRO J100857, and 2S 1417624) are consistent with the X-ray behaviour of those systems. Moreover, the result is in agreement with the result of Reig, Fabregat & Coe (1997) that there is a positive correlation between the orbital size and the maximum equivalent width of H ever observed in a system, a measure of the maximum disc size around the Be star in the system.
The truncation of the Be disc in Be/X-ray binaries is not surprising. The resonant interaction is important in various contexts even in a fly-by encounter with a perturber. In fly-by encounters between a disc galaxy and a point mass perturber, the energy is always transported from the disc to the perturber through the resonant interaction, except for overhead encounters where the energy transfer is small (Palmer, 1983). In distant encounters between a circumstellar accretion disc and a perturbing mass with , where and are the periastron distance and disc radius, respectively, the disc material loses energy and angular momentum to the perturber’s orbit through a resonance feature (Hall, Clarke & Pringle, 1996).
In the case of Be/X-ray binaries, the surface density of the Be disc is expected to increase more rapidly than that for isolated Be stars, as a consequence of truncation. This qualitatively agrees with the result found by Zamanov et al. (2001) that the Be discs in Be/X-ray binaries are about twice as dense as those around isolated Be stars. The disc may finally become optically thick, and become unstable to radiation-driven warping (Pringle 1996; see also Porter 1998). Multi-wavelength, long-term monitoring observations of V635 Cas, the optical counterpart of 4U 0115+63, revealed that the Be disc in 4U 0115+63 undergoes a quasi-cyclic () dynamical evolution (Negueruela et al., 2001): after each disc-loss episode, the disc starts reforming, grows until it becomes unstable to warping, and after that a Type II outburst occurs. Although a direct link between the warped disc and the Type II outburst is still missing, the dynamical evolution of the Be disc is likely to be the agent that controls the X-ray behaviour of the system.
This way, the truncated disc model, at least qualitatively, explains many of the observed features of Be/X-ray binaries. The semi-analytical model adopted by Negueruela & Okazaki (2001) and Okazaki & Negueruela (2001a), however, only compares the resonant torque integrated over the whole orbit with the viscous torque to determine at which radius the disc is truncated. Hence, it cannot make a quantitative prediction about how perfect or imperfect the truncation is. Moreover, it predicts nothing about phase-dependent features, such as the disc deformation and the change in the mass capture rate.
Therefore, in order to study the efficiency of the resonant truncation and the orbital-phase dependence of the interaction, we simulate the interaction between the Be-star disc and the neutron star in Be/X-ray binaries, using a 3D SPH code. In a general context, such simulations will also enable us to study the interaction between the viscous disc and the companion in an eccentric orbit. In this paper, which is the first of a series of papers dedicated to understanding the interaction between the Be disc and the neutron star, we study the effects of viscosity on disc truncation in a coplanar system.
2 Calculations
2.1 SPH Code
Simulations presented here were performed with a three-dimensional, smoothed particle hydrodynamics (SPH) code. The SPH code is based on a version originally developed by Benz (Benz 1990; Benz et al. 1990). The smoothing length is variable in time and space. The code uses a tree structure to calculate the nearest neighbours of particles. The SPH equations with the standard cubic spline kernel are integrated using a second-order Runge-Kutta-Fehlberg integrator with individual time steps for each particle (Bate, Bonnell & Price, 1995), which results in an enormous computational saving when a large range of dynamical time-scales are involved.
In our code, the Be disc is modelled by an ensemble of gas particles, each of which has a negligible mass chosen to be with a variable smoothing length. For simplicity, the gas particles are assumed to be isothermal at the temperature of , where is the effective temperature of the Be star. On the other hand, the Be star and the neutron star are modelled by two sink particles (Bate et al., 1995) with corresponding masses. Gas particles which fall within a specified accretion radius are accreted by the sink particle. We assume that the Be star has the accretion radius of , being the radius of the Be star. For the neutron star, we adopt a variable accretion radius of , where is the Roche-lobe radius for a circular binary. This is because having a small accretion radius is time-consuming and it is unphysical to adopt an accretion radius smaller than the smoothing length of the particles near the disc outer radius. An approximate formula for is given by
| (1) |
(e.g., Warner 1995) with the mass ratio , where and are the masses of neutron star and Be star, respectively, and the distance between the stars, .
The SPH artificial viscosity, , between particles and enters the momentum equation as
| (2) |
where is the velocity, is the mass, is the pressure, is the density, is the standard cubic spline kernel, is the distance between particles and , is the mean of the smoothing lengths of particles and , and has the following standard form,
| (3) |
(Monaghan & Gingold, 1983), where and are the linear and nonlinear artificial viscosity parameters, respectively, , , is the isothermal sound speed, and with .
In the continuum limit, the viscous force in the above SPH formalism is written as
| (4) |
(Meglicki, Wickramasinghe & Bicknell, 1993), where
| (5) |
in the 3D SPH code with the cubic spline kernel and
| (6) |
is the deformation tensor. If we assume that the density varies on a length-scale much longer than the velocity, we have
| (7) |
This implies that the shear viscosity and the bulk viscosity are given by
| (8) |
and
| (9) |
respectively, in the continuum limit of the 3D SPH formalism. On the other hand, in the Shakura-Sunyaev viscosity prescription, the shear viscosity is written as
| (10) |
where is the scale-height of the disc. From equations (8) and (10), we have the relation between the SPH artificial viscosity parameter and the Shakura-Sunyaev viscosity parameter as
| (11) |
if we assume that . In general flows, however, . Moreover, the viscosity is artificially turned off for divergent flows in our model [see equation (3)]. Therefore, equation (11) should be taken as a rough approximation to the relation between and .
In several simulations we report in this paper, we adopted and , in which case is variable in time and space. In the other simulations, however, we adopted constant values of in order to roughly model the disc. In these simulations, was variable in time and space and .
The mass ejection mechanism from the Be star is not known. In our simulations, it is modelled by injecting gas particles at . In our normal resolution simulations, which finally have particles, we take , while in a high-resolution simulation we performed with , which finally has about particles, we take . These values were adopted so that , where is a typical smoothing length near the stellar surface. In order to avoid an additional complexity, we kept the injection rate constant in each simulation. Once injected, gas particles interact with each other. As a result, most of the injected particles fall onto the Be star by losing the angular momentum and a small fraction of particles drift outwards, getting the angular momentum from the other particles.
As the Be star, we take a B0V star with , , and , which has the typical spectral type of Be/X-ray binaries. With these parameters, the disc scale-height is at and increases as . For the neutron star, we take and .
2.2 Initial Configuration
We set the binary orbit on the - plane with the major axis along the -axis. At , the neutron star is at apastron. It orbits about the Be star primary with the orbital period and the eccentricity . The angle of misalignment, , between the binary orbital plane and the Be disc plane is set to 0 in this paper. The unit of time is , unless noted otherwise.
Each simulation is very time-consuming. It takes three to four weeks to perform each of the normal-resolution simulations, which runs on a single processor of an HP Exemplar V2500, and about four months to perform the high-resolution simulation, which runs efficiently on eight processors of an SGI Origin 3800. This is particularly so for long-period systems. Thus, in this paper, we present results for only a restricted range of parameter space as the first step in the study of the interaction between the Be disc and the neutron star. We fix the orbital period , the orbital eccentricity , and the misalignment angle , allowing only the viscosity parameter to vary. We adopt and , targeting 4U 0115+63, one of the best studied Be/X-ray binaries. Then, the semi-major axis and given by equation (1) ranges between at periastron and at apastron.
2.3 Testing the Code: Discs around Isolated Be Stars
Before attempting the binary simulations, we applied the code to an isolated Be star in order to test whether it gives reliable results compared to those obtained by using a one-dimensional diffusion-type equation for the surface density.
2.3.1 One-Dimensional Model
As mentioned above, we adopt the viscous decretion disc model, which yields a geometrically thin, nearly Keplerian disc around the Be star. For simplicity, we assume that the disc around an isolated Be star is axisymmetric and Keplerian and in hydrostatic equilibrium in the vertical (-) direction. The evolution of such a disc is described by
| (12) |
with
| (13) |
(e.g., Pringle 1981), where is the surface density, is the radial velocity, and is the angular frequency of disc rotation.
In order to create a situation similar to that in SPH simulations, we inject mass at a constant rate at . At the inner boundary , we adopt the torque-free boundary condition, . We also take as the outer boundary condition at , which affects the disc structure only in a region near .

The evolution of for and for the initial three years is shown by dashed lines ( 1 yr, 2 yr and 3 yr from left) in the left panels of Figs. 2 and 3, respectively. The surface density is measured in units of , where is the highest local density at yr normalised by , a typical value for Be stars (Waters et al., 1988). It should be noted that, in this framework, no steady solution is present for decretion discs unlike for accretion discs (Pringle, 1991). Instead, the formal solution of equation (12) with and gives the disc structure at , which is given by in our isothermal disc model.
2.3.2 3D SPH Simulations
Using the model described in 2.1, we performed two 3D SPH simulations of the disc evolution around an isolated Be star with and . In these simulations, is variable in time and space and to keep constant, as described in the previous section.

Figs. 2 and 3 show the surface density evolution (left) and the disc structure at yr (right) for and , respectively. The time interval between adjacent contours in the left panel is 1 yr. In the right panel, the solid, the dashed, and the dash-dotted lines denote the surface density, the azimuthal velocity normalised by the stellar critical velocity, and the radial Mach number, respectively. In the figures, the density is integrated vertically and averaged azimuthally, while the velocity components are averaged vertically and azimuthally. The dotted line shows the vertically and azimuthally averaged distribution of required to keep constant.
From Figs. 2 and 3, we observe that our 3D SPH code is capable of producing the disc evolution similar to that in the 1D model, except that for small viscosity the disc evolves a bit faster than in the 1D model. The disc structure is almost Keplerian and the radial velocity, which decreases with time, is very subsonic for at yr. These features are in agreement with the observed characteristics of Be stars.
For the purpose of comparison, we present in Fig. 4 the result from a simulation with and . In this simulation, is variable in time and space and is roughly proportional to . In the initial phase of disc formation, the density distribution has a very steep slope in the radial direction, so that stays high except for a region near the injection radius. As time goes on, in the outer region decreases, because of the increase in the density there. As a result, has a local maximum near the star, which, in turn, causes a dip in the density distribution, the feature not seen in simulations with constant .
Fig. 4 also shows that the disc structure outside the dip () is, in a rough sense, similar to that in simulations with constant . Since our purpose is to study the interaction between the Be disc and the neutron star in a system, of which the periastron distance is , the difference in the disc structure close to the star does not matter very much. In the following sections, we will see that both kinds of models give similar results.

In our model, in which the mass injection rate is kept constant, the net mass-loss rate from the star through the disc decreases as the disc mass increases. This is because a larger fraction of injected particles must lose the angular momentum and fall back to the star to support a larger disc. Fig. 5 gives the change in the mass-loss rate from the star, , (thin line) measured at and the disc mass (thick line) for the simulations shown in Figs. 2 and 3. To reduce the fluctuation noise, is averaged over days. As expected, a larger viscosity makes the decrease in faster. From the figure, we note that, for the first several years, several for a wide range of the viscosity parameter.
It is interesting to compare the model mass-loss rate with the observed one. The observed equatorial mass-loss rate is, however, a poorly determined quantity. It has been measured only during the disc-formation phase for several stars. Among them, X Per is the only one star for which both the equatorial mass-loss rate and the highest disc density are known. Telting et al. (1998) studied the long-term behaviour of the Be disc of X Per (4U 0352+30), a Be/X-ray binary system with and , and found that the equatorial mass-loss rate for a disc build-up phase of less than 230 d was greater than and that for the following 380 d was . They also found that the base density of the Be disc of X Per was as high as . It should be noted that the model mass-loss rate shown in Fig. 5 is in good agreement with the observed equatorial mass-loss rate of X Per.


The simulations shown above assume a continuous mass supply from the Be star for studying the formation and evolution of a persistent disc. Some Be stars exhibit a transient disc formation by an episodic mass loss. Such a situation was investigated by Kroll & Hanuschik (1997). They studied the evolution of the gas explosively ejected from a Be star to model the transient disc formation and disc decay, using a 3D SPH code. They found that the gaseous particles form a nearly Keplerian disc in the viscous time-scale. Because of the difference between the boundary conditions adopted in this paper and by Kroll & Hanuschik (1997), the structure of our persistent disc is different from that of the decaying disc studied by Kroll & Hanuschik (1997).
3 Be Disc-Neutron Star Interaction in a Coplanar System
In the previous section, we have seen that our model with a 3D SPH code is capable of reproducing the results from 1D simulations of formation and evolution of the disc around isolated Be stars and explaining the observed equatorial mass-loss rate from the Be star. In this section, we apply our model to a Be/X-ray binary with and , assuming coplanarity between the Be disc and the binary. The semi-major axis of the binary, , is (). We have run simulations with for (), by which time the disc almost reaches an equilibrium state, while we have run the other simulations for (). In all simulations but one, the number of SPH particles at the end of the simulation was about . In order to confirm the reliability of the results obtained by those simulations, we performed a simulation with with a higher resolution, in which the number of SPH particles at the end of the simulation was about .
| Viscosity parameters | Run time | Eccentric mode | ||||||||
|---|---|---|---|---|---|---|---|---|---|---|
| () | initial | final | () | () | () | () | ||||
| 1 | var | 0 | 30 | 100 | 16227 | 0.39 | — | |||
| 0.3 | var | 0 | 50 | 100 | 20820 | 0.38 | — | |||
| var | 1 | 2 | 50 | 600 | 19661 | 0.37 | — | |||
| 0.1 | var | 0 | 50 | 100 | 19232 | 0.37 | — | |||
| 0.1 | var | 0 | 47 | 1000 | 140108 | 0.36 | ||||
3.1 Disc Evolution under the Influence of the Neutron Star
Artymowicz & Lubow (1994) investigated the tidal/resonant truncation of circumstellar and circumbinary discs in eccentric binaries and found that a gap is always formed between the disc and the binary orbit. Following their formulation, Negueruela & Okazaki (2001) and Okazaki & Negueruela (2001a) showed that the Be disc in Be/X-ray binaries is truncated via the resonant interaction with the neutron star as long as . In the following, we investigate the resonant interaction between the Be disc and the neutron star in more detail, by analysing the results from 3D SPH simulations. Table 1 lists some characteristic quantities from these simulations, which will be discussed below.
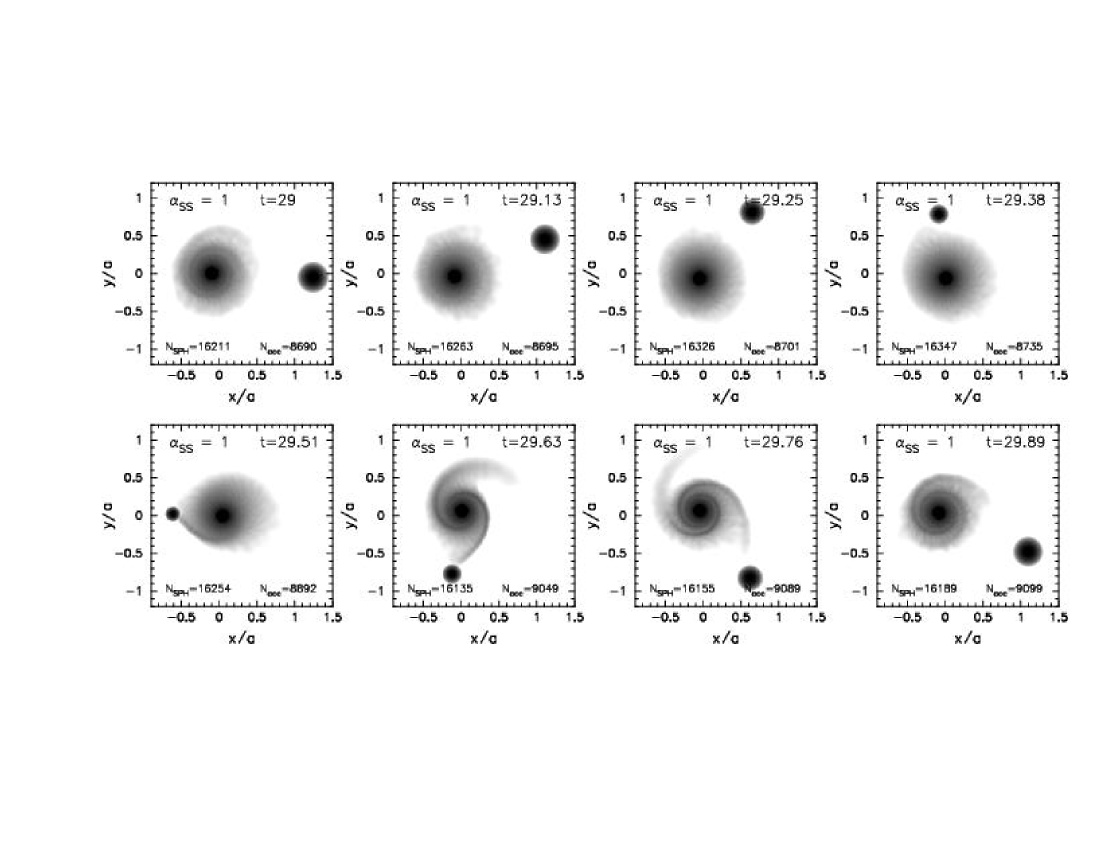
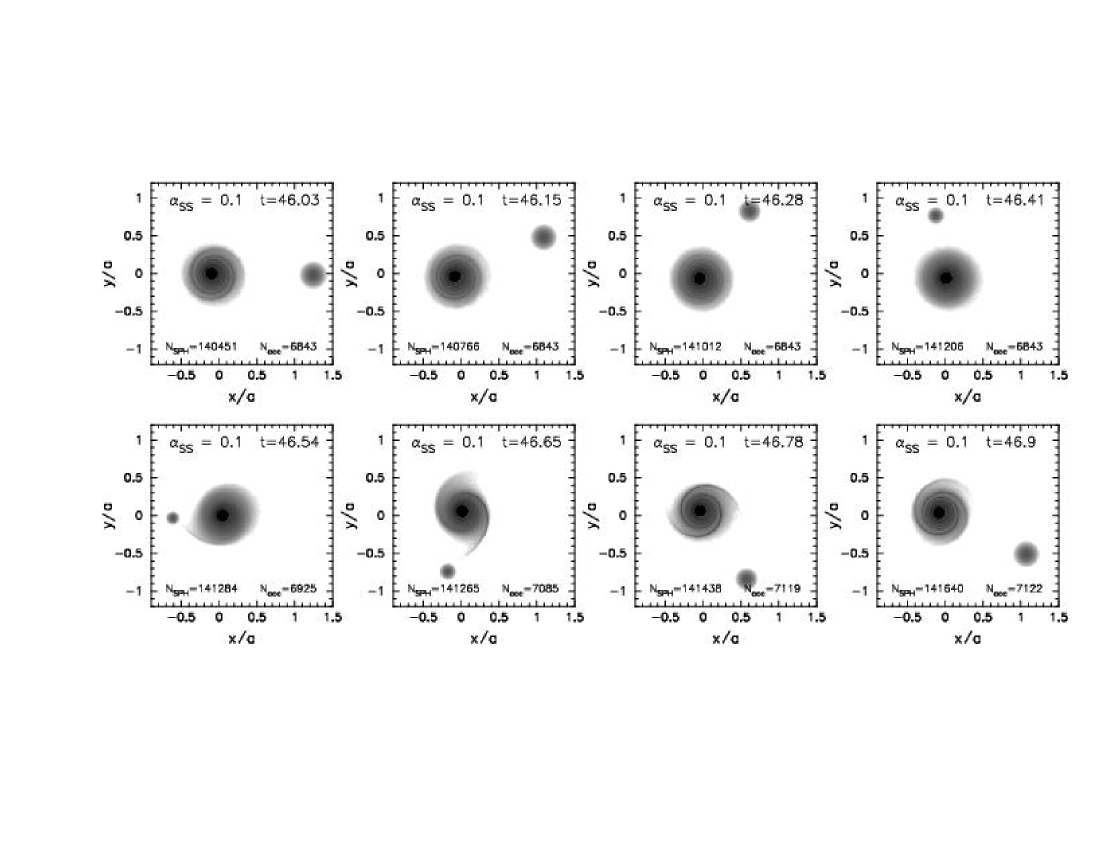
Figs. 6 and 7 show the disc evolution under the influence of the neutron star for and , respectively. The truncation of the disc is obviously more evident for than for . From Fig. 7, we clearly see how the resonant torque works on a viscous decretion disc. When the disc size is small ( for ), the disc evolution is almost identical to that around an isolated Be star. As the disc grows, however, the effect of the resonant torque from the neutron star becomes apparent and the radial density distribution begins to have a break at a radius around the 4:1 to 5:1 resonance radii (for ). We call this radius the truncation radius. Since the resonant torque prevents disc material from drifting outwards, the disc density increases more rapidly than in discs around isolated Be stars. Outside the truncation radius, the density decreases rapidly. The wavy patterns seen in the surface density distribution in the left panel and in the radial velocity distribution in the right panel of Fig. 7 are due to the tightly wound spiral density wave excited in the disc.


In contrast to the low-viscosity simulation shown in Fig.7, the resonant torque has little effect on the disc structure when the viscosity is very high. As seen in the left panel of Fig.6, there is an only very modest break in the surface density distribution for . In this simulation, the disc almost reaches an equilibrium state at () in the sense that the disc structure varies regularly, depending on the orbital phase.
We also performed a simulation with . The disc structure obtained is something between those with and . There is a clear break and a wavy feature in the radial surface-density distribution but they are not so strong as those for .
For comparison, we present in Fig. 8 the result from a simulation with and , in which is variable in time and space. From Fig. 8, we observe that the disc with constant artificial viscosity parameters evolves in a similar way to that of the -disc with a similar viscosity parameter, except for the presence of the dip in the density distribution close to the star, as was expected from the previous section.

In order to study the interaction between the Be disc and the neutron star in more detail, we performed a high-resolution simulation with . In this simulation, the number of SPH particles is about an order of magnitude larger than, and so the smoothing length is on average less than a half of, that of other simulations. Fig. 9 shows the surface density evolution for and the disc structure at in this high-resolution simulation (unfortunately, the allocated computing time ran out at ). From Fig. 9, we easily see more detailed disc structure than that in the corresponding simulation with a lower resolution shown in Fig. 7. The wavy pattern in the surface density distribution caused by the spiral density wave is more remarkable in the high-resolution simulation. This is because a larger number of particles give a higher resolution of the interacting region, which makes the interaction more localised and stronger. Although the surface density profile has breaks near the 5:1 resonance radius () and the 4:1 radius (), the steep density decrease already begins at a much smaller radius, which coincides with the outermost density peak of the spiral wave.

In the rest of this paper, we mainly present the results from this high-resolution simulation as the representative ones with , because it gives a better understanding of the star-disc interaction.
3.2 Phase-Dependent Disc Structure
Most Be/X-ray binaries with known orbital parameters have orbital eccentricities in the range from 0.3 to 0.9. In such systems, the star-disc interaction is likely to be strongly phase-dependent. In this subsection, we discuss phase-dependent features except for the mass capture rate by the neutron star, which will be discussed separately.
Figs.10 and 11 give snapshots covering one orbital period for and , respectively. Each panel shows the surface density in a range of about two orders of magnitude in the logarithmic scale. From these figures, we note a remarkable difference in the disc structure between and . For , the disc has a significant density up to the periastron distance and experiences a strong interaction at and after the periastron passage of the neutron star.
On the other hand, for , the resonant torque from the neutron star is much more effective at truncating the disc than for the high viscosity disc. The sharp decline in the disc density outside the 5:1 resonance causes a gap between this radius and the periastron distance, apparently reducing the mass capture rate by the neutron star, as will be seen in Section 3.4.
In both cases, the spiral density waves are clearly seen between the periastron passage and the apastron passage. The opening angle of the spirals, which is related to the effective gravity in the disc, is smaller for a larger binary separation.
Through the resonant interaction, the angular momentum is transported from the disc to the binary. We have to admit that the effect of the angular momentum transport on the binary turned out to be much stronger than we had expected. Despite the fact that the mass of each particle is only so that the disc mass is only about in our simulations, the increase in the binary orbital period is visible in the late stage of simulations. The computed phase lags behind the correct orbital phase by at in the simulation with and by and at in the high and normal resolution simulations with , respectively. In the following, figures should be read taking this phase shift into account.
In order to have a measure of the disc radius, i.e., the radius at which the disc density has a major break, we applied a non-linear least-square fitting method to the radial distribution of the azimuthally-averaged surface density , adopting the following simple fitting function,
| (14) |
where and are constants and is the disc radius.
Fig. 12 shows the phase dependence of the disc radius (thick line) in the simulations shown in Figs.10 and 11. To reduce the fluctuation noise, we folded the data on the orbital period over for and for . In the figure, the horizontal solid lines denote some of the lowest resonance radii (the 2:1, the 3:1, , the 10:1 from top), while the thin sinusoidal line denotes the orbit of the neutron star. The origin of the phase is at the periastron passage of the neutron star.
From Fig. 12, we note that the disc radius coincides with the 4:1 resonance radius () for , whereas the disc has a radius intermediate between the 4:1 radius and the 5:1 radius () for (the mean is for and for ). The latter is a typical feature expected for a disc in which the wave damps locally (Artymowicz & Lubow, 1994).
We also note that the disc radius modulates around the mean value. The disc shrinks after the periastron passage of the neutron star, which gives a negative torque to the disc. After that it restores its radius by viscous diffusion, so that the amplitude of the modulation is larger for than for .


Since the disc structure depends on the binary phase, the disc emission is expected to exhibit an orbital modulation as well. To see whether this is the case, we calculated the continuum flux from the Be disc for , assuming that the disc is optically thin and the emissivity is proportional to , where is the local density. For simplicity, we ignored the effect of the obscuration of the disc by the star, which will become important for systems with high inclination angles. We then obtained a base flux curve by performing the cubic-spline fitting of the fluxes at apastron passages. The base flux describes the long-term change in the continuum flux. Finally, we computed the orbital modulation by subtracting the base flux from the instantaneous fluxes.
Fig. 13 shows the orbital modulation in the optically thin continuum from the Be disc for (left) and (right). For , the modulation is more clearly seen in the high-resolution simulation (thick line) than in the normal one (thin line). In order to reduce the fluctuation noise, we folded the data on the orbital period over the period annotated in the panel. Contrary to what is expected from Fig.12, the continuum exhibits little modulation for , and about one per cent of modulation is seen for . The negative result for suggests that the strongly-perturbed outer disc contributes little to the optically thin emission, because of its low density. On the other hand, the positive result for , in particular in the high-resolution simulation, though the amplitude is still very small, seems to come from the region where the density is enhanced by the spiral wave, because the disc radius does not change significantly and the rise and the subsequent decline of disc emission are in phase with the density enhancement and the subsequent damping caused by the spiral density wave. The difference between the modulation patterns from the high and normal resolution simulations with suggests that resolving the spiral density wave is important to obtain a reliable modulation pattern of such low amplitude.


Although Fig. 13 gives little observability of the orbital modulation in optically thin disc emission, it is still likely that optically thick emission, such as Balmer lines, will show significant orbital modulation. Calculating the optically thick emission from the disc is, however, beyond the scope of this paper.
3.3 Excitation of the Eccentric Mode
In a circumbinary disc around an eccentric binary, an eccentric mode is excited through direct driving due to a one-armed bar potential (Artymowicz & Lubow, 1996a). In this subsection, we study whether the same mechanism works in Be/X-ray binaries. We analyse the evolution of the eccentricity in the Be disc by decomposing the surface density distribution into Fourier components which vary as , where and are the azimuthal and time-harmonic numbers, respectively, and is the frequency of mean binary rotation.
Following Lubow (1991), we define the mode strength by
| (15) | |||||
where and are either or functions. The surface density here is computed by summing up functions at particle positions, not by taking the kernel into account as has been done in the previous sections. Then, the total strength of the mode is defined by
| (16) | |||||
Fig. 14 shows the excitation and precession of the (1,0) mode (i.e., the eccentric mode) for . The upper panel shows the strengths of several modes, while the lower panel shows the evolution of the angle between the eccentric vector of the disc and that of the binary orbit defined by
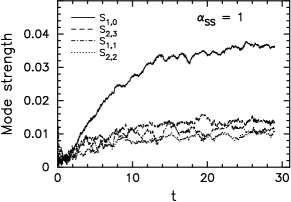
| (17) |
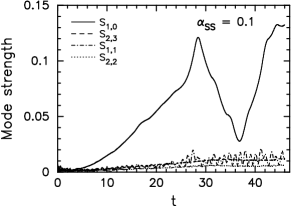
The eccentric mode grows initially linearly in time (), as is predicted by the theory and was also found by Lubow & Artymowicz (2000). At the strength of the eccentric mode is saturated at . As it is saturated, the mode stops precessing and is locked at .

In order to study the structure of the eccentric mode in more detail, we analyse the orbits of individual particles. The position and velocity of each particle are instantaneously equal to those of an elliptical Keplerian orbit of semi-latus rectum and the eccentric vector with the amplitude and the longitude of periastron, , with respect to the stellar periastron (e.g., Ogilvie 2001). The radial coordinate is then given by
| (18) |
Given , in our simulations.
The upper panels of Fig. 15 present the distribution of the orbital parameters of disc particles for at . From the left panel, we note that the disc eccentricity increases almost linearly in for and is roughly constant for . The right panel for the radial dependence of the longitude of periastron shows that the eccentric mode is twisted in a trailing sense.
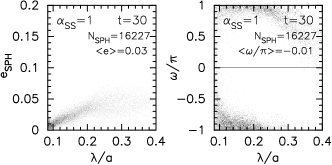
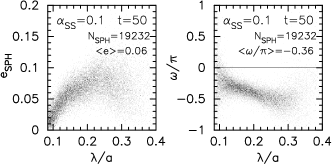
The normal-resolution simulation with showed a similar trend. The eccentric mode grew initially linearly in time (). The mode strength was almost saturated at at . The mode also stopped precessing and was locked at .
The distribution of the orbital parameters of disc particles at from this simulation is presented in the lower panels of Fig. 15. From the left panel, we note that the eccentricity has a maximum at . The right panel shows that the eccentric mode is twisted in a trailing sense, as in the case for .
Recently, Ogilvie (2001) has developed a non-linear theory of the evolution of the shape and surface density of a three-dimensional eccentric accretion disc. When the eccentricity of the disc is small so that terms of relative order may be neglected, this theory provides a linear evolutionary equation for the complex eccentricity of the disc. We have reworked this theory for the case of a strictly isothermal decretion disc with no radial velocity, and also evaluated the tidal forcing terms associated with a companion object of small eccentricity. The governing equation is then of the form
| (19) | ||||||
where and are the (constant) eccentricity and semi-latus rectum of the binary orbit, is the Laplace coefficient of celestial mechanics, and . The dimensionless coefficients and are given by
| (20) |
where are dimensionless complex constants that depend only on the shear and bulk viscosity parameters and . In the limit these coefficients become purely imaginary and give rise to precession induced by the pressure of the disc. Most importantly, the real part of , which has the role of a diffusion coefficient for short-wavelength eccentric perturbations, turns out to be positive when , as is true in the SPH simulations [see equation (9)]. If this condition were not satisfied, the disc would experience a local eccentric instability and equation (19) could not be evolved forward in time.
Equation (19) has the character of a dispersive and diffusive linear wave equation for . The eccentricity of the binary provides a tidal forcing that is independent of time. Starting from an initially circular state , the eccentricity of the disc first grows linearly in time and then approaches a steady state. The steady eccentric shape can be determined either by solving the time-dependent problem until the transient response decays, or by solving the second-order ordinary differential equation obtained by setting the time-derivative to zero. We have performed both of these calculations, adopting the boundary condition at the stellar surface, a ‘stress-free’ boundary condition at a notional outer edge (), and a surface density distribution .
The steady configurations of and for the cases and are illustrated in Fig. 16. One should not expect a perfect agreement with the SPH simulations because the theory is based on the assumption of small eccentricities and only approximates the actual surface density distribution. However, the steady eccentric shapes based on linear theory offer a fair explanation of the results of the SPH simulations, especially for the high-viscosity case.


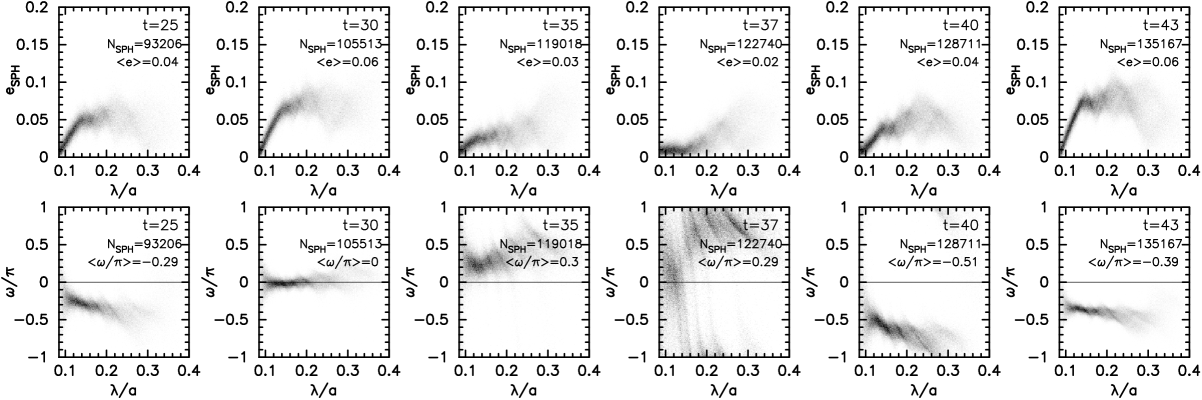
Fig. 17 shows the evolution of an eccentric mode from the high-resolution simulation with . The detailed structure of the mode is shown in Fig. 18 by snapshots covering one precessional period. From these figures, we note that the evolution and the structure of the eccentric mode are very similar to those from the corresponding normal resolution simulation until . At , the eccentric mode suddenly begins to precess in a prograde sense, as seen in the lower panel of Fig.17. As increases from to , the mode strength increases. The mode stagnates at for around , suggesting that the eccentric disc at is an unstable configuration. The precession decelerates before reaching and accelerates after that. At the same time, the mode changes its shape. As seen in the lower panel of Fig. 18, the eccentric mode is twisted in a trailing sense for and in a leading sense after that. At , apsidal axes of all particle orbits align.
As seen in Fig. 18, the twist of the mode increases, as the apsidal axis of the disc moves toward the stellar periastron (). The strong radial dependence of the phase caused by the twist reduces the eccentricity of the disc, as shown in the upper panel of Fig. 17. The precession is fastest at , suggesting that there is a stable point at . After that, the mode becomes trailing and its strength increases. The precessional period is about .
It is important to note that a similar behaviour is found in circumbinary discs around eccentric binaries. According to Lubow & Artymowicz (2000), this behaviour occurs as follows: When the eccentricity of the disc edge is small, is locked at a stable value . However, as the eccentricity grows, the locking action weakens, and the prograde precession due to the quadrupole moment of the binary potential dominates. The disc edge begins to precess when its eccentricity becomes , and afterwards the eccentricity oscillates with a precessional period. The disc typically attains the eccentricity of .
We note that the above behaviour of the eccentric mode in circumbinary discs around eccentric binaries is strikingly similar to that shown in Fig. 17, except that, in our simulation for Be/X-ray binaries, the growth and precessional time-scales of the eccentric mode are much shorter and the disc eccentricity attained is significantly smaller than in circumbinary discs.

3.4 Mass Capture Rate by the Neutron Star
As mentioned in Section 1, most of the Be/X-ray binaries show transient X-ray activities. Among them, some exhibit periodical X-ray outbursts called Type I, which coincide with the periastron passage, while the others show occasional giant X-ray outbursts called Type II and little or no detectable X-ray emission in quiescent phase. 4U 0115+63, the system we are modelling in this paper, belongs to the latter group. In this subsection, we first study how much mass is captured by the neutron star in a general context, and then discuss whether our model predicts the mass capture rate consistent with the observed X-ray behaviour of 4U 0115+63.
Fig. 19 shows the change in the mass capture rate by the neutron star, , and the disc mass for . The upper panel shows the evolution of and , while the lower panel shows the orbital-phase dependence of . In the lower panel, we folded on the orbital period over to reduce the fluctuation noise. The horizontal dashed line and dash-dotted line denote the mean mass capture rate by the neutron star and the mean mass-loss rate from the Be star, respectively.
We have already seen that there is little truncation of the Be disc for . Fig. 19 confirms this. For the Be disc is almost in equilibrium in the sense that the disc mass and the mass capture rate only shows regular orbital modulations with constant amplitude. For , the mean mass-loss rate from the Be star is , while the mean mass capture rate for the same period is . Thus, in this high viscosity disc, the neutron star captures the disc mass at about the same rate as the mass-loss rate from the Be star.

The simulation with also gives a high fraction (about 60 per cent for ) of mass capture rate with respect to the mass-loss rate, as listed in Table 1. This indicates that the resonant truncation effect is not effective for , either.
In contrast to the simulations with and , the high-resolution simulation with revealed a subtle feature in the mass capture rate, as shown in Fig. 20. Before the precession of the eccentric mode began, the mass capture rate increased monotonically: before with the resolution of this simulation. Then, the peak mass capture rate showed a gradual increase to a level at at .
After the eccentric mode began to precess, exhibited a long-term modulation, depending on the longitude of the eccentric mode, . It gradually increased as increased from 0 to and decreased as increased from to . At the periastron passage at , was a maximum of , which was about a factor of three higher than the level before precession. The eccentricity of the disc was at and at . It should be noted that even this small eccentricity caused a factor of three enhancement in the mass capture rate. If the disc had a much stronger disturbance, the enhancement in is likely to be much larger.
In addition to the long-term modulation due to the precession of the eccentric mode, we note that the mass capture rate by the neutron star is much smaller and more strongly phase-dependent for than for . For , the phase at which the neutron star captures the disc mass most slightly lags behind the periastron passage, because of the presence of a gap between the disc outer radius and the periastron. In the high resolution simulation, the peak mass capture rate for is , which is one order of magnitude smaller than that for . The mass capture rate then decreases by two orders of magnitude by the apastron passage. Even in the normal resolution simulation, in which the disc density around the truncation radius is significantly higher than that in the high-resolution simulation, the peak mass capture rate is about a factor of three smaller than that for , and decreases by a factor of fifty by apastron. Note that similar, strongly phase-dependent accretion was found in simulations by Artymowicz & Lubow (1996b) for circumbinary discs around eccentric binaries.
In the high-resolution simulation with , the neutron star, on average, captures the disc mass at the rate of for , while the mean mass-loss rate from the Be star for the same period is . This indicates that, even after three years of disc growth, about 6/7 of the gas lost from the star still accumulates in the disc, making the disc continually denser.

The transient nature in the X-ray activity of Be/X-ray binaries is considered to result from the interactions between the accreted material and the rotating magnetised neutron star (Stella et al., 1986). If the accreted material is dense enough to make the magnetospheric radius smaller than the corotation radius, the accretion onto the neutron star causes a bright X-ray emission (the direct accretion regime). Otherwise, the magnetospheric radius is larger than the corotation radius, and the accretion onto the neutron star is prevented by the propeller mechanism. The system is then in quiescence (the propeller regime).
Recently, Campana et al. (2001) found that 4U 0115+63 showed a dramatic X-ray luminosity variation from to in less than 15 hr close to periastron, whereas it showed a nearly constant X-ray luminosity at a level of near apastron. They concluded that the system was in the transition regime between the direct accretion regime and the propeller regime close to periastron and in the propeller regime near apastron, because the direct accretion regime and the propeller regime, respectively, apply for and , where is a parameter which depends on the geometry and physics of accretion.
Below we try to compare our simulation results with the above criteria by Campana et al. (2001). Although it is likely that the captured material will form an accretion disc around the neutron star, we do not know how the accretion rate is related to the mass capture rate shown in Figs. 19 and 20, which is based on the moments at which particles enter the variable accretion radius of the neutron star. Therefore, we consider two extreme situations, in which or , where is the accretion time-scale. In the former situation, the accretion rate profile is approximately the same as the profile of mass capture rate, whereas in the latter situation, the variation in the accretion rate will be much smaller than that in the mass capture rate. We assume that the X-ray luminosity is given by with .
For , at periastron if and all the captured mass accretes onto the neutron star. Note that this level of luminosity enters the direct accretion regime. Since 4U 0115+63 is considered to be in the direct accretion regime only in occasional giant X-ray outbursts, we conclude that the model is inconsistent with the observation if . If , the neutron star will emit the X-ray luminosity corresponding to the mean mass capture rate of (see the bottom panel of Fig. 19). The X-ray luminosity is then . This level of luminosity enters the transition regime. Hence, the model is not ruled out by the observed constraint if .
We have the same conclusion for the model. Since it gives the mass capture rate about a half of that for , the model is inconsistent with the observation if , but is not ruled out if .
On the other hand, for , at periastron even if and all the captured material accretes onto the neutron star. This suggests that the system is in the transition regime even at periastron. It is likely that the low mass capture rate in this simulation put the system into the propeller regime in most of the orbital phases. Thus, the model for 4U 0115+63 is consistent with the observed X-ray behaviour, irrespective of the accretion time-scale.
4 Summary and Discussion
In this paper, we have presented results from 3D SPH simulations of the disc formation around isolated Be stars and of the interaction between the Be star disc and the neutron star in Be/X-ray binaries, based on the viscous decretion disc model for Be stars (Lee et al., 1991). In several simulations we adopted constant values of artificial viscosity parameters and , for which the Shakura-Sunyaev viscosity parameter is variable in time and space. In the other simulations, we adopted constant values of , for which is variable in time and space and . We preferred constant simulations because the analysis of the results becomes easier. In all simulations, the Be disc was nearly Keplerian and the radial velocity was highly subsonic. These features are consistent with those observed for Be discs.
The simulations of isolated Be stars showed that our code is capable of producing results similar to those from the 1D simulations. The simulated mass-loss rate from the Be star in the first several years of disc formation was several for a wide range of viscosity parameter, which is consistent with the observed equatorial mass-loss rate. Here, is the highest local density at yr normalised by , a typical value for Be stars.
In binary simulations, we have studied the effect of viscosity on the star-disc interaction in the case of a coplanar system with and , the parameters for 4U 0115+63, one of the best studied Be/X-ray binaries. We have chosen these orbital parameters because they enable us to compare the simulation results with the observed ones and the short orbital period makes the computing time bearable. Some of the results from these simulations are summarised in Table 1.
Our simulations showed that there is a radius outside which the azimuthally averaged surface density decreases steeply. For a smaller , the slope outside this radius is steeper, giving a stronger truncation effect on the disc. Among the simulations with , 0.3, and 0.1, we found that the resonant truncation of the Be disc is effective only for . For and 0.3, the neutron star captures the disc mass at a rate comparable to the mass-loss rate from the Be star. These results confirm the previous semi-analytical result by Negueruela & Okazaki (2001) and Okazaki & Negueruela (2001a) on disc truncation that the resonant truncation is effective for a disc with . The truncation radius for roughly agrees with that derived semi-analytically.
Our simulations, in particular the high-resolution simulation with , showed how the disc grows under the influence of the neutron star. In the initial build-up phase, the disc evolution is similar to that for isolated Be stars. But, later on, the effect of the resonant torque becomes apparent, preventing the disc gas from drifting outwards at several resonance radii. The effect is most remarkable at the 4:1 and 5:1 radii ( and 0.33, respectively) for . As a result, the disc density increases more rapidly than that for isolated Be stars. This feature is consistent with Zamanov et al. (2001), who found that the discs in Be/X-ray binaries are about twice as dense as those of isolated Be stars.
Since the neutron star orbits in an eccentric orbit about the Be star, the interaction is phase dependent. The disc shrinks a little at periastron and then recovers gradually. Consequently, the disc emission will vary with phase. For our system with , this effect turned out not to be large enough to cause an observable variation in the disc continuum as long as it is optically thin. It is possible, however, that the orbital modulation in the disc continuum in systems with much higher orbital eccentricity is observable. Moreover, it is likely that the profiles of optically thick emission lines from the disc, such as Balmer lines, will show an orbital modulation even in systems with moderate eccentricity, because the disc structure is made non-axisymmetric by the periodic excitation and damping of the spiral density wave.
In the Be disc in Be/X-ray binaries, an eccentric mode is excited through direct driving due to the (1,0) harmonic of the binary potential. In high-viscosity simulations, the mode grows initially linearly in time and then approaches a steady state, of which steady eccentric shapes based on linear theory of the evolution of a 3D eccentric decretion disc described in Section 3.3 offer a fair explanation. The strength of the mode in the steady state is larger for a smaller value of .
On the other hand, in the high-resolution simulation with , the eccentric mode undergoes prograde precession at some point. The precession period is about . The precession rate is not constant. It accelerates for and decelerates for , where is the angle between the eccentric vector of the disc and that of the binary orbit. The precession rate is radius-dependent. It is larger at a larger radius. Since the eccentric mode is leading for and trailing for , the twist of the mode increases with time for and decreases for . The strength of the eccentric mode, which anti-correlates with the twist of the mode, decreases for and increases for .
As the mode precesses, the mass capture rate, , by the neutron star modulates. It is a maximum at . Even for an eccentricity of 0.1, at maximum is about a factor of three higher than the level before precession. If the disc had a much stronger disturbance, the enhancement in is likely to be much larger. Such a system may temporarily show periodic X-ray outbursts.
In our model for Be/X-ray binaries, in which the disc material overflows toward the neutron star via the point, the mass capture rate by the neutron star becomes strongly phase dependent. The dependence is stronger for a smaller value of viscosity. In the disc with , the mass capture rate decreases by two orders of magnitude between periastron and apastron passages, and after apastron passage, no disc mass is captured by the neutron star. Note that our model gives a much stronger contrast in the mass capture rate than that expected for the stellar wind accretion.
We have also compared the simulated mass capture rate with the observed X-ray behaviour of 4U 0115+63, considering two extreme situations, in which or , where is the accretion time-scale. We found that the disc model for gives a result consistent with the observation for both situations, whereas the higher viscosity models for and 0.3 are ruled out unless .
Analysing multi-wavelength long-term monitoring observations of 4U 0115+63, Negueruela et al. (2001) found that the Be star undergoes quasi-cyclic () activity, losing and reforming its circumstellar disc. They also found that, at some point, the growing disc becomes unstable to warping and then tilts and starts precessing. Type II X-ray outbursts take place after the warping episode. As shown in this paper, our model explains many of the observed features of 4U 0115+63 in the phase before the warping occurs. Our simulation, however, showed no dynamical instability, and therefore is incapable of explaining the warping episode. Including the effect of radiation from the Be star may turn out to be essential to have a model that explains the whole cycle of the disc evolution, which is beyond the scope of this paper.
In this paper, we have concentrated our study on the viscous effects on star-disc interaction in a coplanar system with fixed orbital period and eccentricity. This was done not only as a first step to have a comprehensive understanding of the interaction between the Be disc and the neutron star in Be/X-ray binaries, but also to have an archetypal model with which we can compare the results from our future simulations. In the next paper, we will study the effects of the misalignment angles between the Be disc and the binary. We will discuss the effects of the orbital eccentricity in the third paper, and the fourth paper will conclude the series by studying the effects of the orbital period.
acknowledgements
We thank the anonymous referee for constructive comments. ATO acklowledges the Institute of Astronomy, Cambridge, UK for the warm hospitality. The high-resolution simulation reported here was performed using the UK Astrophysical Fluids Facility (UKAFF). The other simulations were done using the facility at the Hokkaido University Computing Center, Japan. This work was supported in part by Grant-in-Aid for Scientific Research (13640244) of Japan Society for the Promotion of Science.
References
- Abbott (1982) Abbott D.C., 1982, ApJ 259, 282
- Artymowicz & Lubow (1994) Artymowicz P., Lubow S.H., 1994, ApJ, 421, 651
- Artymowicz & Lubow (1996a) Artymowicz P., Lubow S.H., 1996a, in Beckwith S., Staude J., Quetz A., Natta A., ed. Disks and Outflows aound Young Stars, Springer, Berlin, p.115
- Artymowicz & Lubow (1996b) Artymowicz P., Lubow S.H., 1996b, ApJ, 467, L77
- Bate et al. (1995) Bate M. R., Bonnell I.A., Price N.M., 1995, MNRAS, 285, 33
- Benz (1990) Benz W., 1990, in Buchler J.R., ed, The Numerical Modelling of Nonlinear Stellar Pulsations. Kluwer, Dordrecht, p.269
- Benz et al. (1990) Benz W., Bowers R.L., Cameron A.G.W., Press W.H., 1990, ApJ, 348, 647
- Campana et al. (2001) Campana S., Gastaldello F., Stella L., Israel, G.L., Colpi M., Pizzolato F., Orlandini M., Dal Fiume D., 2001, ApJ, 561, 924
- Castor et al. (1975) Castor J.I., Abbott D.C., Klein R.I., 1975, ApJ 195, 157
- Hall et al. (1996) Hall S.M., Clarke C.J., Pringle J.E., 1996, MNRAS, 278, 303
- Hanuschik (1994) Hanuschik R.W., 1994, in Balona L.A., Henrichs H., Le Contel J.M., ed. Pulsation, Rotation and Mass Loss of Early-Type Stars, IAU Symp. 162, Kluwer Academic Publishers, Dordrecht, p.265
- Hanuschik (2000) Hanuschik R.W., 2000, in Smith M.A., Henrichs H.F., Fabregat J., ed. Be Phenomenon in Early-Type Stars, IAU Colloq. 185, ASP, San Francisco, p.518
- Kroll & Hanuschik (1997) Kroll P., Hanuschik R.W., 1997, in Wickramasinghe D.T., Bicknell G.V., Ferrario L., ed. Accretion Phenomena and Related Outflows, IAU Colloq. 163, ASP, San Francisco, p.494
- Lee et al. (1991) Lee U., Saio H., Osaki Y., 1991, MNRAS, 250, 432
- Lubow (1991) Lubow S.H., 1991, ApJ, 381, 268
- Lubow & Artymowicz (2000) Lubow S.H., Artymowicz P., 2000, in Mannings V., Boss A.P., Russell S.S., ed. Protostars and Planets IV, Univ. of Arizona Press, p.731
- Meglicki et al. (1993) Meglicki Z., Wickramasinghe D., Bicknell G.V., 1993, MNRAS, 264, 691
- Monaghan & Gingold (1983) Monaghan J.J., Gingold R.A., 1983, J. Comput. Phys., 52, 374
- Negueruela & Okazaki (2001) Negueruela I., Okazaki A.T., 2001, A&A, 369, 108
- Negueruela et al. (1998) Negueruela I., Reig P., Coe M.J., Fabregat J., 1998, A&A, 336, 251
- Negueruela et al. (2001) Negueruela I., Okazaki A.T., Fabregat J., Coe M.J., Munari U., Tomov T., 2001, A&A, 369, 117
- Ogilvie (2001) Ogilvie G.I., 2001, MNRAS, 325, 231
- Okazaki (2001) Okazaki A. T., 2001, PASJ, 53, 119
- Okazaki & Negueruela (2001a) Okazaki A.T., Negueruela I., 2001a, A&A, 377, 161
- Okazaki & Negueruela (2001b) Okazaki A.T., Negueruela I., 2001b, in Giacconi R., Serio S., Stella L., ed. X-Ray Astronomy 2000, ASP Conf. Series, Vol. 234, 2001, ASP, San Francisco, p.281
- Palmer (1983) Palmer P.L., 1983, MNRAS, 204, 507
- Porter (1998) Porter J.M., 1998, A&A ,336, 966
- Porter (1999) Porter J.M., 1999, A&A, 348, 512
- Pringle (1981) Pringle J.E., 1981, ARA&A, 19, 137
- Pringle (1991) Pringle J.E., 1991, MNRAS, 248, 754
- Pringle (1996) Pringle J.E., 1996, MNRAS, 281, 357
- Reig et al. (1997) Reig P., Fabregat J., Coe M.J., 1997, A&A, 322, 193
- Stella et al. (1986) Stella L., White N.E., Rosner R., 1986, ApJ, 208, 669
- Telting et al. (1998) Telting J.H., Waters L.B.F.M., Roche P., Boogert A.C.A., Clark J.S., de Martino D., Persi P., 1998, A&A, 296, 785
- Warner (1995) Warner B., 1995, Cataclysmic Variable Stars. Cambridge University Press, Cambridge
- Waters & Marlborough (1994) Waters L.B.F.M., Marlborough J.M., 1994, in Balona L.A., Henrichs H., Le Contel J.M., ed. Pulsation, Rotation and Mass Loss of Early-Type Stars, IAU Symp. 162, Kluwer Academic Publishers, Dordrecht, p.399
- Waters et al. (1988) Waters L.B.F.M., Taylor A.R., van den Heuvel E.P.J, Habets G.M.H.J, Persi P., 1988, A&A, 198, 200
- Zamanov et al. (2001) Zamanov R.K., Reig P., Mart J., Coe M.J., Fabregat J., Tomov, N.A., Valchev T., 2001, A&A, 367, 884