Structure in the Epsilon Eridani dusty disk caused by mean motion resonances with a 0.3 eccentricity planet at periastron
Abstract
The morphology of the Eridani dust ring is reproduced by a numerical simulation of dust particles captured into the 5:3 and 3:2 exterior mean-motion resonances with a 0.3 eccentricity solar mass planet at periastron at a semi-major axis of 40 AU. The morphology will differ when the planet is at apastron, in about 140 years. Moderate eccentricity planets in outer extra-solar systems will cause observable variations in the morphology of associated dusty rings.
1 Introduction
The Infrared Astronomical Satellite (IRAS) measured far infrared fluxes from the vicinity of main sequence stars (Aumann et al., 1984), including the nearby systems Vega and Formalhaut which are of moderate age, years, at the end of the era when rocky planets are expected to form. Recently, submillimeter wavelength images of stars with infrared excesses have revealed structure in some of these disks. Formalhaut has a dust ring with a central cavity (Holland et al., 1998), Vega, Pictorus and HR 4796A have secondary dust emission peaks and central cavities (Wilner et al., 2002; Holland et al., 1998; Jayawardhana et al., 1998; Koerner et al, 1998), HR 4796A has a ring evident in scattered light from the central star (Schneider et al., 1999), and Eridani has a 60 AU dusty ring with peculiar 4 peaks of emission (Greaves et al., 1998). HR 4796A and Pictorus are younger, at ages of only years, whereas Eridani (HR 1084) is a nearby 0.5-1 Gyr old K2V () star (Soderblom & Dappen, 1989; Song et al., 2000).
Because of the short lifetime of the dust particles in these disks, and the scarcity of gas, the dust must continually be replenished from collisions of larger orbiting bodies, possibly analogous to Kuiper belt objects. Hence the disks in the older systems are commonly called debris disks. Dust particles in our solar system spiral toward the sun due to radiation drag forces, known as Poynting-Robertson (P-R) drag and interactions with the solar wind (Burns et al., 1979). Gravitational perturbations from planets can scatter the particles or capture them into orbital resonances with planets (e.g., Dermott et al. 1994). Since the lifetime of captured particles can greatly exceed the lifetime of particles which are not captured, resonant trapping can sculpt the dusty disk.
Structure predicted in the dust distribution in the Kuiper Belt is primarily a result of resonance trapping (Liou & Zook, 1999; Moro-Martin & Malhotra, 2002). Wilner et al. (2002) suggested that the two peaks seen at 1.3mm in the Vega disk could be explained by the capture of dust particles into the 2:1 exterior mean-motion resonance with a high eccentricity three Jupiter mass giant planet at a semi-major axis of 40AU. Ozernoy et al. (2000) proposed that the morphology of the submillimeter images of the Eridani system could be caused by dust particles trapped in high libration orbits associated with the 3:2 mean motion resonances with a Jupiter mass planet in a circular orbit. While Ozernoy et al. (2000) considered the morphology caused by dust particles carefully placed in individual resonances, here we initially distribute dust particles over a range of semi-major axes and eccentricities and search for stable dust configurations which can account for the four peaks observed in the submillimeter images of the Eridani system.
2 Numerical Integration
We numerically integrate the orbits of dust particles using a conventional Burlisch-Stoer numerical scheme. The forces on the particles are gravity from a central star and one planet and P-R drag from the central star. The motion of the dust particles was restricted to the plane containing the planet and star. The ratio of the force from radiation to that from the gravity of the central star is parametrized with the dimensionless parameter, , which depends primarily on particle size (Burns et al., 1979). Length scales are given in units of the perturbing planet semi-major axis, , and timescales in units such that where is the mass of the central star. The ratio of the planet mass to the stellar mass is denoted as .
Dust particles see a reduced radial force from the central star because radiation pressure opposes gravity. This causes the location of the mean motion resonances with the planet to shift radially by a factor of . However the magnitude of the P-R drag force caused by relativistic effects depends on the ratio of the particle velocity to the speed of light, , times . Because of our choice of units, the speed of light, , is in units of . We have adopted which corresponds to having a stellar mass of and a planet radius of 25AU. Because of the weak dependence of on stellar mass and planetary semi-major axis, our simulations should scale to outer solar systems, such as the Eridani disk, with the caveat that the particle drift rates should be a factor of a few times lower.
With the exception of Wilner et al. (2002), most simulations of dust dynamics in planetary systems have been carried out for low eccentricity systems. As Wilner et al. (2002) found, high eccentricity planets can cause strong azimuthal density contrasts in the distributions of objects trapped in outer resonances such as the 2:1 and 3:1 mean motion resonances. Typically we find that the azimuthal contrasts are lower in the outer resonances than those closer to the planet. Previous simulations have predicted that resonances close to the planet such as the 4:3, 3:2, 5:3, and 7:4 resonances efficiently trap and hold dust particles in Kuiper belt (Liou & Zook, 1999; Moro-Martin & Malhotra, 2002). We restrict our simulations to the region containing these resonances.
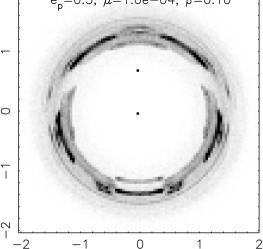
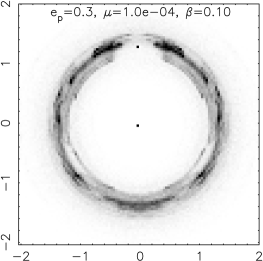
We began the simulations with 300 dust particles distributed randomly in semi-major axis between 1.1 and 1.5 times the planet’s semi-major axis. Longitudes of periastron and mean longitudes were chosen randomly. Dust particle eccentricities were chosen to lie between zero and 0.4. We ran each simulation for planetary orbit periods. The positions of all the particles were recorded every planetary year, consequently the phase of the planet was the same during each output of the integration. We binned the particle positions counting the positions the particles at each output of the simulation. The resulting spatial distributions and semi-major axis distributions are shown in Figure 1 for the planet at periastron and at apastron. All dust particles contributed to the time integrated dust distributions, however, particles which were quickly ejected from the system, or quickly impacted the star or planet, contributed less to the integrated dust distributions. Particles which remained trapped in resonances for long periods of time contributed substantially to the dust distribution.
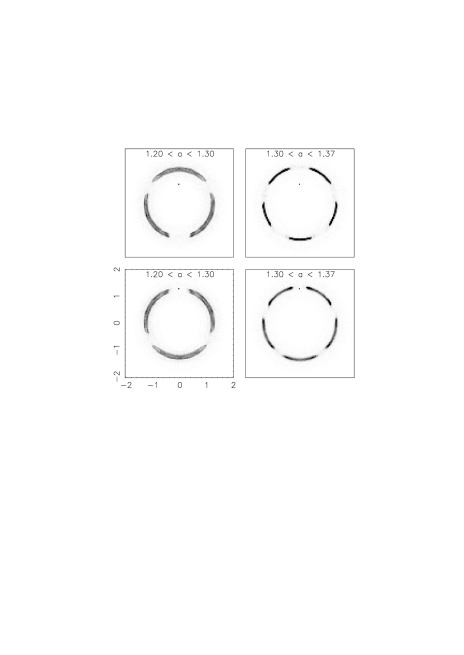
In Figure 1d we show the particle distribution restricted to semi-major axis between 1.2-1.3, containing the 3:2 resonance, and between 1.3-1.37, containing the 5:3 resonance, for the simulations shown in Figure 1a,b when the planet is at periastron and at apastron. Only one family of resonant orbits dominates for both resonances and the phase of the density peaks with respect to the planet depends on the planet’s orbital phase. The distribution of particles in the 3:2 resonance exhibits a three-fold symmetry and that of the 5:3 exhibits a five-fold symmetry. When the planet is at periastron, the sum of the particle distributions in the 3:2 and 5:3 resonances exhibits four peaks similar to those observed in the Eridani system.
To simulate the effect of the decreasing radiation field the dust distribution was weighted by where is its radial distance from the star. The resulting predicted intensity image for a planet at periastron, and smoothed to the approximate resolution of the submillimeter observations is shown in Figure 2 with the submillimeter image by Greaves et al. (1998) for comparison. The dusty disk is tilted assuming a disk inclination of (where corresponds to face on). This is somewhat higher than the estimated by Greaves et al. (1998) from the ring but consistent with the estimated from optical line data Saar & Osten (1997).
The morphology of the dust simulation shown in Figure 2 exhibits two dominant peaks at mean longitudes of approximately from the planet which correspond fairly well to the two dominant peaks south east and west of the star observed in the submillimeter map. Near the planet, a weaker arc is displayed in the simulation, which corresponds to the weaker arc of emission observed to the north of the star in the submillimeter map. However, the dust emission predicted opposite to the planet is more distant from the star than that observed south of the star in the submillimeter image.
In Figure 1d we show particle distributions for restricted ranges of semi-major axes. When the planet is at periastron, density enhancements caused by the 3:2 resonance add to those from the 5:3 causing the two dominant peaks seen in Figure 1a. When the planet is at apastron, the concentrations caused by the 3:2 resonance are out of phase with those in the 5:3. Some substructure is also caused by the 7:4 resonance in Figures 1a,b.
In Figures 1 and 2 we have given axes in units of the planets semi-major axis. The radius of the ring was estimated to be approximately 60 AU which would correspond to a planet semi-major axis of about 2/3 this or 40 AU. Assuming a stellar mass of 0.8 , the planet orbital period is 280 years. The total time of our simulations ( times the planet period) corresponds to years.
Dust particles can be trapped in a exterior principle mean-motion resonance with resonant arguments of the form
| (1) |
where is an integer between 0 and , and are the mean longitudes of the particle and planet respectively, and and are the longitudes of periastron. We consider the particle to be trapped in the resonance when librates about a particular fixed value. Take the planet’s longitude of periastron as a reference angle (). In resonance the resonance angle where is odd if is even and is even otherwise.
For the mean longitude of a dust particle very close to the planet to be strongly locked to that of the planet, the resonance responsible is likely to be the one. In this case
| (2) |
For the 3:2 resonance and when the planet is at periastron (), we find dust particles near . When the planet is at apastron (), is the same. This only looks out of phase in Figure 1d because we have rotated the images so that the longitude of the planet is fixed. When the resonant argument is fixed, we will only find particles with these longitudes, causing the concentrations we see in Figure 1. For the 5:3 resonance, when the planet is at periastron, , and when the planet is at apastron, . This five-fold symmetry is also consistent with the concentrations seen in Figure 1d.
In our simulations we also found particles populating resonances with other values of , however these tended to have shorter lifetimes and so contributed less to the final particle distributions. When , higher particle densities arise at angles when the particles reach apastron or periastron (see discussion in Wilner et al. 2002). For example, is favored for the 3:2 resonance when the planet is at low eccentricity causing two peaks in the particle distribution rather than three, which is what is seen in the simulations of (Liou & Zook, 1999).
3 Summary and Discussion
We have found that the morphology of dusty material trapped in exterior resonances with a planet can be strongly dependent upon the eccentricity and orbital phase of the planet. The morphology of the Eridani dust ring seems to be reproduced by dust particles captured into the 5:3 and 3:2 exterior resonances with a moderate eccentricity, , planet near periastron. When the planet was more massive () or more highly eccentric (greater than 0.4), the resonances closest to the planet did not capture and hold particles as efficiently. When the planet mass was below a Saturn mass, the 4:3 resonance also contributed to the particle distribution resulting in dominant symmetric four peaks. The asymmetries observed in the Eridani image were not observed in the dust distribution so we consider planets less massive than Saturn unlikely to explain the particle distribution. When the planet eccentricity was below 0.15, the azimuthal density variations in the dust distribution were too low to account for the morphology in the Eridani disk.
Our model differs from that proposed by Ozernoy et al. (2000) in a number of ways. The period of the orbital planet in our model is 280 years which should cause the pattern to revolve by about the star by , faster than the estimated by Ozernoy et al. (2000), where the model planet semi-major axis is AU rather than at AU. Our model planet is located to the north of the star, rather than to the west of the star. Our model planet mass is similar to theirs but at a moderate eccentricity. Our model dust concentrations are a result of segregation in the phase of a resonant angle, rather than caused by a large libration amplitude. Furthermore, because of the eccentricity of the planet, our model predicts that the morphology of the dusty ring will vary, as well as revolve as the planet orbits about the star.
The initial conditions of our simulations cause many of the particles to begin trapped in the resonances and at fairly low eccentricity. It is possible that low eccentricity planetesimals exist in the system and that they are the source of the dust particles that we see. Alternatively the planetesimals in the system are further out and the dust particles become trapped in the resonances as they spiral in toward the planet. Further simulations would be required to differentiate between these possibilities. In either case, resonant capture into these resonances is less likely and less prolonged when the planet mass or eccentricity is high. If the planet mass is too low then it cannot be responsible for clearing a gap or central region in the dust distribution. Additional and more massive planets would be required to do this.
It is possible that high eccentricity planets are common in the outskirts of extra-solar systems. If so then the resulting dust distributions would not only revolve (Ozernoy et al., 2000), but will also be dependent upon the orbital phase of the planets. This is an exciting prospect because there would be variations in the dust morphology on observable timescales.

References
- Aumann et al. (1984) Aumann, H. H. et al. 1984, ApJ, 278, L23
- Burns et al. (1979) Burns, J. A., Lamy, O. L., Soter, S. 1979, Icarus, 40, 1
- Dermott et al. (1994) Dermott, S. F., Jayaraman, S., Xu, Y. L., Gustafson, B. A. S., & Liou, J. C. 1994, Nature, 369, 719
- Greaves et al. (1998) Greaves, J. S., et al. 1998, ApJL, 506, L133
- Holland et al. (1998) Holland, W. S., et al. 1998, Nature, 392, 788
- Jayawardhana et al. (1998) Jayawardhana, R., Fisher, S., Hartmann, L., Telesco, C., Pina, R., & Fazio, G. 1998, ApJ, 503, L79
- Koerner et al (1998) Koerner, D. W., Ressler, M. E., Werner, M. W., & Backman, D. E. 1998, ApJ, 503, L83
- Murray & Holman (1997) Murray, N., & Holman, M. 1997, AJ, 114, 1246
- Liou & Zook (1999) Liou, J.-C., & Zook, H. A. 1999, AJ, 118, 580
- Moro-Martin & Malhotra (2002) Moro-Martin, A. & Malhotra, R. 2002, AJ, in press, (astroph/0207350)
- Ozernoy et al. (2000) Ozernoy, L. M., Gorkavyi, N. N., Mather, J. C.,& Taidakova, T. A. 2000, ApJ, 537, L147
- Saar & Osten (1997) Saar, S. H., & Osten, R. A. 1997, MNRAS, 284, 803
- Schneider et al. (1999) Schneider, G., et al. 1999, ApJ, 513, L127
- Soderblom & Dappen (1989) Soderblom, D., & Dappen, W. 1989, ApJ, 342, 945
- Song et al. (2000) Song, I., Caillault, J.-P., Barrado y Navascués, D., Stauffer, J. R., & Randich, S. 2000, ApJL, 533, L41
- Wilner et al. (2002) Wilner, D.J., Holman, M.J., Kuchner, M. J., & Ho, P.T.P. 2002, ApJ, 569, L115