Photometric Light Curve for the Kuiper Belt Object 2000 on 78 Nights
Abstract
Kuiper Belt Objects (KBOs) are generally very faint and cannot in practice be monitored with a well-sampled long-term light curve; so our discovery of the bright KBO 2000 offers an excellent opportunity for synoptic studies. We present a well-sampled photometric time series (77 R magnitudes and 29 V magnitudes on 78 nights) over a 225-day time span centered on the 2001 opposition. The light curve (corrected to the year 2001 opposition distance) varies from 19.11 to 19.39 mag with a single peak that is smooth, time symmetric, and coincident with opposition. All variations in the light curve are consistent with a linear opposition surge (, where is the solar phase angle), while any rotational modulation must have a peak-to-peak amplitude of less than 0.097 mag. This is the first measured opposition surge for any KBO (other than Pluto). The V R color is , with no apparent variation with phase at the few percent level. With at opposition, 2000 remains the brightest known KBO and a prime target for future photometric and spectroscopic studies.
1 Introduction
Most searches for Kuiper Belt Objects (KBOs) scan over small areas of the sky to deep limits, with little chance of discovering the rare-bright objects. Only in the last two years have a number of studies searched wide areas (Ferrin et al., 2001; Larsen et al., 2001; Sheppard et al., 2000; Jewitt, Luu, & Trujillo, 1998). As part of the QUEST KBO Survey ( to ), we discovered the very bright KBO 2000 (Ferrin et al., 2001). This body is one of the largest known KBOs, and the brightest after Pluto.
As a bright source, 2000 can provide the best signal-to-noise ratio for a variety of physical observations, including visible and infrared spectroscopy. Our own discovery and initial follow-up photometry (Ferrin et al., 2001) established the red color of 2000 , typical of many KBOs and attributed to the presence on the surface of organic solids (Cruikshank et al., 1998). Brown, Blake, & Kessler (2000) give a spectrum from 1.4-2.4 m, Licandro, Oliva, & Di Martino (2001) present a spectrum from 0.9-2.4 m, and Jewitt & Luu (2001) give a reflectance spectrum from 1.0-2.4 m. The infrared spectrum of 2000 is generally featureless although Licandro et al. note strong absorption in the K band. This might be related to highly carbonized materials with a deficiency of hydrogen bonds.
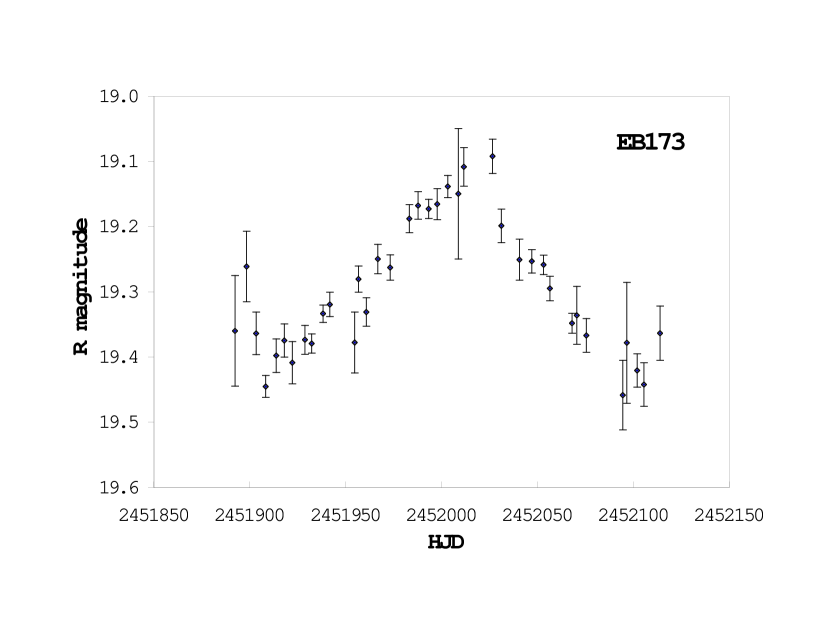
Here, we report the first long-term photometric light curve for 2000 measured on 78 nights from December 2000 to July 2001 with the Yale 1-meter telescope at Cerro Tololo Observatory. The data reveal a prominent opposition surge, which is a significant increase in brightness within a few degrees of zero phase. The effect is commonly observed for the moon, asteroids, and satellites of planets in the outer solar system (Gehrels, 1956), and has been attributed both to the sudden disappearance of shadows cast by regolith particles and to coherent backscattering by particle aggregates (Shkuratov & Helfenstein, 2001; Hapke, 1993). For the high-albedo icy satellites in the outer solar system, laboratory investigations suggest that coherent backscattering may play a dominant role (Nelson et al., 1998). For the well-studied asteroids in the main belt, the shape of the phase curve is known to correlate with spectral type and albedo (Belskaya & Shevchenko, 2000; Helfenstein, 1989; Bowell & Lume, 1999). In this paper we compare the phase curve we observe for 2000 with model predictions and with other solar system bodies to place constraints on the likely composition and surface properties.
2 Observations
We made all our photometric observations of 2000 with the Yale 1-m telescope at Cerro Tololo operated by the YALO consortium (Mendez, Depoy, & Bailyn, 1998; Bailyn et al., 1999). As observations with this telescope are queue-scheduled by a resident operator, this mode is well suited for secular observations. This capability and the accessibility of 2000 at our modest aperture provided an opportunity to obtain the first long-term light curve of a KBO (other than Pluto) with fine time resolution.
All our data are from the ANDICAM CCD camera (Mendez, Depoy, & Bailyn, 1998). The array has pixels, each square. The read noise is 11 on average, and we operated at a gain of . All our exposures were of 300 second duration. Our typical seeing condition resulted in a FWHM of (5 pixels). With a maximum apparent motion for 2000 of , the trailing was less than 1.2 pixel. A detailed calculation shows that this trailing results in a negligible systematic photometric error (under 0.001 mag for our 5 pixel radius photometry aperture).
Our observations of 2000 cover 225 days from JD 2451890 (11 December 2000) to JD 2452115 (24 July 2001). We discarded 29 images because the image fell on a bad column, a cosmic ray hit, or a background star. In all, we obtained 214 useable images on 78 separate nights. Of these, 185 are in the Johnson R-band with a fairly even distribution across our observing interval, while 29 are in the Johnson V-band with all but one of these taken before JD 2451942 (1 February 2001). By averaging repeated measurements taken within 15 minutes on the same night, and weighting inversely by the estimated variance, we obtain 77 R-band and 28 V-band magnitudes. They are listed in Table I with 1-sigma errors and are plotted in Figure 1 versus observation date. For each observation Table I also gives the heliocentric Julian Date of the middle of the exposure(s) and the solar phase angle , derived using the JPL/Horizons program at http://ssd.jpl.nasa.gov/.
Our method for measuring the magnitudes and determining their uncertainties follows the standard techniques in CCD photometry. We used IRAF programs (ZEROCOMBINE, FLATCOMBINE, CCDPROC) to determine mean bias and flat fields (from five bias frames and domes flats taken at the start of each observing night) and to make bias and flat field corrections for each image. We used IRAF program PHOT to measure the flux of objects within apertures of radii 10 pixels for absolute photometry and within radii of 5 pixels for relative photometry. For each object we determined the sky background as the mode of the flux distribution within an annulus of inner and outer diameters 15 and 30 pixels.
Our calibration procedure consisted of three steps. In the first, we analyzed images of Landolt photometric standard stars (Landolt, 1992) taken on eight photometric nights. Typically 29 stars were observed on each night with airmasses ranging from 1.15 to 1.7. For each night we fit Landolt’s catalogued magnitudes for these stars to a linear function of the instrumental magnitudes, the V R colors were measured, and corrected for their airmass at the time of observation. The standard deviations for these fits range from 0.010 to 0.030 mag (with a median of 0.015 mag), this being a measure of our systematic uncertainties.
Our second step was to determine the R- and V-band magnitudes of many comparison stars near to the path of 2000 . We chose 151 stars such that every image of 2000 included nine comparison stars on average. Their magnitudes range from 14 to 18, yielding images with large signals but not saturated. The stars appear in 19 fields, each of which we recorded with 180-second exposures in both the R and V bands on the same nights that we observed the Landolt stars. Using our fits to the Landolt magnitudes, we determined the V and R magnitudes of the comparison stars given their airmass and instrumental V and R magnitudes. The resulting comparison star magnitudes are accurate to approximately 0.01 mag.
Our third calibration step was to determine the R and V magnitudes of 2000 using aperture corrections, thus minimizing the contribution of the sky background to the noise in each measurement. For each usable image of the object, we first measured its instrumental magnitude using a 5-pixel radius aperture. We then converted this result to a measurement within a 10-pixel radius aperture by adding the median difference between the 5- and 10-pixel instrumental magnitudes for nearby bright comparison stars. Finally, we determine the R-band or V-band magnitude for 2000 from its corresponding 10-pixel instrumental magnitude by adding the median difference between calibrated and instrumental magnitudes for the comparison stars appearing in the same image.
The dominant uncertainty in our resulting measurements for 2000 is the uncertainty from the flux measurements within the 5-pixel apertures which is typically 0.04 to 0.08 mag. On most of our nights, the R-band images were taken as pairs (from JD 2451890 to JD 2451942) or as triples (from JD 2451954 to JD 2452115) in quick succession. The errors after combining the resulting flux measurements as weighted averages, which generally range from 0.02 to 0.05 mag., as shown in Table I.
We have checked our determinations of these errors in two ways. First, we have many multiple measures of 2000 that are nearly simultaneous. Their differences (in units of the combined one-sigma uncertainty) have an RMS scatter of 0.98, implying that our individual error bars are accurate. Second, we have produced magnitudes for eight check stars (with magnitudes close to that of 2000 ) using the same procedures we used for 2000 . Fitting constant light curves to each of the stars we find the total chi-square to be 172 for 164 degrees of freedom. The reduced chi-square is near unity, so we conclude that our method for deriving the uncertainties is valid.
For the purposes of studying the long-term variability of 2000 , we have calculated the 5-day average magnitudes and errors shown in Table II and plotted in Figure 2 as a function of solar phase angle . We computed the magnitudes from the R-band data in Table I for each successive five-day intervals starting at JD 2451890. For each average magnitude, Table II also shows the average Julian date and solar phase angle for each 5-day average. We corrected the observed magnitudes (R) for the changing geocentric distance of 2000 () using where is the R-band magnitude corrected to the opposition distance. The geocentric distance of 2000 changed from 30.31 AU at the start of our observations to 28.76 AU at opposition, for a correction of up to 0.11 mag. The heliocentric distance of 2000 varies from 29.80 AU to 29.70 AU over our interval of observation, resulting in a totally negligible correction of 0.007 mag.
3 Analysis
The light curve for 2000 shown in Figure 1 has a prominent peak at JD that is broad, symmetrical, and that coincides with the date of opposition on JD 2452010 (with ). There are also two minima at JD and , each coinciding with the respective times of maximum phase on JD 2451922 and 2452102 (with equal and , respectively). These coincidences clearly suggest that the brightness variations we observe for 2000 are phase dependent, and the result of a significant opposition surge.
The phase curve for 2000 plotted in Figure 2 shows that this opposition surge is linear over the observable range of phase. A least-squares fit yields . The one-sigma uncertainties in the constant and phase coefficient are mag and . Because the reduced chi-square for this linear fit is close to unity (), there is no justification for fitting a more complicated model for the phase function (e.g., a curve or a broken line). Correcting the unbinned data from Table I to opposition distance and again fitting a linear phase function also yields a reduced chi-square close to unity (1.31). At this finer resolution the RMS scatter about a linear fit is 0.059 mag, while the average uncertainty of the input magnitudes is 0.048 mag.
In terms of the parameters introduced by (Hapke, 1993) to characterize the phase functions of various solar system bodies, our observations of 2000 provide significant constraints. We have fit the phase curve with Hapke’s integral phase function for the opposition surge component, which to first order in is proportional to , where is the phase function for a single particle and . Here describes an opposition surge of amplitude and angular half-width radians. Values for are expected for surges resulting solely from shadow-hiding, whereas values exceeding unity may occur due to coherent backscattering. For our small angular range of , is very close to one, so then the opposition surge component will be and the total reflected intensity will scale as . In magnitudes, , where is the magnitude at zero phase. Given the narrow phase range of our observations, we are not able to constrain either the albedo or the surface roughness, which enter into Hapke’s expressions at higher orders in .
Our best fit yields radians (), , and ; with a chi-square of 37.6 for 35 degrees-of-freedom. From a Monte Carlo analysis of our observations, we derive a one-sigma uncertainties rad for , -3 and +2 for , and mag for .
We have many virtually simultaneous V-band and R-band measurements, so we can look for variations in the V R color. The average V R color is from JD 2451893 to JD 2451923 (phase ), from JD 2451927 to JD 2451942 (phase ), and for JD 2452030 (phase ). Thus we find no evidence for any fast or slow variations. The final V R color for all nights combined as a weighted average is mag. This agrees with determined by Ferrin et al. (2001) from earlier observations.
Because the V R color for 2000 appears constant, our observations alone reveal no significant difference between the V-band and R-band phase curves. Including the V R observations presented by Ferrin et al. (2001) and Jewitt & Luu (2001) we can refine this constraint. In Table 3, we have collected all available V R measures for 2000 . Our chi-square fit to these data yields a V R phase curve with slope . This slope differs by less than one sigma from zero, so that again we find no significant color dependence for the opposition surge. Adding this marginally non-zero coefficient to our R-band phase coefficient of , we obtain a V-band phase coefficient of .
4 Implications
One of the primary goals of our long-term study of 2000 is to determine its rotation period. However, we see no significant photometric modulations other than the ordinary phase function with its opposition surge. Quantitatively, this is shown by the fit of nightly R magnitudes (see Table 1) having a reduced chi-square near unity. However, it is possible that 2000 has a very low amplitude modulation, and this might be shown by the nightly scatter about the phase function (0.059 mag) being slightly above the average one-sigma error bar (0.048 mag). If this difference is ascribed to rotational modulation, then the peak-to-peak amplitude cannot be larger than 0.097 mag. The error bars are too large to have any real hope of finding a significant periodicity with only 77 data points spread out over 225 nights.
The lack of a rotational modulation is not surprising, as by our count from the literature (Farnham, 2001a, b; Gutiérrez, 2001; Davies et al., 1998; Sheppard & Jewitt, 2002, for example), roughly 32 KBOs and Centaurs have been checked for variability and this has yielded only 14 known rotational periods. A flat rotational light curve could be due to 2000 being viewed pole-on or due to its being nearly round and without large regional albedo differences.
The absence of any significant rotational variability and the bright appearance of 2000 relative to other KBOs has allowed us to measure the object’s phase curve, the first for any KBO other than Pluto (Rabinowitz & Schaefer, 2001). In Figure 2, we compare the phase curve to planet Pluto (the largest known KBO), outer solar-system satellites Rhea, Nereid, and Titania, and also to the dark main-belt asteroid (24) Themis. These examples have been chosen because they span the range of small-angle phase curves that have been well measured for bodies that might have surfaces similar to 2000 . Nereid is particularly interesting because it might be a captured KBO (Schaefer & Schaefer, 1995, 2000) and because it also exhibits a prominent opposition surge (Schaefer & Tourtellotte, 2001).
It is apparent that 2000 has an opposition surge with a slope intermediate in amplitude among the comparisons in Figure 2. (This is also confirmed by comparing with the tabulated values in Table II of Schaefer & Tourtellotte (2001).) The surge is much steeper than for Pluto, Rhea, and most main-belt asteroids, but not as steep as the surges observed for Nereid and Titania. Unlike these two satellites which have narrow opposition surges, 2000 also has a wide surge comparable to Rhea and (24) Themis. Strong and narrow opposition surges have also been measured for particulate materials of high albedo, for which the cause is attributed to coherent backscatter (Nelson et al., 1998, 2000). It is thus possible that the influence of coherent backscatter is modest for 2000 in comparison with Nereid and Titania. This might also indicate a relatively low albedo for 2000 . However, because the high-albedo surfaces of Pluto and Rhea (0.6) have even weaker opposition surges, this conclusion can not be drawn. Owing to the intermediate slope of the opposition surge in 2000 , the comparison with Nereid does not allow any confident conclusion concerning the possibility that Nereid is a captured KBO.
Despite the relatively broad opposition surge for 2000 , the large amplitude that we derive ( with 84% confidence) shows that coherent backscattering is likely an important influence. This can be tested by looking for a wavelength dependence to the width of the opposition surge, . For shadow-hiding, there is no wavelength dependence. For coherent-backscattering, scale linearly with wavelength of observation (Hapke, 1993). Our R-band observations yield rad. For the V-band, we should therefore expect rad if coherent-backscattering is the dominant cause, and rad if shadow-hiding is dominant.. Unfortunately, our observations are not sufficiently precise to measure this small difference. However, in the near future, a simple measure of the or color at opposition can be compared with the mag and mag reported for a phase of (Ferrin et al., 2001) or mag and mag reported for a phase of (Jewitt & Luu, 2001). This comparison could provide a decisive test between shadow hiding and coherent backscattering.
5 Conclusions
We measured 77 R-band and 28 V-band magnitudes of 2000 on 78 nights over a 225 day interval centered on its 2001 opposition. We find that the light curve varies from to , with all the changes fully described by a linear phase function with . This is the first opposition surge measured for any KBO (other than Pluto). The amplitude of any rotational modulation is small, with a peak-to-peak amplitude of less than 0.097 mag. The V R color is constant at mag. At opposition (with ), 2000 is the brightest known KBO with mag.
We are able to fit the R-band phase curve assuming a Hapke-type opposition surge with width and amplitude . This is relatively broad compared to Nereid, and does not offer confirmation that Nereid could be a captured KBO. The large amplitude of the surge, however, indicates the coherent backscattering may be important. Our measurements of the phase curve in the V-band are not accurate enough to distinguish between shadow hiding and coherent backscattering. Future measures of the or color near opposition could determine the physical cause of the opposition surge.
References
- Bailyn et al. (1999) Bailyn, C. D., D. Depoy, R. Agostinho, R. Mendez, J. Espinoza, and D. Gonzalez 1999, The first year of operation of the YALO Consortium. BAAS 198, 8706.
- Brown, Blake, & Kessler (2000) Brown, M, G. Blake, and J. Kessler 2000, Near-Infrared Spectroscopy of the Bright Kuiper Belt Object 2000 . ApJ543, L163-L165.
- Belskaya & Shevchenko (2000) Belskaya, I. And V. Shevchenko 2000. Opposition Effect of Asteroids. Icarus 147, 94-105.
- Bowell & Lume (1999) Bowell. E. And K. Lumme 1979. Colorimetry and Magnitudes of Asteroids. In Asteroids I (T. Gehrels, Ed.), pp. 132-169. Univ. of Arizona Press, Tucson.
- Bowell et al. (1989) Bowell, E. et al. 1989. Application of Photometric Models to Asteroids. In Asteroids II (R. Binzel, T. Gehrels, and M. Matthews, Eds.),pp. 524-556. Univ. Arizona Press, Tucson.
- Buratti, Gibson, & Mosher (1992) Buratti, B. J., J. Gibson, and J.A. Mosher 1992. CCD Photometry of the Uranian Satellites. AJ104, 1618-1622.
- Cruikshank et al. (1998) Cruikshank, D. P. et al. 1998. The Composition of Centaur 4145 Pholus. Icarus 135, 389-407.
- Davies et al. (1998) Davies, J. K., N. McBride, S. L. Ellison, S. F. Green, and D. Ballantyne 1998. Visible and Infrared Photometry of Six Centaurs. Icarus, 134, 213-227.
- Domingue, Lockwood, & Thompson (1995) Domingue, D. L., G. W. Lockwood, and D. T. Thompson 1995. Surface Textural Properties of Icy Satellites: A Comparison between Europa and Rhea. Icarus 115, 228-249.
- Farnham (2001a) Farnham, T. L. 2001a. The Rotation Axis of the Centaur 5145 Pholus. Icarus, 152, 238-245.
- Farnham (2001b) Farnham, T. L. 2001b. Rotation and Color Studies of Centaurs, KBOs, and Comets. BAAS, 33, 12.10.
- Ferrin et al. (2001) Ferrin, I. et al. 2001, Discovery of the Bright Trans-Neptunian Object 2000 . ApJ548, 340-L243-L247.
- Gehrels (1956) Gehrels, T. 1956. Photometric Studies of asteroids V. The light curve and phase function of 20 Massalia. ApJ123, 331-338.
- Gutiérrez (2001) Gutiérrez, P. J. et al. 2001. A&A, 371, L1-L4.
- Hapke (1993) Hapke, B. 1993, Theory of Reflectance and Emittance Spectroscopy. Cambridge: Cambridge Univ. Press.
- Harris et al. (1989) Harris, A. W., J. W. Young, E. Bowell, L. J. Martin, R. L. Millis, M. Poutanen, F. Scaltriti, V. Zappala, H.J. Schober, H. Debehogne, and K. W. Zeigler 1989. Photoelectric Observations of Asteroids 3, 24, 60, 261, and 863. Icarus 77, 171-186.
- Helfenstein (1989) Helfenstein, P. and J. Veverka. 1989. Physical Characterization of Asteroid Surfaces from Photometric Analysis. In Asteroids II (R. P. Binzel, T. Gehrels, and M. S. Matthews, Eds.),pp. 557-583. Univ. Of Arizona Press, Tucson.
- Jewitt, Luu, & Trujillo (1998) Jewitt, D. C., J. X. Luu, and C. A. Trujillo 1998. Large Kuiper Belt Objects: The Mauna Kea 8K CCD Survey. AJ115, 2125 - 2135.
- Jewitt & Luu (2001) Jewitt, D. C. and J. X. Luu 2001, Colors and Spectra of Kuiper Belt Objects. AJsubmitted (astro-ph/0107277).
- Larsen et al. (2001) Larsen, J. A., et al. 2001. The Spacewatch Wide-Area Survey for Bright Centaurs and Trans-Neptunian Objects. AJ121, 562-579.
- Landolt (1992) Landolt, A. U. 1992, UBVRI photometric standard stars in the magnitude range around the celestial equator. AJ104, 340-491.
- Licandro, Oliva, & Di Martino (2001) Licandro, J., E. Oliva, and M. Di Martino 2001, NICS-TNG Infrared Spectroscopy of Trans-neptunian objects 2000 and 2000 . A&Ain press (astro-ph/0105434).
- Mendez, Depoy, & Bailyn (1998) Mendez, R., D. Depoy, and C. Bailyn. 1998. NOAO Newsletter 55, 17.
- Nelson et al. (1998) Nelson, R. M., B. W. Hapke, W. D. Smythe, and L.J. Horn. 1998. Phase Curves of Selected Particulate Materials: The Contribution of Coherent Backscattering to the Opposition Surge. Icarus 131, 223-230.
- Nelson et al. (2000) Nelson, R. M., B. W. Hapke, W. D. Smythe, and L.J. Spilker. 2000. The Opposition Effect in Simulated Planetary Regoliths. Reflectance and Circular Polarization Ratio Change at Small Phase Angle. Icarus 147, 545-558.
- Rabinowitz & Schaefer (2001) Rabinowitz, D., and B. E. Schaefer 2001. The Solar Phase Angle Curve for the Bright Plutino 2000 . BAAS, 33, 08.06.
- Schaefer & Schaefer (2000) Schaefer, B. E., and M. W. Schaefer 2000. Nereid has large-amplitude photometric variability. Icarus, 146, 541-555.
- Schaefer & Tourtellotte (2001) Schaefer, B. E., and S. W. Tourtellotte 2001. Photometric Light Curve for Nereid in 1998: A Prominent Opposition Surge. Icarus, 151, 112-117.
- Schaefer & Schaefer (1995) Schaefer, M. W., and B. E. Schaefer 1995. Nereid: Does its continued unique variability indicate a Kuiper belt origin?. BAAS, 27, 1167.
- Sheppard et al. (2000) Sheppard, S. S., D. C. Jewitt, C. A. Trujillo, M. J. Brown, and M. C. Ashley 2000. A Wide-Field CCD Survey for Centaurs and Kuiper Belt Objects. AJ, 120, 2687 - 2694.
- Sheppard & Jewitt (2002) Sheppard, S. S. and D. C. Jewitt, 2002. Time Resolved Photometry of Kuiper Belt Objects: Rotations, Shapes, and Phase Functions. AJ, in press (astro-ph/0205392).
- Shkuratov & Helfenstein (2001) Shkuratov, Y. G. and P. Helfenstein. 2001. The Opposition Effect and the Quasi-fractal Structure of Regolith: I. Theory. Icarus, 152, 96-116.
- Tholen & Tedesco (1994) Tholen, D. J and E.F.Tedesco 1994. Pluto’s Lightcurve: Results from Four Oppositions. Icarus, 108, 200-208.
| 2451890.85 | 1.632 | 19.25 0.19 | |
| 2451893.84 | 1.678 | 19.39 0.10 | 20.25 0.28 |
| 2451896.85 | 1.721 | 19.21 0.07 | 19.95 0.22 |
| 2451899.86 | 1.760 | 19.37 0.10 | |
| 2451901.84 | 1.782 | 19.40 0.06 | 20.08 0.14 |
| 2451902.86 | 1.793 | 19.25 0.08 | |
| 2451903.81 | 1.803 | 19.45 0.06 | 20.10 0.08 |
| 2451904.86 | 1.813 | 19.20 0.11 | |
| 2451906.85 | 1.831 | 19.45 0.04 | 19.89 0.09 |
| 2451907.84 | 1.839 | 19.45 0.04 | 20.09 0.08 |
| 2451908.86 | 1.846 | 19.41 0.05 | |
| 2451909.85 | 1.853 | 19.49 0.05 | |
| 2451912.80 | 1.871 | 19.38 0.05 | 19.97 0.09 |
| 2451914.82 | 1.879 | 19.41 0.03 | |
| 2451915.82 | 1.883 | 19.33 0.04 | 20.14 0.08 |
| 2451917.86 | 1.889 | 19.38 0.06 | 19.98 0.06 |
| 2451918.84 | 1.890 | 19.47 0.06 | 20.10 0.13 |
| 2451919.81 | 1.892 | 19.31 0.09 | 19.77 0.14 |
| 2451920.79 | 1.893 | 19.93 0.14 | |
| 2451921.85 | 1.893 | 19.45 0.06 | 20.08 0.15 |
| 2451922.78 | 1.893 | 19.33 0.09 | 20.27 0.26 |
| 2451923.81 | 1.892 | 19.40 0.07 | |
| 2451927.75 | 1.883 | 19.35 0.09 | 19.77 0.10 |
| 2451928.80 | 1.879 | 19.38 0.03 | 20.03 0.07 |
| 2451929.78 | 1.874 | 19.37 0.04 | 20.03 0.08 |
| 2451930.80 | 1.869 | 19.41 0.05 | |
| 2451931.78 | 1.864 | 19.48 0.04 | 20.18 0.08 |
| 2451932.77 | 1.858 | 19.30 0.03 | 19.99 0.06 |
| 2451933.80 | 1.851 | 19.38 0.03 | 19.96 0.06 |
| 2451936.77 | 1.828 | 19.33 0.03 | 19.94 0.06 |
| 2451937.82 | 1.819 | 19.34 0.04 | 19.88 0.06 |
| 2451938.82 | 1.810 | 19.32 0.03 | 19.95 0.06 |
| 2451939.82 | 1.800 | 19.38 0.04 | 19.91 0.05 |
| 2451940.80 | 1.790 | 19.30 0.05 | 20.07 0.09 |
| 2451941.78 | 1.779 | 19.34 0.03 | 20.00 0.06 |
| 2451942.73 | 1.767 | 19.30 0.04 | 20.00 0.08 |
| 2451954.71 | 1.587 | 19.38 0.05 | |
| 2451955.74 | 1.568 | 19.31 0.03 | |
| 2451957.78 | 1.530 | 19.25 0.03 | |
| 2451960.78 | 1.470 | 19.33 0.03 | |
| 2451966.80 | 1.336 | 19.25 0.03 | |
| 2451971.80 | 1.213 | 19.28 0.03 | |
| 2451974.77 | 1.136 | 19.24 0.03 | |
| 2451981.73 | 0.947 | 19.21 0.04 | |
| 2451984.72 | 0.862 | 19.18 0.03 | |
| 2451987.83 | 0.775 | 19.17 0.03 | |
| 2451991.80 | 0.655 | 19.16 0.03 | |
| 2451994.75 | 0.571 | 19.18 0.03 | |
| 2451997.73 | 0.492 | 19.17 0.03 | |
| 2452001.71 | 0.392 | 19.14 0.02 | |
| 2452004.74 | 0.329 | 19.15 0.04 | |
| 2452008.75 | 0.284 | 19.15 0.10 | |
| 2452011.61 | 0.287 | 19.11 0.03 | |
| 2452026.58 | 0.619 | 19.09 0.03 | |
| 2452030.73 | 0.745 | 19.19 0.04 | 19.80 0.06 |
| 2452031.59 | 0.765 | 19.21 0.04 | |
| 2452040.64 | 1.024 | 19.25 0.03 | |
| 2452045.77 | 1.164 | 19.37 0.07 | |
| 2452046.61 | 1.186 | 19.21 0.03 | |
| 2452048.67 | 1.238 | 19.27 0.03 | |
| 2452051.60 | 1.312 | 19.26 0.03 | |
| 2452053.52 | 1.357 | 19.26 0.03 | |
| 2452054.56 | 1.382 | 19.26 0.04 | |
| 2452055.57 | 1.405 | 19.31 0.03 | |
| 2452057.57 | 1.451 | 19.28 0.03 | |
| 2452066.59 | 1.633 | 19.23 0.05 | |
| 2452067.58 | 1.651 | 19.34 0.04 | |
| 2452068.53 | 1.667 | 19.30 0.03 | |
| 2452069.51 | 1.683 | 19.41 0.03 | |
| 2452070.51 | 1.700 | 19.34 0.05 | |
| 2452075.51 | 1.776 | 19.37 0.03 | |
| 2452094.51 | 1.946 | 19.46 0.06 | |
| 2452096.60 | 1.952 | 19.38 0.09 | |
| 2452101.51 | 1.960 | 19.34 0.06 | |
| 2452102.49 | 1.960 | 19.44 0.03 | |
| 2452105.50 | 1.956 | 19.44 0.04 | |
| 2452112.49 | 1.930 | 19.49 0.09 | |
| 2452115.52 | 1.910 | 19.32 0.05 |
| 2451892.3 | 1.66 | |
| 2451898.4 | 1.74 | |
| 2451903.3 | 1.80 | |
| 2451908.3 | 1.84 | |
| 2451913.8 | 1.88 | |
| 2451918.1 | 1.89 | |
| 2451922.3 | 1.89 | |
| 2451928.8 | 1.88 | |
| 2451932.3 | 1.86 | |
| 2451938.3 | 1.81 | |
| 2451941.8 | 1.78 | |
| 2451954.7 | 1.59 | |
| 2451956.8 | 1.55 | |
| 2451960.8 | 1.47 | |
| 2451966.8 | 1.34 | |
| 2451973.3 | 1.17 | |
| 2451983.2 | 0.90 | |
| 2451987.8 | 0.78 | |
| 2451993.3 | 0.61 | |
| 2451997.7 | 0.49 | |
| 2452003.2 | 0.36 | |
| 2452008.8 | 0.28 | |
| 2452011.6 | 0.29 | |
| 2452026.6 | 0.62 | |
| 2452031.2 | 0.76 | |
| 2452040.6 | 1.02 | |
| 2452047.0 | 1.20 | |
| 2452053.2 | 1.35 | |
| 2452056.6 | 1.43 | |
| 2452068.1 | 1.66 | |
| 2452070.5 | 1.70 | |
| 2452075.5 | 1.78 | |
| 2452094.5 | 1.95 | |
| 2452096.6 | 1.95 | |
| 2452102.0 | 1.96 | |
| 2452105.5 | 1.96 | |
| 2452114.0 | 1.92 |
| Reference | |||
|---|---|---|---|
| 0.75 | 19.80 | This paper | |
| 0.81 | 19.52 | Ferrin et al. (2001) | |
| 0.81 | 19.91 | Ferrin et al. (2001) | |
| 0.92 | 19.81 | Ferrin et al. (2001) | |
| 0.95 | 19.60 | Ferrin et al. (2001) | |
| 1.01 | 19.97 | Ferrin et al. (2001) | |
| 1.14 | 19.90 | Ferrin et al. (2001) | |
| 1.19 | 19.77 | Ferrin et al. (2001) | |
| 1.59 | 19.72 | Ferrin et al. (2001) | |
| 1.60 | 19.97 | Ferrin et al. (2001) | |
| 1.73 | 19.90 | Ferrin et al. (2001) | |
| 1.78 | 19.94 | This paper | |
| 1.80 | 19.86 | Ferrin et al. (2001) | |
| 1.82 | 19.94 | This paper | |
| 1.93 | 19.97 | Jewitt & Luu (2001) |