VLT observations of metal-rich extra galactic HII regions. I. Massive star populations and the upper end of the IMF ††thanks: Based on observations ESO/VLT service observations (65.N-0308 and 67.B-0197)
We have obtained high quality
FORS1/VLT optical spectra of 85 disk H ii regions in the
nearby spiral galaxies NGC 3351, NGC 3521, NGC 4254, NGC 4303, and NGC 4321.
Our sample of metal-rich H ii regions with metallicities close to
solar and higher reveal the presence of Wolf-Rayet (WR) stars in 27 objects
from the blue WR bump ( 4680 Å) and 15 additional candidate WR regions.
This provides for the first time a large set of metal-rich WR regions.
Approximately half (14) of the WR regions also show broad C iv 5808 emission
attributed to WR stars of the WC subtype.
The simultaneous detection of C iii 5696 emission in 8 of them allows us to
determine an average late WC subtype compatible
with expectations for high metallicities.
Combined with literature data, the metallicity trends of WR features and the WC/WN
number ratio are discussed.
The WR regions show quite clear trends between their observed WR features and the
H emission line. Detailed synthesis models are presented to understand/interpret
these observations.
In contrast with earlier studies of low metallicity WR galaxies,
both and are here found to be smaller than “standard” predictions from
appropriate evolutionary synthesis models at corresponding metallicities.
Various possibilities
which could explain this discrepancy are discussed.
The most likely solution is found with an improved prescription
to predict the line emission from WN stars in synthesis models.
The availability of a fairly large sample of metal-rich WR regions
allows us to improve existing estimates of the upper mass cut-off of the IMF
in a robust way and independently of detailed modeling:
from the observed maximum H equivalent width of the WR regions we derive
a lower limit for Mup of 60–90 M⊙ in the case of a Salpeter
slope and larger values for steeper IMF slopes.
This constitutes a lower limit on Mup as all observational effects known to
affect potentially the H equivalent width
can only reduce the observed .
From our direct probe of the massive star content we conclude that
there is at present no evidence for systematic variations of the upper mass
cut-off of the IMF in metal-rich environments, in contrast to some claims
based on indirect nebular diagnostics.
Key Words.:
Galaxies: abundances – Galaxies: evolution – Galaxies: ISM – Galaxies: starburst – Galaxies: stellar content – Stars: luminosity function, mass function – Stars: Wolf-Rayet1 Introduction
Wolf-Rayet stars (WR) are the descendants of the most massive stars. Although they live during a short time (Maeder & Conti 1994) these stars have been detected in young stellar systems, such as extragalactic HII regions (Kunth & Schild 1986) and the so-called WR galaxies (Conti 1991, Schaerer et al. 1999b). They are recognized by the presence of broad stellar emission lines at optical wavelengths, mainly at 4680 Å (known as the blue WR bump) and at 5808 Å (red WR bump). The blue bump is a blend of N v 4604,4620, N iii 4634,4641, C iii/iv 4650,4658 and He ii 4686 lines, that are produced in WR stars of the nitrogen (WN) and carbon (WC) sequences. In contrast, the red bump is formed only by C iv 5808 and it is mainly produced by WC stars. The detection of these features in the integrated spectrum of a stellar system provides a powerful tool to date the onset of the burst, and it constitutes the best direct measure of the upper end of the initial mass function (IMF). Thus, if WR features are found in the spectra of star forming systems, stars more massive than , where 25 M⊙ for solar metallicity, must be formed in the burst.
The IMF is one of the fundamental ingredients for studies of stellar populations, which has an important bearing on many astrophysical studies ranging from cosmology to the understanding of the local Universe. In particular the value of the IMF slope and the upper mass cut-off (Mup) strongly influences the mechanical, radiative, and chemical feedback from massive stars to the ISM such as the UV light, the ionizing radiation field, and the production of heavy elements.
A picture of a universal IMF has emerged from numerous works performed in the last few years (e.g. Gilmore & Howell 1998 and references therein). Indeed, these studies derive a slope of the IMF close to the Salpeter value for a mass range between 5 and 60 M⊙. This result seems to hold for a variety of objects and metallicities from very metal poor up to the solar metallicity, with the possible exception of a steeper field IMF (Massey et al. 1995, Tremonti et al. 2002). However, the IMF in high metallicity (12+log (O/H) (O/H) 8.92) systems is much less well constrained. Different indirect methods to derive the slope and Mup give contradictory results.
The detection of strong wind resonance UV lines in the integrated spectrum of high metallicity nuclear starbursts clearly indicate the formation of massive stars (Leitherer 1998; Schaerer 2000; González Delgado 2001). In contrast, the analysis of the nebular optical and infrared lines of IR-luminous galaxies and high metallicity H ii regions indicates a softness of the ionizing radiation field that has beeninterpreted as due to the lack of stars more massive than 30 M⊙ (Goldader et al. 1997; Bresolin et al. 1999; Thornley et al. 2000; Coziol et al. 2001). However, the interpretation of these indirect probes relies strongly on a combination of models for stellar atmospheres and interiors, evolutionary synthesis, and photoionisation, each with several potential shortcomings/difficulties (cf. García-Vargas 1996, Schaerer 2000, Stasińska 2002). For example, recently González Delgado et al. (2002) have shown that the above conclusion could be an artifact of the failure of WR stellar atmospheres models to correctly predict the ionizing radiation field of high metallicity starbursts (see also Castellanos 2001, Castellanos et al. 2002b).
A more direct investigation of the stellar content of metal-rich nuclear starbursts has been performed by Schaerer et al. (2000, hereafter SGIT00), using the detection of WR features to constrain Mup. They found that the observational data are compatible with a Salpeter IMF extending to masses Mup 40 M⊙. Most recently, a similar conclusion has been obtained by Bresolin & Kennicutt (2002, hereafter BK02) from observations of high-metallicity HII regions in M83, NGC 3351 and NGC 6384.
Here, we present a direct attempt to determine Mup based on the detection of WR features in metal-rich H ii regions of a sample of spiral galaxies. To obtain statistically significant conclusions about Mup and the slope of the IMF, a large sample of H ii regions needs to be observed. For coeval star formation with a Salpeter IMF and Mup=120 M⊙ at metallicities above solar, 60 to 80 % (depending on the evolutionary scenario and age of the region) of the H ii regions are expected to exhibit WR signatures (Meynet 1995; Schaerer & Vacca 1998, hereafter SV98). Thus, to find 40 regions with WR stars (our initial aim) a sample of at least 5-7 galaxies with 10 H ii regions per galaxy needs to be observed. Spectra of high S/N (at least 30) in the continuum are also required to obtain an accurate measure of the WR features. For this propose, we have selected the nearby spiral galaxies NGC 3351, NGC 3521, NGC 4254, NGC 4303 and NGC4321, which have have sufficient number of disk H ii regions of high-metallicity, as known from earlier studies.
Our observations have indeed allowed to find a large number of metal-rich WR H ii regions. The analysis of their massive star content is the main aim of the present paper. Quite independently of the detailed modeling undertaken below, our sample combined with additional WR regions from Bresolin & Kennicutt (2002) allow us to derive a fairly robust lower limit on the upper mass cut-off of the IMF in these metal-rich environments (see Sect. 6).
The structure of the paper is as follows: The sample selection, observations and data reduction are described in Sect. 2. The properties of the H ii regions are derived in Sect. 3. Section 4 discusses the trends of the WR populations with metallicity. Detailed comparisons of the observed WR features with the evolutionary synthesis models are presented in Sect. 5. More model independent constraints on Mup are derived in Sect. 6. Our main results and conclusions are summarised in Sect. 7.
2 Sample selection, observations and reduction
| Galaxy | NED type and activity | (J2000) | (J2000) | distance | |
|---|---|---|---|---|---|
| [km s-1] | [Mpc] | ||||
| NGC 3351 | SB(r)b, HII Sbrst | 10h43m57.8s | +11d42m14s | 778 | 10.0 |
| NGC 3521 | SAB(rs)bc, LINER | 11h05m48.6s | -00d02m09s | 805 | 7.2 |
| NGC 4254 | SA(s)c | 12h18m49.5s | +14d24m59s | 2407 | 16. |
| NGC 4303 | SAB(rs)bc, HII Sy2 | 12h21m54.9s | +04d28m25s | 1566 | 16. |
| NGC 4321 | SAB(s)bc, LINER HII | 12h22m54.9s | +15d49m21s | 1571 | 15.21 |
2.1 Selection of the HII regions
Our target galaxies (see Table 1) are selected among nearby spiral galaxies where a sufficient number of disk H ii regions of high metallicity are known from the previous studies of Shields et al. (1991), Oey & Kennicutt (1993), and Zaritsky et al. (1994). Inspection of spectra from the two latter studies kindly made available to us showed that the vast majority of their spectra are not deep enough to allow the detection of WR or other stellar signatures in the continuum.
Metallicities of all known regions were estimated from the published [O ii] 3727 and [O iii] 4959,5007 intensities using the standard “strong line” method and various empirical calibrations. For the FORS1 multi-object spectroscopic observations described below H ii regions with metallicities above solar ( 0.6) were given first priority. Secondary criteria taken into account in the choice of the known H ii regions were a large H equivalent width, and bright continuum flux at 4650 Å as determined from inspection of the spectra. This procedure lead to a first selection of 4 to 7 H ii regions per galaxy. Other regions with lower metallicities and/or lower H equivalent widths were retained as secondary targets.
Up to 19 slitlets per exposure can be used for spectroscopy with FORS1. Our primary targets were first positioned using the R-band images (see below) and the remaining slitlets were filled whenever possible with secondary targets. If a slitlet was left without any of our selected regions, we attempted to target other H ii regions selected from the H images of Hodge & Kennicutt (1983). For each galaxy a nuclear spectrum, to be reported upon later, was also obtained.
2.2 Observations
R band imaging was obtained with FORS1/VLT in april 2000, and was used to determine the positions of our targeted regions with sufficient accuracy. Subtracting a local average emission from the host galaxy the R band magnitudes of our target H ii regions were determined; typical magnitudes of 19–21 are found.
The spectroscopic observations of our sample of H ii regions were carried out with FORS1/VLT in the second 2001 trimester. Table 2 gives informations about the exact dates and meteorological conditions during the observations.
| galaxy | date | weather | seeing [”] | exp. time blue [s] | exp. time red [s] |
|---|---|---|---|---|---|
| NGC 3351 | 19.04.2001 | photometric | 0.8-1.0 | 1700 | 1700 |
| NGC 3521 | 25.04.2001 | clear | 1.6-2.0 | 1800 | 1800 |
| NGC 4254 | 23.05.2001 | clear | 1.1-1.4 | 900 | 900 |
| NGC 4303 | 23.05.2001 | clear | 0.8-1.1 | 750 | 750 |
| NGC 4321 | 19.06.2001 | photometric | 1.3-1.5 | 1050 | 1050 |
The spectral range from 3600 Å to 1 m was covered with a “blue” spectrum from 3600 to 6500 Å with grism 300V+10, and a “red” spectrum from 6000 to 10000 Å with grism 300I+11. The use of a 1″ slit width allowed to get medium spectral resolution of around 6 Å in the blue and 12 Å in the red. Due to the limited slit size, a fraction of the total nebular emission of the regions may be lost. This effect is acounted for in our interpretation of the data (Sect. 5). Unless WR stars follow systematically a different spatial distribution than other stars responsible for the continuum emission, a possible loss of continuum light does not alter our analysis.
Exposure times for each galaxy (see Table 2) were adapted to obtain in the continuum S/N 30 in the blue, (needed for a precise measure of the WR bump) and 10 in the red (needed to measure the [S iii] 9069,9532 lines). Spectrophotometric standard stars data were also acquired.
2.3 Data reduction and analysis
Reduction was carried out using the IRAF and MIDAS packages. The first steps consisted in the usual bias subtraction, flatfield division, and 2D wavelength calibration. Flux calibration was done using a standard atmospheric extinction curve and spectrophotometric standard stars. Given that the spectrophotometric standards were not always obtained during the night of the observations, we estimate an absolute flux accuracy of 10 %. In addition, due to the optimisation for a maximum multiplex, the observations were not taken at parallactic angle, leading to a slight mismatch between the blue and red spectra. A quantitative analysis of the effetcs of differential refraction has not been undertaken here. As the main diagnostics used in the present paper lie in a limited wavelength range, and the observations have been taken at small airmass, this should represent a negligible source of uncertainty.
For each H ii region, a background including sky emission and underlying emission from the galaxy was extracted from the slitlet sub-image. This procedure was non-trivial as this background spectrum had in most cases to be determined near the edges of the sub-image, where the wavelength calibration may slightly deviate from the one of the H ii region. Special care has been taken for the red spectra, since the sky emission was often several times brighter than the H ii region emission. We thus re-calibrated the background emission spectrum according to the H ii region by comparing the position (and sometimes the intensity) of the sky emission lines. This time-consuming operation gave very satisfying results and useable spectra up to 1 m for almost all H ii regions. The final 1D spectra were generally extracted with a 4 ″ wide aperture.
Line intensities and equivalent width were obtained by visually placing a continuum on both sides of the line and then integrating all over this range. Errors were estimated by moving the continuum upwards by half the value of the noise near the line position and re-computing the intensity and equivalent width.
Where possible the following nebular emission lines were measured: [O ii] 3727, the H Balmer line series including H to H9, He i 4471, [O iii] 4959,5007, [N ii] 5201, He i 5876, [O i] 6300, [N ii] 6548,6584, He i 6678, [S ii] 6717,6731, He i 7065, [Ar iii] 7136, [O ii] 7325, and [S iii] 9069,9532. If present, broad emission lines at 4680 Å (referred to subsequently as the (blue) WR bump), C iii 5696, and C iv 5808 indicative of Wolf-Rayet (WR) stars were also measured. The spectra were also inspected for the presence of stellar absorption lines like the Ca ii triplet, the CH G band at 4300 Å, Mg lines at 5200 Å, or TiO bands.
The spectra were deredened using the Whitford et al. (1958) extinction law as parametrised by Izotov et al. (1994) assuming an underlying absorption of 2 Å and an intrinsinc Balmer decrement ratio of .
All detailed results including finding charts, line measurements, and a detailed analysis of the nebular properties will be published in a forthcoming paper.
| Galaxy | # blue bump | # C iv 5808 | # C iii 5696 | cand. blue bump | cand. C iv 5808 | cand. C iii 5696 |
|---|---|---|---|---|---|---|
| NGC 3351 | 2 | 4 | 2 | |||
| NGC 3521 | 4 | 2 | 1 | 6 | 1 | 1 |
| NGC 4254 | 9 | 8 | 1 | 1 | 1 | |
| NGC 4303 | 9 | 4 | 3 | 3 | 2 | |
| NGC 4321 | 3 | 3 | 5 | 1 | 1 | |
| total | 27 | 14 | 8 | 15 | 6 | 10 |
3 Properties of the HII region sample
The properties of our galaxy sample as given by the NED database and the adopted distances, are summarised in Table 1. For NGC 3351 and the Virgo cluster member NGC 4321 we adopt the Cepheid distances from Freedman et al. (2001). The other two Virgo galaxies (NGC 4254, NGC 4303) are member of the same subgroup as NGC 4321 (Boselli, private communication). We therefore adopt an identical, approximate distance of 16 Mpc. The distance of NGC 3521 is taken from Tully’s (1998) Nearby Galaxy Catalog.
A total of 121 spectra were extracted from the 95 slitlets. Nebular emission lines were detected in 88 spectra; 85 correspond to extra-nuclear regions.

3.1 Metallicities
The metallicity O/H of the H ii regions has been estimated using the following empirical calibrations: the calibrations of Kobulnicky et al. (1999, hereafter KKP) using [O iii] 4959,5007/[O ii] 3727 and ([O iii] 4959,5007+[O ii] 3727)/H (=) based on the photoionisation model grid of McGaugh (1994), the similar -method of Pilyugin (1991), and the older calibrations of Edmunds & Pagel (1984) and Zaritsky et al. (1994).
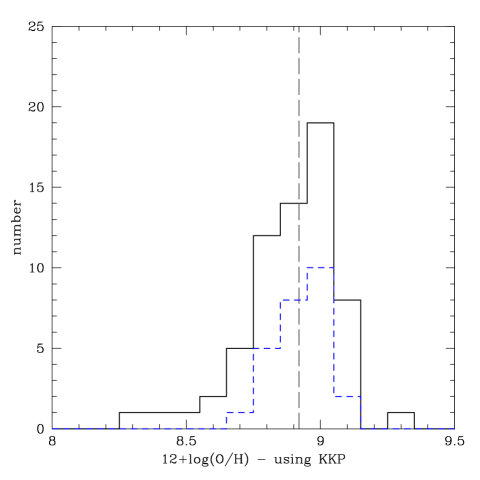
The O/H abundances obtained from these methods are compared in Fig. 1. Unsurprisingly rather large differences are obtained. As well known, at abundances 8.5–8.6 the various methods yield similar results, while the differences increase towards higher metallicities (see e.g. comparison in Pilyugin 2001). Systematically lower values are found from the -method of Pilyugin (2001). Although calibrated only for regions with , this could indicate a systematic overestimate of the absolute metallicities using the other methods. To ease comparisons with the recent study of BK02 of metal-rich H ii regions we subsequently adopt the KKP calibration by default except otherwise stated.
The metallicity distribution of our entire sample is shown in Fig. 2. The mean metallicity is (8.57 0.24) using the KKP (Pilyugin’s ) calibration. The vertical dashed line indicates the solar value (=8.92) adopted in McGaugh’s calculations used for the calibration of KKP.

3.1.1 Regions with direct determinations
The transauroral [O ii] 7325 line has been detected in 11 H ii regions allowing thus a direct determination of the electron temperature from [O ii] 7325/[O ii] 3727. Other potential electron temperature indicators, e.g. [S iii] 6312, [N ii] 5755, are too weak or could not be measured due to the limited spectral reolution. Electron densities are determined from [S ii] 6717,6731. O ii and the resulting ionic abundance ratios of O++/H+ and O+/H+ were derived using this temperature for both ions (the atomic data are those listed in Stasińska & Leitherer (1996).
As shown in Fig. 3 the resulting O/H abundances (assuming O/H O++/H++O+/H+) are on average found to be lower than those derived from the KKP calibration, the largest metallicity being closer to solar. However, the O/H derived here are lower limits, due to the strong temperature gradients expected at high metallicities (see Stasińska 2002). A deeper discussion of the abundances in our objects taking into account the observational constraints from the entire emission line spectrum is deferred to a forthcoming publication. For the purpose of the present paper, it is sufficient to note that the bulk of our H ii region sample with low values of have metallicities close to and above solar.

3.2 H luminosities, WR and O star populations
The histogram of the H luminosity of the H ii regions, as measured from our spectra, is shown in the upper panel of Fig. 4. As seen from this figure, 75 % of the H ii regions correspond to giant extra-galactic H ii regions characterised by erg s-1 (Kennicutt 1984, 1991), while the remainder are less luminous objects similar to normal Galactic H ii regions. The corresponding number of equivalent O7V stars 111 We compute taking the Lyman continuum flux of an O7V star from Vacca et al. (1996) and assuming case B recombination for 10000 K and 100 cm-3., plotted in the lower panel of Fig. 4, ranges from 0.15 O7V stars (i.e. presumably corresponding to 1 late O or early B stars) to 400 O7V stars for the brightest region.
Our search for WR features in metal-rich H ii regios proved quite successful yielding with 27 WR detections a sample of unprecedented size (cf. Castellanos 2001, Bresolin & Kennicutt 2002). The number of regions where different WR features were detected (hereafter called “WR regions”) at various levels of confidence are listed in Table 3. The certain WR detections (defined as detections) are listed in columns 2-4; “candidate” WR regions with emission line detections 1.1 2 are given in cols. 5-7. Visual inspection of the spectra yield essentially the same detection of the “certain” WR regions. To illustrate the quality of our data sample spectra of a secure WR region and a candidate region are shown in Fig. 5.

As also clear from Table 3, a large fraction of the WR regions shows signatures of WR stars of both WN and WC types as anticipated from theoretical expectations (Meynet 1995, SV98) and earlier studies of WR galaxies (Schaerer et al. 1997, 1999ab, Guseva et al. 2000). In our sample 50 % of WR regions show WC signatures; predictions from the Meynet (1995) and SV98 models yield 30–77 % at metallicities 0.008 – 0.040. At least 1/3 of the WR regions harbour WC stars of late subtypes (WCL), characterised by their strong C iii 5696 emission222It can be seen that C iv 5808 is not formally detected in all regions with C iii 5696 detections. However, in most of these cases (2 exceptions), C iv 5808 is weak, but likely present.. The C iii 5696/C iv 5808 ratio indicates subtypes WC7 or WC8 assuming that the contribution of WN stars to C iv 5808 is negligible; if this were not the case the mean spectral type could be of later subtype. So far relatively few WR “galaxies” (true starbursts or extra-galactic giant H ii regions) with WCL stars are known (cf. Schaerer et al. 1999b). However, as late WC types are expected to occur preferentially in metal-rich environments (Smith & Maeder 1991, Maeder 1991, Philipps & Conti 1992) the high detection rate of C iii 5696 is not surprising.
The H luminosity distribution of the WR regions is shown in Fig. 4 (upper panel, dashed line). Clearly, WR stars are only detected in the brightest regions. This is not due to the flux limit of our observations as can easily be seen by comparison of the smallest WRbump fluxes ( erg s-1 cm-2) with the detection limit of the faintest emission lines ( erg s-1 cm-2). In fact our observations are essentially deep enough to allow in all galaxies 333The few remaining “candidate” WR regions at high are all located in NGC 4321, have formally a WR detection at , and appear as rather clear WR detections at visual inspection. The observations of NGC 4321 may be of less good quality due to limited seeing conditions. the detection of the blue WR bump of just 2–3 WNL stars, assuming the average 4650-4686 Å bump luminosity of a WN7 stars of erg s-1 (cf. Smith 1991, Schaerer & Vacca 1998). The number of WNL stars derived in this way is plotted in the lower panel of Fig. 4 for regions with certain WR detections (filled squares) and “candidate” WR regions (open circles).
As our detection limit allows for the detection of few ( 2–3) average WNL stars, the subsample of the brightest regions with erg s-1 cm-2 could therefore represent a fairly complete sample of H ii regions “massive”/bright enough to allow a meaningful comparison between WR detections and non-detections. However, a possible bias against regions with small may exist (Sect. 2).
In this subsample containing a total of 47 regions we find 20 objects without WR signatures, or a fraction of 57 % regions with WR signatures. Such a high fraction of WR detections compares fairly well with the predictions of 60–80 % by Meynet (1995) and Schaerer & Vacca (1998) using the high mass loss stellar evolution tracks at metallicities for bursts with a standard Salpeter IMF and an upper mass cut-off Mup=120 M⊙. Given the fact that very young regions (ages 0 to 1.5–2 Myr) with large expected H equivalent widths are notoriously absent (in the present sample and other samples of H ii regions and galaxies) it is, however, not clear how significant this finding is.
4 Trends of WR populations with metallicity
4.1 Behaviour of the “WR bump”
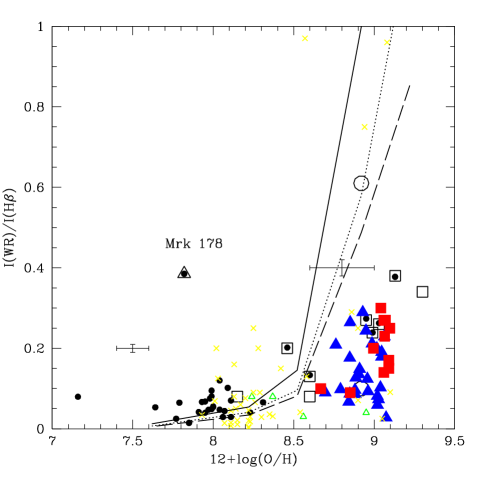
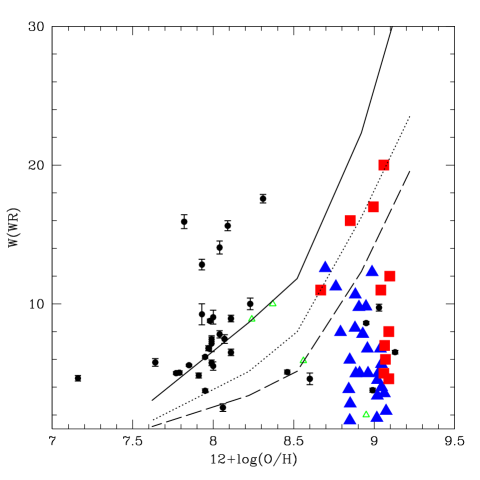
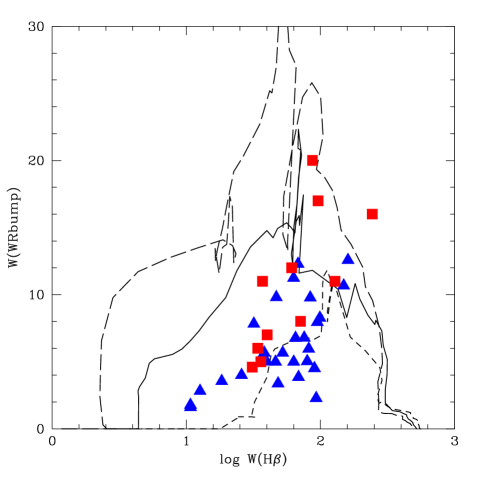
Figure 6 shows the WR bump intensities and equivalent widths as a function of metallicity for our metal-rich H ii regions (large filled triangles) and the 11 WR regions in spiral galaxies recently reported by Bresolin & Kennicutt (2002, large filled squares), together with data compiled by Schaerer (1999, small crosses) and Schaerer et al. (2000).
Our new measurements at high O/H are found to fill in the range from the previously observed maximum intensities/equivalent widths down to lower values. Physically the maxima of and are expected to reflect the maximum WR/O star ratio achieved in bursts. No lower limit is expected; if present in a given sample, such a lower limit presumably reflects the detection limit of the WR features.
The increase of the upper envelope of with metallicity is known since the work of Arnault et al. (1989) and has been reviewed by Schaerer (1999). With few exceptions, max() also seems to show an increase with O/H as shown here for the first time. The increase of max() is naturally interpreted as due to the increase of stellar wind mass loss with metallicity leading to lower minimum mass limit for the formation of WR stars, , thereby favouring the presence of WR stars at high metallicity (cf. Maeder et al. 1981, Arnault et al. 1989, Maeder 1991). Other effects, e.g. a lowering of the H flux due to a) increasing amounts of dust absorbing ionising radiation or b) lower average stellar temperatures at high O/H due to modified stellar evolution, could also play a role (cf. Schaerer 1999), but are likely secondary.
The maxima of the predicted WRbump intensities and equivalent widths computed with the code of SV98 with a “standard” Salpeter IMF for instantaneous bursts (solid line), and extended bursts of duration = 2 Myr (dotted), and 4 Myr (long dashed) are overplotted on Fig. 6. As already shown earlier (cf. Schaerer 1996, 1999, Mas-Hesse & Kunth 1999, Guseva et al. 2000) the range of observations at subsolar metallicities ( 8.6) is fairly well reproduced by the models, when accounting for the various uncertainties (e.g. missing H flux in slit observations, some objects with small numbers of WR stars, some poor spectra; cf. discussion in Guseva et al.). The new sample of metal-rich objects plotted here shows WRbump strengths smaller than the maxima predicted by the “standard” models. The possible reasons for this behaviour are discussed in Sect. 5 where detailed model comparisons are undertaken.
4.2 WC/WN ratio
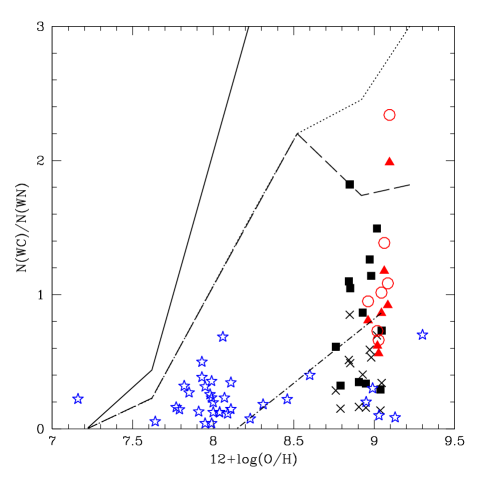
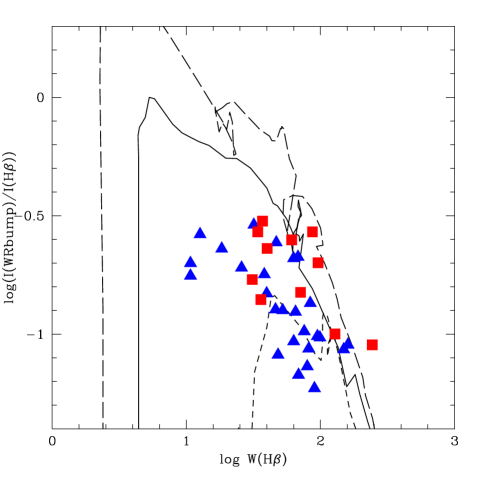
We have estimated the relative number ratio of WC and WN stars, shown in Fig. 7, in several ways. First the number of WN stars, assuming late WN subtypes dominate, is derived from the luminosity of the blue WR bump, as described above. The number of WC stars, , is estimated from the C iv 5808 or C iii 5696 luminosity where measured, again assuming that WN stars do not contribute to these lines. As the observed average luminosity of WC stars in these lines varies strongly with subtype (see SV98), the estimated depends on the assumption of the dominant WC subtype. As the observations (see above, Guseva et al. 2000, Schaerer et al. 1999a) indicate that early types ( WC4) dominate at low metallicity, while WC7-8 dominate at high , we assume these mean WC subtypes for the sample of Guseva et al. (2000). For our high metallicity sample, the estimated ratios is estimated adopting different assumptions on the WC subtype and using C iv 5808 or C iii 5696 (see Fig. 7).
The resulting estimates show a fairly clear trend of an increasing upper envelope for with metallicity. Furthermore, and in contrast with the limited sample of Guseva et al. (2000), we now find at the high metallicity end a number of objects with 0.5–1. and a WC/WN number ratio larger than the observed trend in Local Group galaxies by Massey & Johnson (1998), indicated by the dash-dotted line in Fig. 7. Indeed, while the regions observed by these authors are thought to correspond to averages large enough to represent the equilibrium value at constant star formation, larger (and obviously also smaller) values should be found in regions with fairly short bursts.
A more quantitative interpretation of the observed WC to WN ratio appears difficult for the following reasons. First the uncertainties in the estimated are quite large (cf. above); second, detailed evolutionary synthesis model predictions of depend quite strongly on the adopted interpolation techniques (cf. SV98, comparison between results from SV98 models and Starburst99 (Leitherer et al. 1999), also Massey 2002); third, other comparisons with synthesis models reveal potential difficulties (cf. below). In any case the SV98 models predict the maximum WC/WN number ratios indicated in Fig. 7 by the solid line for instantaneous bursts, and burst durations of 2 Myr (dotted) and 4 Myr (dashed) respectively.
5 Detailed comparison of WR populations with synthesis models
5.1 Procedure
To interpret quantitatively the observational data we use evolutionary synthesis models and proceed essentially as in SGIT00. The following main observational constraints are used:
-
1.
H and H equivalent widths. The former is used as a primary age indicator; once is reproduced may serve as an independent consistency test for the predicted spectral energy distribution (SED) in the red (cf. SGIT00).
-
2.
Nebular line intensities. (H)/(H) determines the extinction of the gas. The use of other line intensities requires detailed photoionization modeling which is beyond the scope of this paper.
-
3.
Intensities and equivalent widths of the main WR features. The blue bump and C iv 5808 (red bump) serve as main constraints on the WR population. To avoid uncertainties in deblending individual contributions of the blue bump we prefer to use measurements for the entire bump. In contrast to the spectra of metallicity objects our spectra show no evident contamination from nebular lines (e.g. [Fe iii] 4658, nebular He ii).
To potentially disentangle between various effects (underlying “non-ionizing” population, loss of photons, differential extinction between gas and stars) it is important to use both equivalent widths and relative intensities (cf. Schaerer et al. 1999a).
For the model comparisons we use calculations based on the evolutionary synthesis code of SV98, which in particular includes the most recent calibration of WR line luminosities used to synthesize the WR features, up-to-date stellar tracks, CoStar stellar atmospheres for O stars, pure H-He models for WR stars and Kurucz models for cooler stars (see SV98 for a full description). Except for the improved O star atmospheres used by SV98 the Starburst99 synthesis models (Leitherer et al. 1999) use the same basic input physics. New generation stellar atmosphere models for O and WR stars including a full treatment of non-LTE line blanketing and stellar winds have just now become available for the use in synthesis models (Smith et al. 2002). However, as the quantities of interest here depend only on the total number of Lyman continuum photons which is not altered, the use of these more sophisticated atmosphere models does not affect our results.
It is important to stress that in all cases the high-mass loss stellar tracks of Meynet et al. (1994) are used. It is thought that this adjustment of mass-loss, treated like a free parameter, will become ultimately obsolete when a proper treatment of the various effects of stellar rotation is made in the stellar evolution models. First results tend to indicate that this may indeed be the case (Meynet 1999). The Meynet et al. (1994) tracks are chosen as they reproduce a large number of properties of individual WR stars and WR populations (including especially relative WR/O ratios for a standard Salpeter IMF) in Local Group galaxies (Maeder & Meynet 1994). The use of other tracks (e.g. the “normal” mass loss tracks) which are known to disagree with these basic constraints on WR and O star populations, would imply a strong inconsistency with the Local Group data.
The basic model parameters we consider are:
-
a)
Metallicity. Stellar tracks covering metallicities , 0.008, 0.02 (solar), and 0.04.
-
b)
IMF slope and upper mass cut-off (Mup). We adopt a Salpeter IMF (slope =2.35), and Mup=120 M⊙ as our standard model.
-
c)
Star formation history (SFH). Models for instantaneous bursts (coeval population), extended burst durations (constant SF during period ; in this case age=0 is defined at the onset of SF, i.e. corresponds to that of the oldest stars present), and constant SF are considered.
-
d)
Fraction of ionizing Lyman continuum photons (). indicates the fraction of ionizing photons absorbed by the gas. Our standard value is . Values are used to simulate various effects (e.g. dust absorption, photon leakage outside regions, etc.) leading to a reduction of photons available for photoionization.
Unless stated otherwise our models are calculated assuming an IMF fully sampled over the entire mass range (as in SV98). For some cases we have also done model calculations based on a Monte Carlo sampling of the IMF, in order to quantify the effects of statistical fluctuations due to the finite number of massive stars. We have verified our calculations by comparison with the Monte Carlo models and analytical results of Cerviño et al. (2000, 2002).
5.2 Results
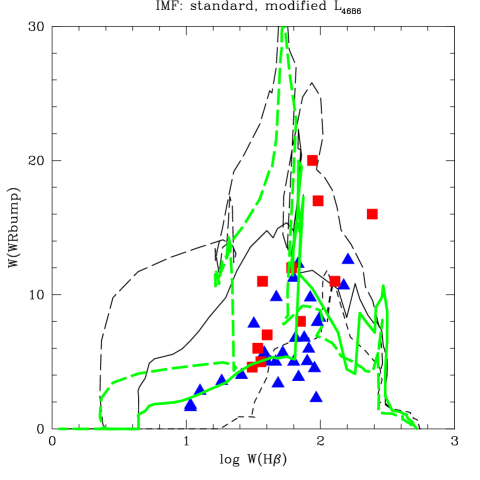
A comparison of the observed equivalent widths and relative intensity of the WR bump with standard model predictions at different metallicities is presented in Fig. 8. The following points can be seen from this Figure:
-
•
The observed trends of decreasing (increasing) equivalent width (line intensities) of the WR features with decreasing H equivalent width agree with the instantaneous burst model predictions over the same range. Though shorter, part of the initial phase of increasing (decreasing) () corresponding to the onset of the WR rich phase does not seem to be detected.
-
•
Most importantly, essentially all the observed WR features are weaker than the predictions of our standard models for instantaneous bursts at solar or higher metallicity. Very similar observational trends are also found in the metal-rich H ii region samle of BK02 and the metal-rich starbursts of Schaerer et al. (2000). This is in stark contrast with observations at lower metallicity where generally an good agreement is found with short burst models (e.g. Schaerer et al. 1999a, Guseva et al. 2000).
-
•
The above result is found independently from the observed WR equivalent widths and relative line intensities WRbump/H. This indicates that the discrepancy between models and observations is not related to the possible presence of an underlying older stellar population, which would dilute (reduce) equivalent widths but not alter the relative line intensities.
The following possibilities (one or a combination thereof) could be invoked to explain the discrepancy between our observations and models:
-
1.
The metallicities of our HII regions are overestimated. Indeed the observations could be reconciled with burst models with a “standard” IMF for metallicities (1/2.5–1) Z⊙, as shown in the left panel of Fig. 8 (short dashed line). However, despite the uncertainties in the O/H determinations (cf. Sect. 3) such low average metallicities seem very implausible.
-
2.
Extended bursts. Such a scenario has been invoked by SGIT00 for the sample of metal-rich starbursts based on the finding of red supergiant features in their spectra and the fact that these distant objects are mostly nuclear starbursts observed through apertures corresponding to relatively large spatial scales. In this case all observed properties could quite well be fitted with “standard” solar metallicity models for burst durations 4–10 Myr. However, in view of the different nature (disk H ii regions) of the present sample, indications of relatively short formation time scales of H ii regions (e.g. Massey et al. 1995), and the lack of direct signatures of older/red supergiant populations (cf. below) it seems quite unjustified to appeal to extended burst to solve the observed discrepancy.
-
3.
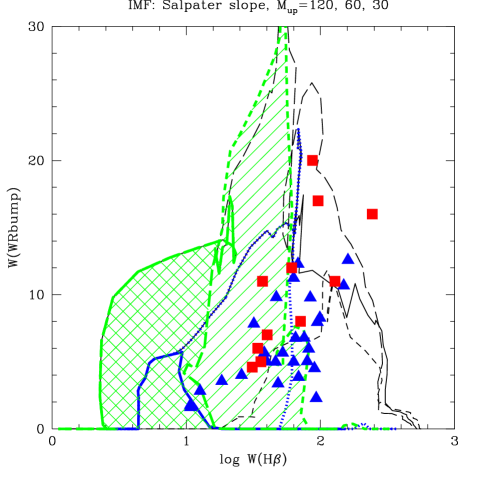
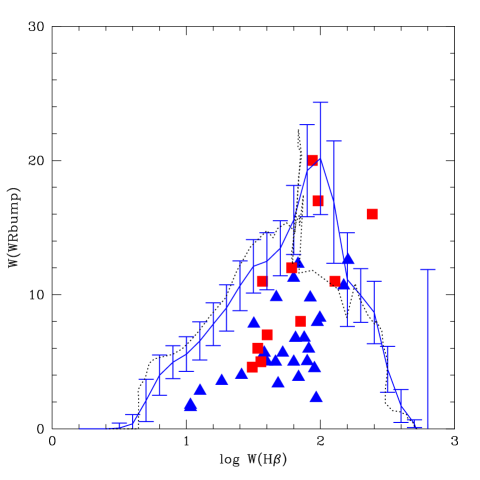
A modified IMF (upper mass cut-off and/or slope). In a plot like Fig. 8, a Salpeter IMF with a lower upper mass cut-off simply implies that the curve plotted here (for Mup=120M⊙) is joined at lower as the WR stars from the most massive stars are absent. This is illustrated for the cases of Mup 30 and 60 M⊙ by the shaded domains in Fig. 9. The shape of the predicted WR equivalent width or line intensity remains, however, unchanged. Therefore the observed discrepancy cannot be resolved with an IMF of Salpeter slope and a lower value of Mup (see also Sect. 6).
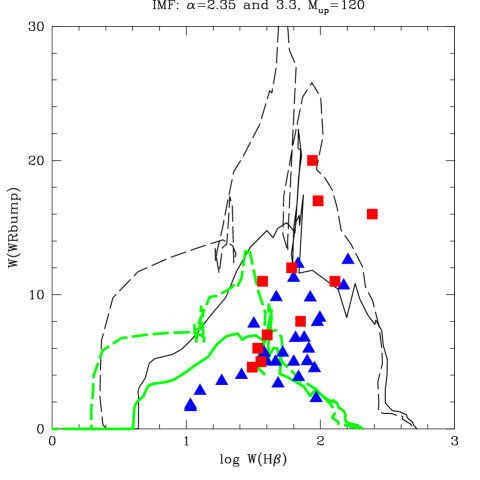
Models with steeper, variable IMF slopes () and Mup 60–120 M⊙ could reproduce most of the objects, with the exception of the lowest objects (see Fig. 9). As the least metal-poor objects in our sample are probably of similar nature as young clusters or H ii regions in our Galaxy whose stellar content has been studied in detail, we may presume that their IMF (slope and Mup) should be similar. Since none of the Galactic regions have shown convincing evidence of a strong deviation of the IMF slope from the Salpeter value (see Massey 1998 and references therein), we think that such a steeper slope is an unlikely explanation.
-
4.
Incorrect stellar evolution models and/or “calibration data”: Although the adopted tracks (Meynet et al. 1994) compare fairly well with various observations, several failures of the non-rotating stellar models are also known (see e.g. Maeder 1999). However, the used tracks have essentially been calibrated/adjusted to fit the observed WR/O ratio in various regions of our Galaxy and Local Group objects which are though to be at equilibrium, i.e. showing relative populations corresponding to constant star formation (see compilation in Maeder & Meynet 1994). The relative WR/O star ratio is the one most directly related to our (time resolved) observables. As this calibration yields a fairly good agreement over a large metallicity range () there seems little room for changes in the tracks which could reduce the predicted WRbump by the required factor of 2 without violating the WR/O constraints in the Local Group.
One could argue that the calibration data, the observed WR/O number ratio at solar metallicity and above could be incorrect due to possible incompleteness or biases in the stellar counts (see e.g. related discussions in Massey & Johnson 1998). However, to reconcile our WR observations in H ii regions with the corresponding counts for our Galaxy and M31 would require a downward revision of the relative WR/O ratio by up to a factor of 2, which seems highly unlikely.
-
5.
Uncertainties in synthesis of the WR bump: Presently the calculation of observables related to WR stars is simply done in the following way in evolutionary synthesis models. The different emission line strengths are computed by multiplying the predicted number of WR stars (grouped in different types and/or subtypes) with their average line luminosity as derived from observations of a sample of WR stars (see SV98). Interestingly the intrinsic line luminosity of the strongest line of the WR bump, He ii 4686, shows a rather large scatter, namely erg s-1 in the Galactic and LMC WNL calibration sample of SV98 with a possible increase of with the stellar bolometric luminosity (see Fig. 1 of SV98). Such a luminosity dependence of with could in fact (partly or fully) explain the observed discrepancy as we will now show.
Splitting the WNL calibration in two domains with luminosities above/below , SV98 found average line luminosities () and (). Replacing in the synthesis models the overall average for WNL stars by these quantities leads to an important reduction of in solar metallicity bursts with 60–70 Å, as shown in Fig. 10444At 0.04 one has a reduction of both in the early burst phase (ages 3.5 Myr) at 1.8 Å and after 6 Myr ( 1.35), while in between the models predict that WC stars dominate the bump (cf. SV98, Figs. 2 and 11).. At larger H equivalent widths (corresponding to ages 4–5 Myr for 0.02) the WRbump predictions are less modified, since a) WC stars contribute more importantly to the bump and b) only the youngest bursts with very high are dominated by very luminous WNL stars showing thus larger .
The last option (5) seems the most likely explanation to explain the surprisingly low WR equivalent widths and intensities in our sample of metal-rich H ii regions. Implications on earlier studies of WR galaxies are briefly discussed in Sect. 5.3.

In contrast, the following hypothesis or effects altering observed equivalent widths and/or relative line intensities cannot be the cause of the discrepancy:
-
•
Underlying (old) populations diluting the measurements. The line intensities are unaffected by underlying populations and show the same discrepancy as (cf. above). Furthermore, inspection of our spectra show little or no indication of signatures of older stellar populations.
-
•
Differential extinction between gas and stars as frequently observed in H ii galaxies and starbursts (cf. Fanelli et al. 1988, Calzetti 1997, Mas-Hesse & Kunth 1999, SGIT00). If present such an effect alters and but not . To bring the observations to agreement with standard models would require that the gas suffered a lower extinction than the stars (implying thus lower corrected and larger ), opposite to what is found empirically.
-
•
Leakage of ionising photons outside the observed regions, dust absorption of ionising photons, or other mechanisms reducing the fraction of Lyman continuum photons used for photoionisation. Correcting the observations for such an effect would increase the observed and decrease , which does not reconcile observations and theory (see Fig. 8).
-
•
Effects due to varying seeing conditions and limited slit widths could lead to a loss of nebular emission in the aperture or a fraction of the stellar light. The former was just discussed (“leakage”). If the WR distribution were systematically more extended than the other stars responsible of the continuum, this effect could lead to reduced WR bump equivalent widths. No such trend between and the seeing conditions is found.
-
•
Stochastical fluctuations of the IMF due to small number statistics of the massive stars, as invoked by Bresolin & Kennicutt (2002). Although indeed expected to introduce some scatter (see Cerviño et al. 2000, 2002) this effect cannot explain the discrepancy for several reasons. First, the sample discussed here is sufficiently large and shows clear observational trends with relatively small scatter. In addition, no systematic trend of (and ) with absolute scale, such as measured by the continuum luminosity or H luminosity, is observed in our sample as shown in Fig. 11. Second, Monte Carlo simulations we have undertaken for cluster sizes corresponding roughly to the observed average continuum luminosity of 555The model at young ages ( 1 Myr) is scaled to the observed value, implying a stellar mass of M⊙ for a Salpeter IMF between 0.8 (2.) and 120 M⊙. Accounting for somewhat older ages would yield a slightly larger mass. predict a typical relative scatter of 25 % (cf. Cerviño et al. 2002) – too small to account for the discrepancy – and no significant bias towards lower values as illustrated in Fig. 12.
-
•
The use of different stellar tracks, such as e.g. the Geneva tracks with standard mass loss tracks adopted by Bresolin & Kennicutt (2002) for the Monte Carlo models, which do not reproduce basic constraints of massive stars and stellar populations in Local Group objects cannot be a solution as they would lead to important inconsistencies (cf. discussion in Sect. 5.1).
5.3 Discussion
In Section 5.2 we have argued that, compared to the normal prescription used in our SV98 synthesis models, a different prescription should preferrably be adopted to predict more accurately the He ii 4686 emission from WN stars. As several earlier studies including ours (e.g. Schaerer 1996, 1999, Schaerer et al. 1999a, Guseva et al. 2000, SGIT00) are based on the use of the simple average He ii 4686 line luminosity of SV98 for WNL stars, it is important to assess if or to what extent the use of a luminosity dependent prescription would affect the results from previous studies.
To verify this we have recomputed several sets of models for sub-solar metallicities. The maxima of the WRbump intensity and (cf. Fig. 6) are only slightly modified (increased at 8.5, and decreased above) and lead to a somewhat smaller increase with O/H, improving the agreement with the observations. For metallicities 1/2 Z⊙ the predicted WR bump is found to be larger at all ages (as the bulk of WN stars are of high luminosity), whereas for higher metallicities both larger/smaller WRbump strengths are predicted depending on the burst age (), as for the cases shown in Fig. 10. These changes improve the comparison with observations at low (see e.g. Fig. 7 of Guseva et al. 2000). No clear statement can be made for intermediate metallicities. A better understanding of the dependence of the WR emission lines on the stellar parameters appears necessary to improve the accuracy of the predictions of WR features in evolutionary synthesis models. The impact of newly available stellar evolution models including the effects of rotation on interior mixing and mass loss on massive star populations remains also to be explored.
6 Constraining the upper end of the IMF
As shown above, and in contrast to previous studies considering WR populations in objects with sub-solar metallicities, the quantitative modeling of the WR features in metal-rich H ii regions is not straightforward. The reliability of constraints on the IMF obtained from modeling of the WR features appears thus unclear at present and other constraints are therefore desirable.
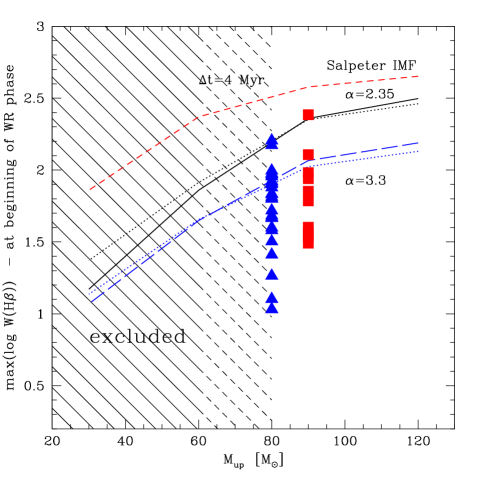
The maximum observed equivalent width of hydrogen recombination lines (e.g. ) of a large sample of star forming regions provide in principal a constraint on the upper mass cut-off of the IMF (e.g Kennicutt 1983, Leitherer et al. 1999). In practice, however, as well known but not understood to date, there is a notable absence of regions with as large as predicted for very young bursts with ages between 0 to 1.5–2 Myr. As the onset of the WR phase is expected after 2–3 Myr quite independently of the exact adopted stellar tracks (e.g. different mass loss scenarios) this sets a new clock, and therefore the H equivalent width of the youngest observed WR region also contains information on the value of Mup.
In Fig. 13 we show the dependence of the predicted at the beginning of the WR phase (i.e. the maximum of during this phase) on the upper mass cut-off for different IMF slopes in instantaneous bursts. The maximum depends little on metallicity (see the dotted lines) and on the choice of stellar tracks (not shown here). Overplotted are the observed in our WR region sample (triangles) and the sample of BK02 (squares) drawn at arbitrary Mup. The observed max() ( 2.2–2.4) indicates an upper mass cut-off of 80–90 M⊙ for a Salpeter IMF or 120 M⊙ for a steeper IMF with 3.3. From all the above considerations (Sect. 5) flatter slopes seem excluded. If the bulk of the regions were forming stars in extended bursts the deduced value of Mup has to be lower; for the example illustrated here (burst duration 4 Myr) this would correspond to 60 M⊙ for the Salpeter IMF.
It is important to note that the value of Mup derived in this way represents a lower limit. This is the case since all observational effects known to affect potentially the H equivalent width (loss of photons in slit or leakage, dust inside H ii regions, differential extinction, underlying population) can only reduce the observed . The observed represent therefore lower limits when compared to evolutionary synthesis models. We thus conclude that the available measurements in metal-rich H ii regions with WR stars yield a lower limit of 60–90 M⊙ for the upper mass-cut off of the IMF. Larger values of Mup are not excluded. This result is also compatible with our favoured models presented in Sect. 5 (see Fig. 10). Our new estimate of Mup, based only on a sample of WR regions, provides a more stringent limit than previous studies (SGIT00, BK02).
7 Conclusions
We have obtained high quality FORS1/VLT optical spectra of 85 disk H ii regions in the nearby spiral galaxies NGC 3351, NGC 3521, NGC 4254, NGC 4303, and NGC 4321. This sample, consisting in particular of a good fraction of objects with oxygen abundances presumably above solar (as estimated from using the calibration reported by Kobulnicky et al. 1999), provides an unprecedented opportunity to study stellar populations, nebular properties and ISM abundances in H ii regions at the high metallicity end. In this first paper we have presented the observational findings on spectral signatures from massive stars, and compared these with evolutionary synthesis models with the main aim of constraining the upper part of the IMF.
The average metallicity of our H ii region sample is using the calibration of Kobulnicky et al. (1999). For 12 regions we are able to determine the electron temperature from the transauroral [O ii] 7325 line, yielding lower limits on O/H (Sect. 3). For 6 regions we have been able to confirm a high metallicity ( 8.8–8.9). Detailed photoionisation modeling will be undertaken in the future to improve our abundance determinations and to include the full sample of H ii regions.
The spectra of a large number (27) of regions show clear signatures of the presence of Wolf-Rayet (WR) stars as indicated by broad emission in the blue WR bump ( 4680 Å). Including previous studies (Castellanos 2001, Bresolin & Kennicutt 2002, Castellanos et al. 2002b) our observations now nearly quadrupel the number of metal-rich H ii regions where WR stars are known. Approximately half (14) of the WR regions also show broad C iv 5808 emission attributed to WR stars of the WC subtype. The simultaneous detection of C iii 5696 emission in 8 of them allows us to determine an average late WC subtype ( WC7-WC8) compatible with expectations for high metallicities (Sect. 3).
Combined with existing observations of WR regions and WR galaxies at sub-solar our data confirm the continuation of previously known trends of increasing WRbump/H intensity with metallicity, establish also such a trend for , and allow us to estimate the trend of the WC/WN ratio with in extra-galactic H ii regions (Sect. 3)
The observed strength of the blue WR bump (relative line intensities and equivalent widths) shows quite clear trends with . Both and are found to be smaller than “standard” predictions from state-of-the-art evolutionary synthesis models (Schaerer & Vacca 1998) at corresponding metallicities. Various possibilities (including deviations of the IMF from a Salpeter slope and a “normal” high upper mass cut-off) which could explain this discrepancy have been discussed. The most likely solution is found with an improved prescription to predict the line emission from WN stars in synthesis models (Sect. 5). Using this new prescription the observed WR features are found to be broadly consistent with short bursts and a “standard” Salpeter IMF extending to high masses, as indicated by earlier studies at sub-solar metallicities.
Independently of the difficulties encountered to model the WR features in detail, the availability of a fairly large sample of metal-rich WR regions allows us to improve existing estimates (Schaerer et al. 2000, Bresolin & Kennicutt 2002) of the upper mass cut-off of the IMF. Independently of the exact tracks and metallicity we derive a lower limit for Mup of 60–90 M⊙ in the case of a Salpeter slope, and larger values for steeper IMF slopes, from the observed maximum H equivalent width of the WR regions. This constitutes a lower limit on Mup as all observational effects known to affect potentially the H equivalent width (loss of photons in slit or leakage, dust inside H ii regions, differential extinction, underlying population) can only reduce the observed . From our probe of the massive star content we therefore conclude that there is at present no direct evidence for systematic variations of the upper mass cut-off of the IMF in metal-rich environments, in contrast to some claims based on indirect nebular diagnostics (e.g. Goldader et al. 1997, Bresolin et al. 1999, Coziol et al. 2001). What the origin of this “universality” of the IMF is, remains an open question.
Acknowledgements.
We thank Paranal staff for assistance and carrying out of the service observations. DS is pleased to thank Miguel Cerviño, Thierry Contini, Jean-Francois Le Borgne, and David Valls-Gabaud for various interesting discussions, and Alessandro Boselli for comments on the Virgo structure.References
- (1) Arnault, P., Kunth, D., Schild, H., 1989, A&A, 224, 73
- (2) Bresolin, F., Kennicutt, R. C., , 2002, ApJ, 572, 838
- (3) Bresolin, F. , Kennicutt, R. C., Garnett, D. R., 1999, ApJ, 510, 104
- (4) Calzetti, D., 1997, AJ, 113, 162
- (5) Castellanos, M., 2001, PhD thesis, Universida Autónoma de Madrid, Spain
- (6) Castellanos, M., Díaz, A.I. & Terlevich, E. 2002a, MNRAS, 329, 315
- (7) Castellanos, M., et al., 2002b, MNRAS, submitted
- (8) Cerviño, M., Luridiana, V., Castander, F.J., 2000, A&A, 360, L5
- (9) Cerviño, M., Vall-Gabaud, D., Luridiana, V., Mas-Hesse, J.M., 2002, A&A, 381, 51
- (10) Conti, P. 1991, ApJ, 377, 115
- (11) Coziol, R., Doyon, R., Demers, S. 2001, MNRAS, 325, 1081
- (12) Díaz, A.I., Castellanos, M., Terlevich, E., García-Vargas, M.L., 2000, MNRAS, 318, 462
- (13) Edmund, M.G. & Pagel, B.E.J., 1984, MNRAS, 211, 507
- (14) Fanelli, M., O’Connell, R., Thuan, T. 1988, ApJ, 334, 665
- (15) Freedman, W.L., et al., 2001, ApJ, 553, 47
- (16) García-Vargas, M.L., 1996, in “From Stars to Galaxies”, Eds. C. Leitherer, U. Fritze-v. Alvensleben, J. Huchra, ASP Conf. Series, Vol. 98, 244
- (17) Gilmore, G., Howell, D. 1998, Eds., “The Stellar Initial Mass Function”, ASP Conf. Series, Vol. 142
- (18) Goldader, J.D., Joseph, R.D., Doyon, R., & Sanders, D.B. 1997, ApJ, 474, 104
- (19) González Delgado, R.M. 2001, in “Extragalactic Star Clusters”, Eds. E.K. Grebel, D. Geisler, D. Minniti, ASP Conf. Series, in press (astro-ph/0106297)
- (20) González Delgado, R.M., Leitherer, C., Stasinka, G., Heckman, T., 2002, ApJ, submitted
- (21) Guseva, N. G., Izotov, Y. I., Thuan, T. X., 2000, ApJ, 531, 776 (GIT00)
- (22) Izotov Y. I., Thuan T. X., Lipovetsky V. A., 1994, ApJ, 435, 647
- (23) Hodge, P., Kennicutt, R.C., 1983, AJ, 88, 296
- (24) Kennicutt, R.C., 1983, ApJ, 272, 54
- (25) Kennicutt, R.C., 1984, ApJ, 287, 116
- (26) Kennicutt, R.C., 1991, in “Massive Star in Starbursts”, Eds. C. Leitherer, N. Walborn, T. Heckman, C. Norman, Cambridge Univ. Press, 157
- (27) Kobulnicky, H.A., Kennicutt, R.C., Pizagno, J.L., 1999, ApJ, 514, 544 (KKP)
- (28) Kunth, D., Schild, H., 1986, A&A, 169, 71
- (29) Leitherer, C., 1998, in “The Stellar Initial Mass Function”, ASP Conf. Series, Vol. 142, 61
- (30) Leitherer, C., Schaerer, D., Goldader, J.D., et al., 1999, ApJS, 123, 3
- (31) Maeder, A., 1991, A&A, 242, 93
- (32) Maeder, A., 1999, in “The Stellar Content of Local Group Galaxies”, IAU Symp. 192, Eds. P. Whitelock, R. Cannon, 291
- (33) Maeder, A., Conti, P.S., 1994, ARA&A, 32, 227
- (34) Maeder, A., Meynet, G., 1994, A&A, 287, 803
- (35) Maeder, A., Lequex, J., Azzopardi, M, 1981, A&A, 90, L17
- (36) Mas-Hesse, J. M., Kunth, D., 1999, A&A, 349, 765
- (37) Massey, P., 1998, in “The Stellar Initial Mass Function”, ASP Conf. Series, Vol. 142, 17
- (38) Massey, P., 2002, in IAU Symp. 212, Eds. K. van der Hucht, A. Herrero, C. Esteban, in press
- (39) Massey, P., Johnson, O., 1998, ApJ, 505, 793
- (40) Massey, P., Johnson, K.E., Degioia-Eastwood, K., 1995, ApJ, 454, 151
- (41) McGaugh, S.S., 1994, ApJ, 426, 135
- (42) Meynet, G., 1995, A&A, 298, 767
- (43) Meynet, G., 1999, in “Massive Stellar Clusters”, Eds. A. Lançon, C.M. Boily, ASP Conf. Series, Vol. 211, 105
- (44) Meynet, G., Maeder, A., Schaller, G., Schaerer, D., Charbonnel, C., 1994, A&AS, 103, 97
- (45) Oey, M. S. & Kennicutt, R.C., 1993, ApJ, 411, 137
- (46) Philips, A.C., Conti, P.S., 1992, ApJ, 395, L91
- (47) Pilyugin, L.S., 2001, A&A, 369, 594
- (48) Schaerer, D., 1996, ApJ 467, L17
- (49) Schaerer, D., 1999, in “Wolf-Rayet Phenomena in Massive Stars and Starburst Galaxies”, IAU Symp. 193, 539
- (50) Schaerer, D. 2000, in Stars, Gas and Dust in Galaxies: Exploring the Links, Eds. D. Alloin, K. Olsen, & G. Galaz, ASP Conf. Series, Vol. 221, 99
- (51) Schaerer, D., Contini, T., Kunth, D., Meynet, G., 1997, ApJ, 481, L75
- (52) Schaerer, D., Contini, T., Kunth, D., 1999a, A&A, 341, 399 (SCK99)
- (53) Schaerer, D., Contini, T., Pindao, M., 1999b, A&AS, 136, 35
- (54) Schaerer, D., Guseva, N.G., Izotov, Y.I., Thuan, T.X., 2000, (SGIT00)
- (55) Schaerer, D., Vacca, W. D., 1998, ApJ 497, 618 (SV98)
- (56) Shields, G.A., Skillman, E.D., & Kennicutt, R.C., 1991, ApJ, 371, 82
- (57) Smith, L. F. 1991, in “Wolf-Rayet Stars and Interrelations with Other Stars in Galaxies”, IAU Symp. 143, eds. K. A. van der Hucht & B. Hidayat, (Dordrecht: Kluwer), p. 601
- (58) Smith, L.F., Maeder, A., 1991, A&A, 241, 77
- (59) Smith, L.J., Norris, R.P.F., Crowther, P.A., 2002, MNRAS, in press
- (60) Stasińska, G., 2002, in “Cosmochemistry: the melting pot of elements”, XII Canary Islands Winter School of Astrophysics, in press
- (61) Stasińska, G., Leitherer, C., 1996, ApJ, 107, 661
- (62) Thornley, M.D., Forster Schreiber, N.M., Lutz, D., Genzel, R., Spoon, H. W. W., Kunze, D., & Sternberg, A. 2000, ApJ, 539, 641
- (63) Tremonti, C., Calzetti, D., Leitherer, C., Heckman, T., 2001, ApJ, 555, 322
- (64) Tully, R.B., 1998, Nearby Galaxies Catalog, Cambridge: Cambridge Univ. Press
- (65) Vacca, W. D., Garmany, C.D., Shull, M.J., 1996, ApJ, 460, 914
- (66) Whitford, A.E., 1958, AJ, 63, 201
- (67) Zaritsky, D., Kennicutt, R.C., Huchra, J.P., 1994, ApJ, 420, 87