Exploring the spectral properties of faint
hard X-ray sources with XMMNewton
We present a spectroscopic study of 41 hard X-ray sources detected serendipitously with high significance (5 in the 2-10 keV band) in seven EPIC performance/verification phase observations. The large collecting area of EPIC allows us to explore the spectral properties of these faint hard X-ray sources with 280 10-14 erg cm-2 s-1 even though the length of the exposures are modest (20 ks). Optical identifications are available for 21 sources of our sample. Using a simple power law plus Galactic absorption model we find an average value of the photon index 1.6-1.7, broadly consistent with recent measurements made at similar fluxes with ASCA and with Chandra stacked spectral analyses. We find that 31 out of 41 sources are well fitted by this simple model and only eight sources require absorption in excess of the Galactic value. Interestingly enough, one third of these absorbed sources are broad line objects, though with moderate column densities. Two sources in the sample are X-ray bright optically quiet galaxies and show flat X-ray spectra. Comparing our observational results with those expected from standard synthesis models of the cosmic X-ray background (CXB) we find a fraction of unabsorbed to absorbed sources larger than predicted by theoretical models at our completeness limit of 5 10-14 erg cm-2 s-1. The results presented here illustrate well how wide-angle surveys performed with EPIC on board XMM-Newton allow population studies of interesting and unusual sources to be made as well as enabling constraints to be placed on some input parameters for synthesis models of the CXB.
Key Words.:
Galaxies: active; X–rays: galaxies; X–rays: diffuse background1 Introduction
It is now widely accepted that the bulk of the Cosmic X-ray background (CXB) in the range 0.1-10 keV is the result of the integrated emission of unresolved sources over cosmic time (Giacconi et al. 2001). Recent extremely deep surveys by Chandra (Tozzi et al. 2001; Brandt et al. 2001a) and XMM-Newton (Hasinger et al. 2001), have resolved up to 75-90% of the CXB into discrete sources, down to a limiting 2-10 keV flux of 10-16 erg cm-2 s-1. On-going follow-up optical identification programs suggest that most of these sources are AGNs, while a sizeable fraction of the rest are optically faint (24) objects (30%), likely to be highly obscured AGNs (Alexander et al. 2001) or luminous bulge-dominated galaxies (Barger et al. 2001, Cowie et al. 2001). Large area surveys (e.g. from ASCA and BeppoSAX; Akiyama et al. 2000; Della Ceca et al. 1999; Giommi, Perri & Fiore 2000), limited to higher fluxes but providing a larger number of sources, confirm the above results. At a flux limit of 5 10-14 erg cm-2 s-1 in the range 5-10 keV, the bulk of the sources are broad line AGNs, while most of the others are classified as Seyfert 1.8-2 galaxies and optically ’red’ quasars (La Franca et al. 2000). Surprisingly, Chandra serendipitously discovered that also some normal galaxies, without evidence for any activity (i.e. AGN and/or starburst) in the optical band, are X-ray loud (Fiore et al. 2000).
To date very few X-ray spectra of such faint sources are reported in the literature (but see pioneering results from Vignali et al. 2000; Sakano et al. 1998 and Crawford et al. 2001). Such spectral information is crucial in order to accurately determine source-by-source the amount of absorption, the spectral shape and the presence of reprocessed features (see e.g. Yaqoob 2000). These can also be used as input parameters for the synthesis models of the CXB in order to evaluate the contribution of the various AGN types and constrain their evolution (Comastri et al. 2001; Gilli, Salvati & Hasinger 2001). Important questions are still unanswered, such as the relationship between optical identification and X-ray characteristics as well as the role of absorption in the different types of active galaxies (Salvati & Maiolino 2000; Pappa et al. 2001a). There is growing evidence that not only narrow line but also broad line AGNs suffer from intrinsic absorption (Risaliti et al. 2000), which is present both in radio-quiet (Gallagher et al. 2000; Brandt al. 2001b; Maloney & Reynolds 2001; Collinge & Brandt 2000) and in radio-loud objects (Cappi et al. 1997; Yuan et al. 2000; Sambruna, Eracleous & Mushotzky 1999) at all redshifts. These obscured sources show hard spectral indices which match well with the CXB slope in the hard X-ray band (1.4, e.g. Marshall et al. 1980). Moreover doubts are emerging about the existence of the long sought after high luminosity type 2 AGNs (Halpern,Turner & George 1999), the so-called QSO 2s, which should play a significant (and perhaps a major) role in the production of the hard CXB (Fabian & Iwasawa 1999): from recent deep observations only two cases have been reported (Norman et al. 2001 and Stern et al. 2001). It would appear to be difficult to discover a large number of distant Compton-thick QSOs with present X-ray observatories (Fabian, Wilman & Crawford 2001).
Based on the above arguments, we have started an extensive program with XMM-Newton aimed at studying the brightest (in the hard X-ray band) sources serendipitously detected in a number of fields with moderate exposure (20 ks). This work has been designed to complement at an intermediate flux level (10-14 erg cm-2 s-1) the X-ray population studies made by very deep pencil-beam observations. On account of its good positional accuracy (6 arcsec error radius) and its unprecedented sensitivity in the 2-10 keV band, the XMM-Newton satellite is currently the most appropriate telescope with which to pursue such a study.
| Field | R.A. | Dec. | Orbit | Date | Exposure (s) | Filter | ||
|---|---|---|---|---|---|---|---|---|
| PN | M1 | M2 | PN M1 M2 | |||||
| PKS0312770 | 03 11 55.0 | 76 51 52 | 057 | 2000-03-31 | 26000 | 25000 | 24000 | Tc Tc Tc |
| MS1229.26430 | 12 31 32.0 | 64 14 21 | 082 | 2000-05-20 | 22900 | 18600 | 22900 | Th Th Th |
| IRAS133492438 | 13 37 19.0 | 24 23 03 | 097 | 2000-06-20 | 41300 | 38600 | Me Th | |
| Abell 2690 | 00 00 30.0 | 25 07 30 | 088 | 2000-06-01 | 21000 | 16600 | 15300 | Me Me Me |
| MS 0737.9744 | 07 44 04.5 | 74 33 49 | 063 | 2000-04-12 | 15000 | 17800 | 26100 | Th Th Th |
| Markarian 205 | 12 21 44.0 | 75 18 37 | 075 | 2000-05-07 | 17000 | 14800 | Me Me | |
| Abell 1835 | 14 01 02.0 | 02 52 41 | 101 | 2000-06-27 | 22900 | 23700 | 26400 | Th Th Th |
Optical blocking filters used during observations: Th=thin, Me=medium and Tc=thick.
2 XMM-Newton observations
2.1 Data reduction
The XMM-Newton observatory was launched on December 10th 1999 and was placed in a 48 hour orbit (Jansen et al. 2001). EPIC (European Photon Imaging Cameras) on-board XMM-Newton consists of two MOS CCD front-illuminated arrays (Turner et al. 2001) and one PN CCD back-illuminated array (Struder et al. 2001) for X-ray imaging and spectroscopy in the range 0.1-10 keV. Each camera is located in the focal plane of one of three X-ray grazing incidence telescopes and provides a 30 arcmin diameter field of view. EPIC is equipped with a filter wheel which carries three different blocking filters, i.e. Thin (40 nm Al), Medium (80 nm Al) and Thick (200 nm Al), optimised for different investigations.
In the present study we investigate the EPIC fields of seven observations performed during the performance/verification phase. These fields are listed in Table 1 together with their observational details. They cover in total an area of 1.4 deg2 of the sky and they all have b30 deg so that we can exclude heavy contamination from Galactic sources and high Galactic column densities along the line of sight. We are able to reach 4-5 arcsec absolute pointing accuracy reconstruction for the boresight instruments using the Attitude History Files (AHFs) available for all datasets, as demonstrated by the EPIC calibrations (for more details see http://xmm.vilspa.esa.es/users/calib-top.html).
The raw EPIC observation data files (ODFs) are reduced and analysed using the standard Science Analysis System () software package (version 5.0, released in 2000, December 15th; Gondoin 2001). We use the EPCHAIN and EMCHAIN tasks for the pipeline processing of the ODFs to generate the corresponding event files. These tasks also allow dead and hot pixels to be removed. On each event file we then apply an exposure time correction in order to exclude intervals contaminated by soft proton flares: we extract background lightcurves at energy 10 keV to identify and remove periods of high count rates (typically 0.2 ctss). The resulting clean integration times for each EPIC camera are listed in Table 1. We select pixel patterns 12 and =0 for MOS and PN events, respectively, in order to filter out cosmic-ray tracks and/or spurious noise events not created by X-rays. We use the XMMSELECT task to filter data and to generate lightcurves, images and spectra. All our images are binned to obtain a pixelsize of 4.44.4 arcsec.
2.2 Sample creation
We have created a 2-10 keV PN image of all but one (IRAS13349+2438) of the fields listed in table 1 which have then been used to detect hard X-ray serendipitous sources. The PN observation of IRAS13349+2438 was carried out in small window mode (Studer et al. 2001) and so we have used a 2-10 keV MOS1 image of this field. We investigate in the 2-10 keV range because to date it is the nearest X-ray spectroscopically accessible band to the CXB peak at 30 keV. The main reason for which we choose the PN camera to perform such a survey is its greater effective area with respect to the MOS (in particular in the hard band it is a factor 2.5 times at 8 keV), which enables us to be more accurate in the detection of faint hard X-ray sources.
In the following we briefly summarize our detection procedure. For each 2-10 keV image we generate an exposure map containing information about filter transmission and spatial quantum efficiency which has been used by other tasks of the detection chain. The area of the image where source searching is performed is marked by a detection mask created by the EMASK task. We run the EBOXDETECT task, the standard sliding box cell detection algorithm, with local background subtraction (i.e. ’local mode’) in order to have a list of candidate sources. This list is given as input to the ESPLINEMAP task to produce a smooth background map. This background map is then used in a second EBOXDETECT procedure (i.e. ’map mode’). We choose =–ln()=15 as the minimum detection likelihood value corresponding to a probability of Poissonian random fluctuations of the counts in the detection cell of =3.0 10-7 (roughly 5). EBOXDETECT generates a list of selected sources with their centroid coordinates . Finally we include in our sample only those sources detected with at least 35 net counts in a 55 pixel box centered on . These counts are raw and they must be corrected for both the energy encircled fraction (EEF) and the vignetting factor: in this way our selection criterion (i.e. 35 counts) corresponds, for example, to a corrected final flux of 2.3 10-14 erg cm-2 s-1 for an on-axis source and to 5 10-14 erg cm-2 s-1 for a 10 arcmin off-axis source in our shortest PN exposure (i.e. 15 ks, see Table 1). As the PN and MOS FOVs differ slightly we also perform the detection procedure described above on the MOS images in order to detect those sources which lie in the gaps between the PN chips or out of the PN FOV. The selection criterion remains the same, except for the fact that in this case we accept only sources having at least 20 net counts in a 55 pixel box centered on . In this way we include a further 4 sources (2 in the gaps and 2 out of the FOV) which were previously undetected. In total we obtain a sample of 41 hard X-ray selected serendipitous sources. They are listed in Table 2.
| N | Source name | R.A. | Declination | z | Classification |
|---|---|---|---|---|---|
| (J2000) | (J2000) | ||||
| PKS 0312-770 field | |||||
| 1 | CXOUJ031015.9-765131 | 03 10 15.3 | 76 51 32 | 1.187 | BL AGNa |
| 2 | CXOUJ031209.2-765213 | 03 12 08.7 | 76 52 11 | 0.89 | BL AGNa |
| 3 | CXOUJ031238.9-765134 | 03 12 38.8 | 76 51 31 | 0.159 | Galaxya |
| 4 | CXOUJ031253.8-765415 | 03 12 53.5 | 76 54 13 | 0.683 | Red QSOa |
| 5 | CXOUJ031312.1-765431 | 03 13 11.5 | 76 54 28 | 1.124 | BL AGNa |
| 6 | CXOUJ031314.5-765557 | 03 13 14.2 | 76 55 54 | 0.42 | BL AGNa |
| 7 | XMMUJ030911.9-765824 | 03 09 11.6 | 76 58 24 | 0.268 | Sey 2b |
| 8 | XMMUJ031049.6-763901 | 03 10 49.5 | 76 39 01 | 0.380 | BL AGNb |
| 9 | XMMUJ031105.1-765156 | 03 11 05.1 | 76 51 56 | No cl. | |
| MS1229.2+6430 field | |||||
| 10 | XMMUJ123110.6+641851 | 12 31 10.6 | 64 18 51 | No cl. | |
| 11 | XMMUJ123116.3+641114 | 12 31 16.3 | 64 11 14 | No cl. | |
| 12 | XMMUJ123218.6+640309 | 12 32 18.6 | 64 03 09 | No cl. | |
| 13 | XMMUJ123214.2+640459 | 12 32 14.2 | 64 04 59 | No cl. | |
| 14 | XMMUJ123013.4+642505 | 12 30 13.4 | 64 25 05 | No cl. | |
| 15 | XMMUJ123049.9+640845 | 12 30 49.9 | 64 08 45 | No cl. | |
| 16 | XMMUJ123058.5+641726 | 12 30 58.5 | 64 17 26 | No cl. | |
| IRAS13349+2438 field | |||||
| 17 | XMMUJ133730.8+242305 | 13 37 30.8 | 24 23 05 | No cl. | |
| 18 | XMMUJ133649.3+242004 | 13 36 49.3 | 24 20 04 | No cl. | |
| 19 | XMMUJ133807.4+242411 | 13 38 07.4 | 24 24 11 | No cl. | |
| 20 | XMMUJ133747.4+242728 | 13 37 47.4 | 24 27 28 | No cl. | |
| 21 | XMMUJ133712.6+243252 | 13 37 12.6 | 24 32 52 | No cl. | |
| Abell 2690 field | |||||
| 22 | XMMUJ000031.7-255459 | 00 00 31.7 | 25 54 59 | 0.283 | BL AGNb |
| 23 | XMMUJ000122.8-250019 | 00 01 22.8 | 25 00 19 | 0.968 | BL AGNb |
| 24 | XMMUJ000027.7-250441 | 00 00 27.7 | 25 04 41 | 0.335 | BL AGNb |
| 25 | XMMUJ000100.0-250459 | 00 01 00.0 | 25 04 59 | 0.851 | BL AGNb |
| 26 | XMMUJ000102.5-245847 | 00 01 02.5 | 24 58 47 | 0.433 | BL AGNb |
| 27 | XMMUJ000106.8-250845 | 00 01 06.8 | 25 08 45 | ||
| MS 0737.9+744 field | |||||
| 28 | 1E0737.0+7436 | 07 43 12.5 | 74 29 35 | 0.332 | BL AGNc |
| 29 | XMMUJ074350.5+743839 | 07 43 50.5 | 74 38 39 | No cl. | |
| 30 | 1SAX J0741.9+7427 | 07 42 02.2 | 74 26 24 | No cl. | |
| 31 | XMMUJ074351.5+744257 | 07 43 51.5 | 74 42 57 | No cl. | |
| 32 | XMMUJ074401.5+743041 | 07 44 01.5 | 74 30 41 | No cl. | |
| Markarian 205 field | |||||
| 33 | MS1219.9+7542 | 12 22 06.6 | 75 26 14 | 0.238 | NELGd |
| 34 | MS1218.6+7522 | 12 20 52.0 | 75 05 29 | 0.646 | BL AGNd |
| 35 | XMMUJ122258.3+751934 | 12 22 58.3 | 75 19 34 | 0.257 | NELGd |
| 36 | XMMUJ122351.3+752224 | 12 23 51.3 | 75 22 24 | 0.565 | BL AGNd |
| 37 | NGC4291 | 12 20 15.9 | 75 22 09 | 0.0058 | Galaxyd |
| Abell 1835 field | |||||
| 38 | XMMUJ140127.7+025603 | 14 01 27.7 | 02 56 03 | 0.265 | BL AGNb |
| 39 | XMMUJ140053.0+030103 | 14 00 53.0 | 03 01 03 | 0.573 | BL AGNb |
| 40 | XMMUJ140130.7+024529 | 14 01 30.7 | 02 45 29 | No cl. | |
| 41 | XMMUJ140145.0+025330 | 14 01 45.0 | 02 53 30 | † | Gal.b,† |
Optical classifications and redshifts are from: (a) Fiore et al. (2000), (b) Fiore et al. 2002 (F02; in prep.), (c) Wei et al. (1999) and (d) AXIS (Barcons et al. 2001). (†) There are two possible candidates for the identification of this source: an elliptical galaxy at =0.251 or an elliptical galaxy at =0.254 (F02).
2.3 Spectral analysis
All spectra are extracted in the 0.3-10 keV band where EPIC is best calibrated. The corresponding background regions are extracted from offset positions close to the sources, in source-free regions and with the same radii of the source regions (i.e. 35 arcsec). For a few cases, the extraction radius was reduced due to the presence of another nearby source or of the CCD gaps. The latest response matrices (released in July 2001) for the corresponding filters are used for the analysis. All our spectra are also corrected for vignetting. It is worth noting, however, that for off-axis angles 10 arcmin the vignetting function is energy independent below 5 keV for all EPIC detectors (with a ratio between off-axis and on-axis counts of 0.6, Gondoin et al. 2000): since 80% of our sources (32 out of 41) are detected within 10 arcmin off-axis the spectral correction for vignetting is only significant for a small number of sources. Therefore we expect little or almost negligible contamination in the determination of the spectral parameters during our analysis. For each source of the sample, we perform a combined spectral fitting using the data of both MOS and PN detectors, whenever both datasets are available. Before spectral fitting, all spectra are binned with a minimum of 20 counts per bin in order to be able to apply the minimization technique. In the cases of relatively poor statistics (i.e 400 final counts in the 0.3-10 keV band) the minimun number of counts per bin is set to 15 and we apply the Gehrels weighting method (Gehrels 1986) in our analysis. However heavy binning of data with poor statistics can result in a loss of spectral information, so for a worthwhile comparison we also use the Cash statistic (Cash 1979) to estimate the fit parameters and their errors in the PN data analysis of those sources characterized by only few photons. This is a maximum likelihood method which allows the use of unbinned data but it assumes that the counts in a given channel follow a Poisson distribution, so that it cannot be applied to background-subtracted data. Hence before performing spectral modelling we accurately parameterize the background in a large source-free region with a model consisting of a broken power law plus gaussian lines as suggested in Lumb et al. (2002). Then we include this model for the background (fixing the values of the parameters and rescaling the normalizations to the area of the extraction region of the source) in the source spectral parameterization. However the use of the Cash statistic has a major disadvantage in that it does not provide a goodness-of-fit criterion for comparing different models: therefore in order to establish the best fit model for a source we apply the statistic with the Gehrels weighting method and the -test. The spectral analysis is carried out using XSPEC v11.0. In computing fluxes and luminosities of our sources, we apply an encircled energy correction factor in order to take into account the EPIC energy encircled fraction (Ghizzardi 2001). All luminosities are calculated with =50 km s-1 Mpc-1 and =0. Throughout the paper, errors are given at the 90% confidence level for one interesting parameter (=2.71; Avni 1976).
3 Results
3.1 Optical and radio properties of the sample
As reported in Table 2, 21 of our 41 X-ray sources (50% of the sample) are already optically identified: 9 from the literature, 4 from the XMM-Newton International Survey program (AXIS, Barcons et al. 2001) and 10 from Fiore et al. (in preparation, hereafter F02). Of these, the majority (15) are broad line AGNs, 2 are narrow emission line galaxies (NELGs), 1 is a Seyfert 2 galaxy, 2 are normal galaxies and one is a red quasar. Source n.41 has two possible optical counterparts, both of which are normal elliptical galaxies at =0.251 and =0.254, respectively (F02). The redshift distribution of these optically identified sources is shown in Fig. 1.

Source n.3 (CXOU J031238.9765134) was first discovered by Chandra and identified with a bulge dominated normal galaxy without strong optical emission lines at =0.158 (called ’P3’ in Fiore et al. 2000). Combined with its high X-ray luminosity, this makes it a classic example of an ’optically dull X-ray loud’ galaxy (Elvis et al. 1981). In the optical image the galaxy appears to be extended with the Chandra source centered on its nucleus. Source n.33 (MS1219.97542) was detected for the first time by the Einstein observatory (Gioia et al. 1990), and was first optically identified with a cluster of galaxies by Stocke et al. (1991) in the EMSS survey. Subsequently, Rector et al. (2000) classified MS 1219.9+7542 as a BL Lac object on the basis of its spectral energy distribution (SED). Very recently, however, Barcons et al. (2001) unambiguously classified MS1219.97542 as a narrow emission line galaxy (NELG) on the basis of an observation performed with the 2.5m INT telescope. Source n.37 (NGC 4291) is an early-type (E2) absorption line galaxy at redshift =0.0058 (Ho, Filippenko & Sargent 1997), which is also weakly detected in a 8.5 GHz NRAO VLA observation (6.3 1018 W Hz-1, Wrobel & Herrnstein 2000). Stellar dynamical measurements indicate that NGC 4291 has a massive central black hole of 1.8 108 solar masses (Gebhardt et al. 2000). This nearby galaxy appears extended in the EPIC image. The centroid of the hard X-ray source ((J2000)=12h20m15s, (J2000)=75∘22′09′′) is displaced by 9 arcsec from the optical center of the galaxy ((J2000)=12h20m17s, (J2000)= 75∘22′18′′). This value is larger than the XMM astrometric errorbox (6 arcsec): the X-ray source is however well inside the optical contour of NGC 4291. We choose a 30 arcsec extraction radius in order to avoid contamination from the nearby X-ray source 1AX J122024+7521 (Ueda et al. 2001) and the previously unknown X-ray source XMMUJ122005.1+752143, which are at 55 and 49 arcsec from NGC 4291, respectively.
Finally, the sample is cross-correlated with the FIRST (Becker, White & Helfand 1995) and the NVSS (Condon et al. 1998) radio catalogs in order to identify any possible radio counterparts. Only 2 out of 7 fields analyzed here have been covered by the FIRST survey while the NVSS covers all but one fields (PKS0312-770) but with a higher flux limit. We find that only three X-ray sources have a radio counterpart: sources n. 23, 25 and 38 coincide (within a few arcsec) with the radio sources NVSS000122.7-250018.6 (=69.2 mJy), NVSSJ000100-250503 (=130mJy) and FIRST 140127.59+025606.8 (=1.54 mJy), respectively. All these sources have optical-to-radio indices 0.3 and can therefore be classified as radio loud AGNs.
| N | Source name | (d.o.f.) | Bestfit | ||
|---|---|---|---|---|---|
| (1020 cm-2) | |||||
| 1 | CXOU J031015.9765131 | 8 | 1.87 | 0.90/250 | Yes |
| 2 | CXOU J031209.2765213 | 8 | 2.24 | 0.91/52 | Yes |
| 3 | CXOU J031238.9765134 | 8 | 1.03/(1.26) | 0.69/11 | No |
| 4 | CXOU J031253.8765415 | 8 | 1.61 | 1.02/39 | Yes |
| 5 | CXOU J031312.1765431 | 8 | 1.88 | 1.22/48 | Yes |
| 6 | CXOU J031314.5765557 | 8 | 1.95 | 0.79/81 | Yes |
| 7 | XMMU J030911.9765824 | 8 | 0.15/(0.36) | 1.28/28 | No |
| 8 | XMMU J031049.6763901 | 8 | 1.36 | 1.07/35 | Yes |
| 9 | XMMU J031105.1765156 | 8 | 1.32/(1.88) | 0.81/11 | Yes |
| 10 | XMMU J123110.6641851 | 2 | 1.91 | 0.76/37 | Yes |
| 11 | XMMU J123116.3641114 | 2 | 1.82 | 1.00/52 | Yes |
| 12 | XMMU J123218.6640309 | 2 | 1.88 | 0.71/24 | Yes |
| 13 | XMMU J123214.2640459 | 2 | 1.40/(1.31) | 0.92/24 | Yes |
| 14 | XMMU J123013.4642505 | 2 | 1.79 | 1.14/22 | Yes |
| 15 | XMMU J123049.9640845 | 2 | 2.37 | 1.05/31 | Yes |
| 16 | XMMU J123058.5641726 | 2 | 1.08/(1.26) | 0.32/9 | Yes |
| 17 | XMMU J133730.8242305 | 1.2 | 2.25 | 0.58/24 | Yes |
| 18 | XMMU J133649.3242004 | 1.2 | 2.05 | 0.94/24 | Yes |
| 19 | XMMU J133807.4242411 | 1.2 | 2.13 | 1.21/72 | No |
| 20 | XMMU J133747.4242728 | 1.2 | 1.92 | 0.80/24 | Yes |
| 21 | XMMU J133712.6243252 | 1.2 | 1.66 | 1.46/17 | Yes |
| 22 | XMMU J000031.7255459 | 2 | 2.13 | 0.91/19 | Yes |
| 23 | XMMU J000122.8250019 | 2 | 1.97 | 1.11/31 | Yes |
| 24 | XMMU J000027.7250441 | 2 | 1.91 | 0.99/46 | Yes |
| 25 | XMMU J000100.0250459 | 2 | 0.89 | 1.44/28 | No |
| 26 | XMMU J000102.5245847 | 2 | 2.28 | 0.85/52 | Yes |
| 27 | XMMU J000106.8250845 | 2 | 1.61/(1.71) | 0.64/19 | Yes |
| 28 | 1E0737.07436 | 3.5 | 2.28 | 1.05/227 | No |
| 29 | XMMUJ074350.5743839 | 3.5 | 1.08/(1.11) | 1.11/13 | No |
| 30 | 1SAX J0741.9+7427 | 3.5 | 1.92 | 1.11/64 | Yes |
| 31 | XMMUJ074351.5744257 | 3.5 | 1.84 | 0.97/29 | Yes |
| 32 | XMMUJ074401.5743041 | 3.5 | 1.71/(1.78) | 0.59/11 | Yes |
| 33 | MS1219.97542 | 3 | 1.51 | 0.86/87 | No |
| 34 | MS1218.67522 | 3 | 1.71 | 0.69/100 | Yes |
| 35 | XMMU J122258.3751934 | 3 | 1.41/(1.61) | 0.93/18 | Yes |
| 36 | XMMU J122351.3752224 | 3 | 1.76 | 0.84/31 | Yes |
| 37 | NGC4291 | 3 | 2.81 | 5.26/72 | No |
| 38 | XMMU J140127.7025603 | 2.3 | 1.21 | 1.55/215 | No |
| 39 | XMMU J140053.0030103 | 2.3 | 1.80 | 0.90/37 | Yes |
| 40 | XMMU J140130.7024529 | 2.3 | 0.19/(0.14) | 0.87/7 | No |
| 41 | XMMU J140145.0025330 | 2.3 | 0.76/(0.66) | 0.85/19 | Yes |
(a)Galactic column density are taken from Stark et al. (1992). (b) The values reported in brackets are obtained using the C statistic (Cash 1979), see text for details.
| Source n. | statistic | C.l. | Best-fit | ||
|---|---|---|---|---|---|
| (1021 cm-2) | |||||
| 3 | 1.84/(2.12) | 7.1/(11.8) | 3.1 | 90.0% | Yes |
| 7 | 1.20/(1.39) | 48.5/(37.6) | 1.14 | 80.0% | No |
| 25 | 1.31 | 5.2 | 18.0 | 99.99% | Yes |
| 29 | 1.75/(1.59) | 2.7/(2.1) | 7.9 | 98.5% | Yes |
| 33 | 1.64 | 0.59 | 4.8 | 97.0% | Yes |
| 37 | 8.69 | 10.7 | 65.1 | 99.99% | No |
| 38 | 1.66 | 1.5 | 98 | 99.99% | No |
| 40 | 2.15/(1.74) | 23.5/(18.1) | 6.1 | 96.0% | Yes |
(a) The values reported in brackets are obtained using the C statistics (Cash 1979), see text for details.
3.2 X-ray spectral properties
3.2.1 Single power law model (SPL)
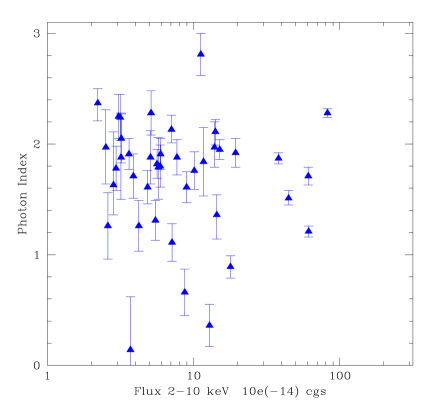
In order to understand the shape of the continuum, the spectrum of each source is first fitted with a simple model consisting of a power law with absorption fixed at the Galactic value (hereafter, model SPL). The results of these fits are reported in Table 3 and graphically displayed in Fig. 2 where we plot versus 2-10 keV flux. The resulting photon indices range from 0.15 to 2.8, with the majority of the sources clustering at around 1.9, i.e. close to the canonical value for broad line unabsorbed AGNs. One source in Fig. 2 is compatible with an inverted (negative) spectral slope and another has 3. These extreme cases will be discussed in detail in the next Sections. The results obtained by applying the Cash statistic are fully consistent with those obtained using the (see Table 3). We also check out the possible presence of systematic variations (i.e. hardening or softening) of the photon index with the off-axis distance of the sources but we find no particular trend. Possible artifacts of the PSF emerging at large radii have been also rejected by Bocchino et al. (2001) after a detailed MOS and PN spectral analysis of 3C58. Interestingly enough, it appears from Fig. 2 that very flat (1.1-1.2) are present at different flux levels and no trend of versus flux is evident in the data.
3.2.2 Absorbed power law model (APL)
A flat photon index could indicate that the simple power law model is not appropriate. In fact, typically flat X-ray spectra are obtained when absorption intrinsic to the source is present. We have therefore refitted our data using a power law but absorbed this time both by Galactic and intrinsic absorption (model APL). Table 4 lists all sources (8 out of 41) for which there is evidence of excess absorption on the basis of a improvement in the fit. In source n.3 the fit improvement is not so significant (at 90%) but the slope is steeper (1.84) than without absorption (1.03). In source n.7, the fit improves only slightly but this source clearly requires an additional soft component (see Section 3.2.3). In all other sources (n.25, 29, 33, 37, 38 and 41) the improvement is highly significant (at 97%).
In any case it is evident from Table 4 that the power laws steepen to more standard values in most objects, while the column densities obtained range from 6 to 200 1020 cm-2, i.e. a very broad range of values: in source n.37 is intrinsically steep but this is due to the peculiar spectral shape of this source (see Section 3.2.3).
As expected the only known Seyfert 2 (n.7) present in the sample is the source with the largest value of . Note however that other objects characterized by narrow lines (n.4, n.33, n.35), and so potentially obscured, show very low column density values. Furthermore, although not yet optically classified, XMMU J140130.7024529 (n.40) is very likely associated with a type 2 object just on the basis of the column density result obtained here. Significant absorption is also found in two broad line AGNs (n.25 and n.38), indicating that also this type of object can contain large amounts of gas; furthermore 2 out of 3 radio loud sources in our sample are obscured in X-rays. Even more interesting is the presence of absorption in two out of three normal galaxies of the sample. Under the assumption that the dust to gas ratio in these objects is similar to our own Galaxy, the observed column densities imply an optical extinction AV1-2 mag, not high enough to obscure the broad line region of an AGN, and so confirming their optical classification as normal galaxies. Finally source n.41 does not require any additional absorption component and its spectrum appears to be intrinsically flat (0.7). We have also tried imposing a =1.9, resulting in a column density =1.1 1022 cm-2 but this fit is worse than that found with the SPL model. However the lack of optical identification for about half of the sources in the sample and the poor statistics characterizing some faint sources could lead to an artificial underestimate of . In fact, it is worth noting that some sources with flat best-fit slopes (1.5) could be obscured by large absorption columns but the low statistics may prevent us from making a correct measurement of the true absorption column density. We have faced both these problems by imposing a photon index of =1.9 to all sources and =1 to optically unidentified objects, before re-estimating the values. Results of this spectral fitting will be discussed in Section 4.2.2.
3.2.3 More complex models
After the introduction of models SPL and APL four sources (n.7, n.19, n.28, n.37) are still not satisfactorily fitted; in fact the residuals show (see Fig. 3, 4, 5, 6) that the presence of a soft excess is these objects is evident. We have therefore refitted these sources introducing an extra spectral component in the form of a power law (PL in Table 4) or a thermal model (TM in Table 4) in addition to the primary power law continuum. The photon index of the secondary power law is left free to vary in all sources whereas in source n.7 it is fixed to the value of the primary power law photon index as expected in a type 2 object where the soft excess is often due to a scattered component (Turner et al. 1997). The thermal model is parameterized by Raymond-Smith plasma.
Source n.19 is not optically classified and the introduction of a thermal component is dictated by the high value of the secondary power law photon index (=5.17). In source n.28, a double power law model is a good fit to the data and the change in slope is located at 1.30 keV. Many radio-quiet QSOs, as source n.28 has been optically classified, show such an excess in the soft X-ray band (Reeves & Turner 2000, George et al. 2000, Mineo et al. 2000). This excess is likely due to the high energy tail of the UV bump and is often parameterized by a blackbody component. In fact using such a component in place of the second power law gives an equally good fit (at 99% confidence level with respect to model SPL) and provides a =1.96 and a T=0.13 keV in the quasar rest frame.
| Source n. | Model | T | statistic | C.l. | Best-fit | ||
|---|---|---|---|---|---|---|---|
| (eV) | (1021 cm-2) | ||||||
| 7 | PL | 94/(98)(a) | 1.76/(2.17)(a) | 4.4 | 96% | Yes | |
| 19 | TM | 150 | 1.74 | 8.1 | 99% | Yes | |
| 28 | PL | 2.47 | 1.93 | 23.5 | % | Yes | |
| 37 | TM | 360 | 2.3 | 1.11 | 96.7 | 99.99% | Yes |
(a) The values reported in brackets are obtained using the C statistic (Cash 1979), see text for details.


Source n.37 (NGC4291) is a normal galaxy and so a thermal component is expected: for the X-ray emitting gas we infer a rather low temperature (T0.4 keV) and metallicity =0.07. The introduction of the soft component solves the problem of the rather steep spectral slope but reveals the presence of a hard tail in this object (e.g. Fig. 7). A similar feature has also been found in other X-ray early-type galaxies (Allen et al. 2000, Matsumoto et al. 1997) and is possibly due either to the presence of an obscured nucleus or to the summed contributions of discrete X-ray sources in the galaxy. If we impose a slope of 1.9 to the power law component likely associated with the nucleus, we obtain a column density of 41 1021 cm-2, thus invoking an obscured nucleus could be a viable explanation for the hard tail. However, using this model we find L2-10=1.7 1040 erg s-1 which provides an ratio 4 10-6, too low for a normal AGN. Recent Chandra results (Sarazin, Irwing & Bregman 2001, Loewenstein et al. 2001) indicate that the bulk of the 2-10 keV emission in a number of early-type galaxies originates from discrete galactic sources like LMXBs, HMXBs and/or galactic BHs (Fabbiano, Zezas & Murray 2001; Foschini et al. 2002) and so it is likely that this contribution is present in NGC4291 too. Unfortunately we cannot investigate more deeply the origin of the hard X-ray tail because of the limited spatial resolution of EPIC with respect to Chandra and the low signal to noise ratio at high energies. An observation with higher angular resolution (i.e. with Chandra) and longer exposure could instead place stringent limits on the relative contribution of the diffuse gas, discrete sources and a possible hidden low luminosity active nucleus to the total 2-10 keV luminosity of this source.
Finally source n.38, a broad line radio loud quasar, is characterized by a warm absorber as shown in Fig. 8. In the soft portion of the spectrum we find an edge at 0.820.10 keV (quasar-frame) with an optical depth =0.42, likely due to OVIII shell absorption. With this additional component, whose significance is at 95% level, the associated is equal to 218(212). The other edge is found at =7.12 keV (quasar-frame) with an optical depth =0.71 and a significance 95% confidence level (-test value =4.5). This edge is consistent with FeI-XVIII shell at 90% confidence for 0.3, assuming that the absorbing material is intrinsic to the source. Including this feature in the spectral fitting gives a slightly harder photon index (=1.55).
We have also checked in the optically identified sources the possible presence of an emission feature centered at 6.4 keV in the source rest frame. No convincing evidence for this line has been found, and in all of the sources considered the upper limits on EW we can set are compatible with the values usually observed in active galaxies (350 eV).
| Source n. | Best fit | |||
|---|---|---|---|---|
| Model† | (10-14 erg cm-2 s-1) | (10-14 erg cm-2 s-1) | (1044 erg s-1) | |
| 1 | SPL | 22.10 | 38.1 | 52.7 |
| 2 | SPL | 4.50 | 3.15 | 3.2 |
| 3 | APL | 0.66 | 2.59 | 3.510-2 |
| 4 | SPL | 3.41 | 8.95 | 2.5 |
| 5 | SPL | 4.31 | 7.70 | 9.1 |
| 6 | SPL | 10.13 | 15.14 | 1.7 |
| 7 | PL | 0.55 | 12.85 | 6.8 |
| 8 | SPL | 6.25 | 14.42 | 1.3 |
| 9 | SPL | 0.83 | 3.19 | |
| 10 | SPL | 2.62 | 3.61 | |
| 11 | SPL | 3.60 | 5.62 | |
| 12 | SPL | 3.52 | 5.07 | |
| 13 | SPL | 1.84 | 5.48 | |
| 14 | SPL | 3.51 | 5.74 | |
| 15 | SPL | 3.95 | 2.21 | |
| 16 | SPL | 0.88 | 4.22 | |
| 17 | SPL | 3.86 | 3.07 | |
| 18 | SPL | 2.61 | 3.20 | |
| 19 | TM | 8.52 | 14.10 | |
| 20 | SPL | 1.88 | 2.51 | |
| 21 | SPL | 1.43 | 2.83 | |
| 22 | SPL | 7.11 | 7.06 | 0.3 |
| 23 | SPL | 9.08 | 13.88 | 12.2 |
| 24 | SPL | 4.37 | 5.95 | 0.4 |
| 25 | APL | 4.10 | 17.88 | 7.3 |
| 26 | SPL | 6.40 | 5.12 | 0.7 |
| 27 | SPL | 2.10 | 3.87 | |
| 28 | PL | 72.32 | 82.42 | 5.3 |
| 29 | APL | 2.47 | 7.11 | |
| 30 | SPL | 14.41 | 19.38 | |
| 31 | SPL | 7.50 | 11.70 | |
| 32 | SPL | 1.74 | 2.95 | |
| 33 | APL | 18.33 | 44.6 | 1.3 |
| 34 | SPL | 30.62 | 60.93 | 15.9 |
| 35 | SPL | 1.96 | 4.84 | 0.2 |
| 36 | SPL | 6.76 | 10.11 | 2.1 |
| 37 | TM | 24.41 | 11.21 | 1.710-4 |
| 38 | WA | 22.23 | 61.22 | 2.2 |
| 39 | SPL | 3.62 | 5.91 | 1.3 |
| 40 | APL | 0.31 | 3.7 | |
| 41 | SPL | 1.10 | 8.7 |
†SPLpower law model + Galactic absorption; ABLSPL + additional absorption; TMSPL (or APL) + thermal model for the soft excess component; PLSPL (or APL) + non-thermal model for the soft excess component; WASPL (or APL) + warm absorber features.
3.2.4 Summary
About 75% of our sources have not been detected in X-rays before and except for 6 objects (n.1 to n.6 in Table 2) in the PKS0312-770 sky field (for which we find similar results to Lumb, Guainazzi & Gondoin 2001), all others have not been spectroscopically studied above 2 keV. 31 out of 41 sources are well fitted with a simple power law plus Galactic absorption (SPL) model (see Table 3). In 7 sources an extra absorption component is required at 95% confidence level (see Table 4 and 5). Furthermore another source (n.3 in Table 4) shows a very flat photon index which is indicative of obscuration, but an accurate spectral fitting is limited by the poor statistics. In four sources we find significant soft excess emission, which can be parameterized with a thermal (TM) model in two cases and with a power law (PL) in another case (source n.7, a Seyfert 2 galaxy) while in one object (n.28), both the TM and PL models provide an equally good fit. One source (n.38) is characterized by warm absorber features both in the soft and in the hard portion of its spectrum (indicated as model WA in Table 6). In Table 6 we report the best fit models found for all our of the sources with the corresponding fluxes in the 0.5-2 keV and in the 2-10 keV band as well as the unabsorbed 2-10 keV luminosity. The hard X-ray fluxes range from 3 to 80 10-14 erg cm-2 s-1, with more than 60% of the sources having 10-13 erg cm-2 s-1. The luminosities span from 2 1040 to 5 1045 erg s-1. Sources with a hard X-ray luminosity 1042 erg s-1 match well with their optical classification as AGNs, except for the two intriguing ’normal’ galaxies (n.3 and n.41) which are too X-ray bright for their class.
4 Discussion
4.1 Photon index
Using model SPL over the 0.3-10 keV band (see Table 3) we find an average spectral index =1.670.04 (or =1.690.04 if we consider only the subsample consisting of the 27 sources with a 2-10 keV flux brighter than 5 10-14 erg cm-2 s-1, the value above which we are complete). Using the best fit model (see Table 6) for 40 out of 41 objects111We exclude NGC4291 (n.37) because its spectrum is better described by a thermal model (e.g. Table 6) as expected on the basis of its optical classification., the average photon index becomes even steeper (=1.740.09). This value matches well with those typical of broad line quasars as found in previous works (Lawson & Turner 1997; Reeves & Turner 2000) and it is also consistent with the fact that the large majority of our identified sources are indeed broad line AGNs (see Table 2). Concerning the subsample of sources with F5 10-14 erg cm-2 s-1, the average slope we find is fully consistent with the results in Ishisaki et al. (2001) based on the 1-7 keV hardness ratio analysis of 29 hard X-ray selected sources with fluxes 10-1310-14 erg cm-2 s-1 found in a deep ASCA exposure of the Lockman Hole field. Indeed the above authors reported an apparent photon index of =1.650.10. Our value is instead somewhat steeper than that found using the ASCA LSS survey (=1.510.05; Ueda et al. 1999) obtained from a stacked spectra analysis of 39 X-ray serendipitous sources selected in the 2-10 keV band with 8 10-14 erg cm-2 s-1. Ueda et al. (1999) noted however that their result was affected by an artificial spectral flattening due to their hard X-ray selection criterion.
On the other hand, recent Chandra and XMM-Newton deep surveys indicate that the bulk of sources with flat spectra (intrinsic and/or due to obscuration) which are required to solve the CXB spectral paradox, emerges at 2-10 keV fluxes fainter than 10-14 erg cm-2 s-1. In fact, our value of 1.6-1.7 is consistent with the results obtained from the stacked spectra analysis of the Chandra Deep Field South (CDFS), where Giacconi et al. (2001) found =1.710.07. A progressive hardening of the average slope towards fainter fluxes which is necessary to explain the 2-10 keV CXB spectral shape, has however been measured by Tozzi et al. (2001). Our results are also qualitatively consistent with those recently obtained by Baldi et al. (2002) and Della Ceca et al. (2002) based on a hardness ratio analysis of XMM-Newton data where a lack of flat sources above a few 10-14 erg cm-2 s-1 is observed.
Overall, these results match well with the fact that the sources which contribute the most to the hard CXB, lie around the break of the LogLog distribution, i.e. at 10-14 erg cm-2 s-1, below which the slope of the LogLog slightly flattens (Cowie et al. 2002, Hasinger et al. 2001, Baldi et al. 2002a). Finally we find no significant correlation between and for all our optically identified sources.
4.2 Absorption
4.2.1 Broad line X-ray absorbed objects
Interestingly enough we find that 33% of the sources requiring significant (at 97% confidence level, see Table 4) absorption in excess of the Galactic value are broad line objects with ranging from 1 to 5 1021 cm-2. Therefore our analysis confirms the existence of broad line AGNs which suffer from absorption in X-rays (Fiore et al. 2001; Georgantopoulos, Nandra & Ptak 2001, Schartel et al. 1997, Sambruna, Eracleous & Mushotzky 1999) although with lower column densities compared to those found in these works. Also Wilkes et al. (2001) recently reported similar results for a sample of 2MASS selected AGNs observed by Chandra: from the X-ray hardness ratio analysis they found that the majority of type 1 objects are absorbed by intermediate column densities i.e. 1021-23 cm-2. It is worth stressing that these obscured broad line objects could contribute significantly at progressively fainter fluxes to the fraction of the moderately absorbed sources which produces the bulk of the CXB above 2 keV (see next Section).
4.2.2 Comparison with CXB synthesis models
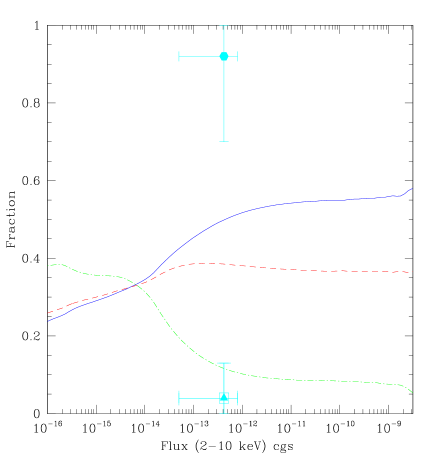
In Fig. 9 we compare the fractions of absorbed sources that we find to the theoretical predictions of the CXB synthesis model of Comastri et al. (2001) relative to the 2-10 keV band. For this plot we consider only sources with 5 10-14 erg cm-2 s-1 (i.e. our completeness limit). The column densities are from the best fit model, as reported in Table 6 for each source. The horizontal error bars associated to the points in Fig. 9 correspond to our completeness limit and to the highest flux in the sample; the vertical error bars indicate instead the Poissonian error for each fraction value. A mismatch between our findings and the theoretical model predictions is evident from this plot. The latter appear to overestimate by a factor of 2 to 10 the fraction of absorbed sources i.e. with 1022 cm-2, and understimate the fraction of sources with low absorption. At these flux levels (10-13 erg cm-2 s-1) the model predicts that about 55% of the sources should be obscured, while we find a fraction of 20% at most.
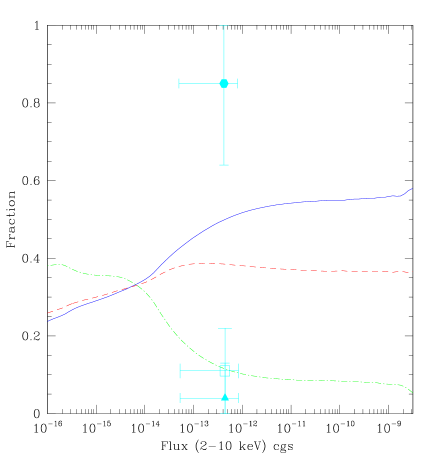
There are, however, some possible biases in our result that should be taken into account. The determination of the true column density for the objects without redshift is difficult and we possibly underestimate some values as (1+)2.6 (Barger et al. 2001). To account for this effect as reported in Section 3.2.2 we fitted all spectra with an absorbed power law model imposing =1.9 (and =1 for the unidentified sources in the sample) to infer upper limits on the absorption distribution. The results corresponding to these conservative assumptions are reported in Fig. 10. Also in this case we find that the fraction of absorbed sources appears to be lower than the theoretical predicted value, with an upper limit of about 30%.
Another bias we consider important is related to the high energy roll-over of the PN effective area above 4 keV. The effective area decreases by about a factor of two between 4 and 9 keV while in order to compute the theoretical predictions showed in Fig. 9 and Fig. 10 Comastri et al. (2001) assumed an uniform flat detector response. This fact may have introduced in our analysis a selection bias against the hardest X-ray sources. This problem mostly affects heavily obscured sources with 1022-23 cm-2 which have the bulk of their X-ray emission above 3-4 keV i.e. exactly those sources we do not find in large quantities as foreseen by theoretical models. Because of this bias it is possible that we have lost here some of the faintest, absorbed sources. Spectral analysis of a larger number of sources could help to solve this issue. Note, however, that even if we consider the subsample of sources in the harder 5-10 keV energy band with 5 10-14 erg cm-2 s-1, the mismatch between our findings and the theoretical predictions (Comastri et al. 2001) remains. Albeit the number of sources is small (i.e. 15), we notice that our fraction of sources with 1022 cm-2 is 60-80% compared to the Comastri et al. (2001) prediction of 35-40%.
We also performed some simulations using PN data in order to check the possibility that we missed some absorbed sources (even for those belonging to the ’complete’ subsample i.e. with 5 10-14 erg cm-2 s-1) if their true X-ray spectra are the result of the combination of high column density and scattering of the primary continuum along our line of sight from a warm medium (Turner et al. 1997). To test this hypothesis, we assumed as an input spectrum the average partial covering model (PCF) found in Seyfert 2s (i.e. =1.96 and 74%; see Turner et al. 1997, Table 19) with a typical flux of 9 10-14 erg cm-2 s-1 in the 0.5-10 keV band (see Table 6). We found that we are able to discriminate at 95% confidence level (using the -test method) between the PCF and APL models for any value of intrinsic ranging from 1023 down to 1021 cm-2. It is worth noting that a column density of =1 1021 cm-2 at =0 corresponds to an 1022 cm-2 at =1. Thus this effect will not change the values plotted in Fig. 10.
Gilli, Salvati & Hasinger (2001) presented a CXB model which assumes a luminosity density dependent evolution (LDDE; Miyaji, Hasinger & Schmidt 2000) model for the X-ray luminosity function (XLF) and a ratio absorbed/unabsorbed sources at =0 (=4) lower than at 1.32 (=13). Comparing our results to their predictions (Gilli, priv. comm.), we confirm a large mismatch for 1022 cm-2 and 10221023 cm-2, while for 1023 cm-2 we are in substantial agreement.
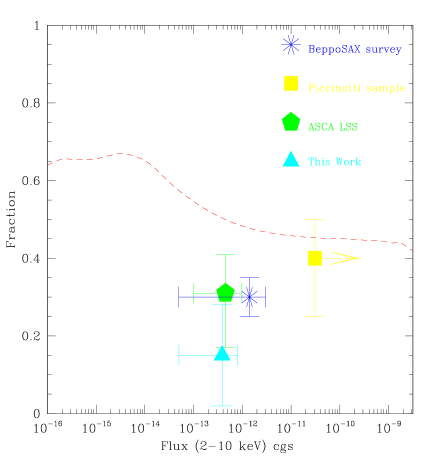
On the other hand some independent recent works based on Chandra and XMM-Newton observations seem to confirm our results. Gandhi et al. (2001) have carried out a spectroscopic study of serendipitous sources at 2-10 keV fluxes fainter than ours in some Chandra cluster observations: they reported that most of these sources are obscured by column densities of 1021-22 cm-2, with only a few showing 1023 cm-2. Preliminary results from the XMM-Newton Bright Serendipitous Source Survey discussed in Della Ceca et al. (2002) also report only a few obscured sources at fluxes similar to ours. Finally Baldi et al. (2002b) presented the 2-10 keV hardness ratio distribution of the sources belonging to the HELLAS2XMM medium-deep survey. Their sample is larger than ours and also includes all sources presented here (but note their analysis is based only on the hardness ratios rather than spectral fitting). Their results confirm the lack of hard, and hence potentially obscured, sources with hard X-ray fluxes greater than few 10-14 erg cm-2 s-1. For completeness we plot in Fig. 11 the fraction of absorbed objects (i.e. with 1022 cm-2) derived from the main X-ray surveys carried out in the 2-10 keV band with different X-ray observatories at different limiting fluxes and the corresponding theoretical model predictions. It appears that at hard X-ray fluxes between 10-12 and 10-14 erg cm-2 s-1 the fraction of observed absorbed sources is considerably less than predicted by the theory. This figure clearly shows the inability of CXB standard theoretical models to fit the observational data, at least for fluxes above 10-14 erg cm-2 s-1. This result and the mismatch emerging in the optical follow-up of the deep X-ray surveys (Hasinger 2002) between the predicted and the observed redshift distribution of X-ray sources suggests that CXB theoretical models should be revised (Comastri et al., in preparation).
Assuming therefore that the above observational results are real, we address here the possibility of modifying one (or more) of the assumptions made in standard CXB synthesis models. As noted by Gilli, Risaliti & Salvati (1999), the parameter space of CXB models is large and different combinations of input values can reproduce the CXB properties. The critical assumptions are usually three: the intrinsic X-ray spectral shape of the sources, the XLFs (in particular the XLF of type 1 versus XLF of type 2 objects) and the column density distribution. All these values are already quite uncertain in the local universe and even more importantly their evolution is unknown along . It is therefore possible that some of the important assumptions used in theoretical models are too rigid. The presence of a steep (2) component in the soft band may not be a ubiquitous feature of low broad line AGNs (Reynolds 1997; Matt 2000; Reeves & Turner 2000); in particular Blair et al. (2000) suggested a possible evolution along of the soft excess in the ROSAT spectra of soft X-ray selected QSOs. Furthermore high- radio quiet QSOs may have flatter intrinsic slopes than nearby ones as found in ASCA observations (Vignali et al. 1999, Pappa et al. 2001b).
Another possibility is that QSOs may evolve in luminosity and/or in number differently than assumed in theoretical models. For example Comastri (2000) computed the relative fraction of unobscured and obscured sources assuming a LDDE for the XLF instead of a pure luminosity evolution (PLE; as used in models plotted in Fig. 9 and 10). The model computed in this way predicted a significantly higher number of unobscured sources than expected with a PLE, in better agreement with our observational results. Also recent Chandra and XMM-Newton deep surveys require modifications to the commonly used XLFs (Hasinger 2002).
The evolution properties of type 2 sources could be different with respect to those of type 1s (see e.g. Gilli, Salvati & Hasinger 2001). Although the location and the dynamics of the absorption material(s) are two key parameters with which to understand the evolution of type 2 objects, these are only poorly known to date (i.e. Matt 2000b, Guainazzi et al. 2002). For example if the AGNs evolution is connected to the star formation rate in their host galaxies (Oshuga & Umemura 1999) and/or to the growth of the central black hole (Fabian 1999), one might expect a different evolution in the absorption column density of type 1 versus type 2 sources. In particular, a faster evolution of absorbed type 2 Seyfert-like sources would reduce the above mismatch and would also be consistent with the larger number of flat sources found by e.g. Tozzi et al. (2001) and Baldi et al. (2002b) at lower fluxes than ours.
Finally another possible explanation for the discrepancy between our results and theoretical predictions could be the existence of a new population of sources with flat intrinsic spectra emerging at faint (10-14 erg cm-2 s-1) hard X-ray fluxes. In the next Section we discuss possible objects of this kind.
4.3 X-ray loud ’normal’ galaxies.
Two sources in the sample, CXOU J031238.9-765134 (n.3, the so-called P3 in Fiore et al. 2000; 3 1042 erg s-1) and XMMU J140145.0+025330 (n.41; 2.6 1043 erg s-1 assuming =0.25), are optically classified as normal galaxies due to the lack of emission lines in their optical spectra, but their hard X-ray luminosities are significantly higher than typically found in the local galaxy population (Fabbiano 1989). For these reasons we consider them as members of the optically dull X-ray bright galaxies class. From our analysis both sources have a flat X-ray photon index with 1 (n.3) and 0.7 (n.41) when a simple power law model (SPL) is applied. We also derive upper limits on the absorption column density 1023 cm-2 imposing =1.9 in both sources; furthermore, we do not find any evidence of a strong iron line in their spectra, which is a typical features of reflection-dominated objects. Comastri et al. (2002) reported the spectral energy distribution of P3 from radio to X-rays. On the basis of the faintness of its radio emission these authors excluded the presence of an advection dominated accretion flow (Narayan et al. 1998). The SED of P3 could be consistent with a BL Lac-type classification. However the lack of X-ray variability and the presence of a large Calcium break is at odds with such a hypothesis. Based on these overall properties Comastri et al. (2002) suggested that a Compton thick AGN was a very plausible explanation for the X-ray properties of the source. However, the real nature of P3 is still uncertain. Much less is known about source n.41, so that a detailed investigation on the nature of this object is not possible at the moment.
The population of these ’normal’ galaxies seems to emerge at faint X-ray fluxes, well below 10-13 erg cm-2 s-1. Such sources have not been found in previous ASCA and BeppoSAX surveys but this may be due to the large identification error boxes of these observatories. Recently Barger et al. (2001) presented Keck spectroscopy of a complete sample of 20 hard X-ray sources with 3.8 10-15 erg cm-2 s-1 detected in the Chandra Hawaii Deep Survey Field SSA13. Four galaxies in the sample (20%) show no clear sign of nuclear activity but have 2-10 keV luminosities greater than 1042 erg s-1, i.e. they are X-ray loud. As stated by these authors, these sources may be rather common X-ray emitters. The peculiar characteristics of these sources could be explained by a very high column density obscuring both the broad and narrow line regions of the active nucleus or by beaming. However, as pointed out by Hornschemeier et al. (2001), more accurate optical data are needed before definitively ruling out the possible existence of weak emission lines.
In relation to the CXB population synthesis models, these objects are very interesting because they ’appear’ at fluxes around 10-14 erg cm-2 s-1 i.e. near the turnover of the LogLog and have a hard photon index. The completion of multiwavelength follow-up observations of pencil beam (Rosati et al. 2002; Hasinger et al. 2001; Willott et al. 2001) and shallower (Baldi et al. 2001; Della Ceca et al. 2002; F02) X-ray surveys will allow an accurate estimate of how common these ’normal’ galaxies are and what is their relative contribution to the CXB.
5 Conclusions
We have reported spectral results for a sample of 41 hard X-ray sources detected serendipitously in seven EPIC fields and selected in the 2-10 keV band. A detailed spectral analysis has been performed in order to measure source-by-source the 0.3-10 keV continuum shape, the amount of cold (and, possibly, ionized) absorbing matter and the strength of other spectral features. Complementary to deep pencil beam surveys, our shallower survey allows us to investigate in some detail the spectral properties of faint serendipitous sources. This is a field of study almost unexplored with previous X-ray satellites. We have found an average photon index =1.670.04 using a simple power law fit with Galactic absorption for the whole sample. Considering only sources with 5 10-14 erg cm-2 s-1 (i.e. our completeness limit) we obtain a =1.690.04, which is consistent with average values reported in recent Chandra and ASCA works at similar fluxes.
We have also shown how surveys of the kind described here can constrain some of the assumptions used in CXB population synthesis models (either spectral shape, XLF and/or column density distribution). In particular, we found a mismatch between our observational results and those predicted by the CXB theoretical models relative to the fractions of absorbed versus unabsorbed sources above 5 10-14 erg cm-2 s-1 in the range 2-10 keV. Extremely deep pencil beam exposures do not stress this trend, very likely because of their bias towards fainter fluxes in the source selection. We have also been able to collect information about unusual objects such as broad line X-ray obscured AGNs and optically dull X-ray bright galaxies. We are currently analysing further XMM-Newton observations with a goal of obtaining at least 100 source spectra which will allow us to put our results on more sound statistical grounds.
Acknowledgements.
We thank the Hellas2XMM Team for the optical identifications. We thank Andrea Comastri for providing us some results from his CXB synthesis model in electronic form. We also thank the anonymous referee for his/her suggestions that helped to improve the manuscript considerably. We are grateful to Roberto Gilli, Alessandro Baldi, and Roberto Della Ceca for interesting comments. E.P. thanks Andrea De Luca and Matteo Guainazzi for helpful discussions on data reduction procedure. This research has also made use of the Simbad database, operated by the Centre de Donnees Astrophisique de Strasbourg (CDS). This work is partially supported by the Italian Space Agency (ASI). E.P. acknowledges financial support from MIUR for the Program of Promotion for Young Scientists P.G.R.99.References
- (1) Akiyama, M., Ohta, K., Yamada, T., et al., 2000, ApJ 532, 700
- (2) Alexander, D.M., Brandt, W.N., Hornschemeier, A.E., et al., 2001, AJ 122, 2156
- (3) Allen, S.W., Di Matteo, T., Fabian, A.C., 2000, MNRAS 311, 493
- (4) Avni,Y., 1976, ApJ 210, 642
- (5) Baldi, A., Molendi, S., Comastri, A., et al., 2002a, Proc. of “New Visions of the Universe in the XMM-Newton and Chandra era”, F.Jansen et al. (ed), (astro-ph/0201525)
- (6) Baldi, A., Molendi, S., Comastri, A., et al., 2002b, ApJ 564, 190
- (7) Barcons, X., Carrera, F.J., Watson, M.G., et al., 2001, A&A, in press
- (8) Barger, A.J., Cowie, L.L., Mushotzky, R.F., & Richards, E.A., 2001, AJ 121, 662
- (9) Becker, R.H., White, R.L., & Helfand, D.J., 1995, ApJ 450, 559
- (10) Blair, A.J., Stewart, G.C., Georgantopoulos, I., et al., 2000, MNRAS 314, 138
- (11) Bocchino, F., Warwick, R. S., Marty, P., et al., 2001, A&A, 369, 1078
- (12) Brandt, W. N., Alexander, D.M., Hornschemeier, A.E., et al., 2001a, AJ, in press (astro/ph0108404)
- (13) Brandt, W. N., Guainazzi, M., Kaspi, S., et al., 2001b, AJ 121, 591
- (14) Cappi, M., Matsuoka, M., Comastri, A., et al., 1997, ApJ 478, 492
- (15) Cash, W., 1979,ApJ 228, 939
- (16) Collinge, M.J., & Brandt, W.N. 2000, MNRAS 317, L35
- (17) Comastri, A., 2000, Proc. of “X-ray Astronomy ’99: Stellar Endpoints, AGNs and the Diffuse X-ray Background”, (astro-ph/0003437)
- (18) Comastri, A., Fiore, F., Vignali, C., et al. 2001a, MNRAS 327, 871
- (19) Comastri, A., Mignoli, M., Ciliegi, P., et al. 2002, ApJ, in press
- (20) Condon, J.J., Cotton, W.D., Greisen, E.W., et al. 1998, AJ 115, 1693
- (21) Cowie, L.L., Barger, A.J., Bautz, M.W., et al. 2001, ApJ 551, L9
- (22) Cowie, L.L., Garmire, G.P., Bautz, M.W., et al., ApJ, in press (astro-ph/0201186)
- (23) Crawford, A.S., Gandhi, P., Fabian, A.C., et al. 2001, MNRAS, in press
- (24) DellaCeca, R., Castelli, G., Braito, V., et al., 1999, ApJ 524, 674
- (25) DellaCeca, R., Maccacaro, T., Caccianiga, A., et al., 2002, Proc. of “New Visions of the Universe in the XMM-Newton and Chandra era”, F.Jansen et al. (ed.), (astro-ph/0202150)
- (26) Elvis, M., Schreier, E.J., Tonry, J., et al., 1981, ApJ 246, 20
- (27) Fabian, A.C., 1999, MNRAS 308, L39
- (28) Fabian, A.C., & Iwasawa, K., 1999, MNRAS 303, L34
- (29) Fabian, A.C., Wilman, R.J., & Crawford, A.S., 2001, MNRAS, in press
- (30) Fabbiano, G., 1989, ARA&A 27,87
- (31) Fabbiano, G., Zezas, A., & Murray, S.S., 2001, ApJ 554, 1035
- (32) Fiore, F., LaFranca, F., Vignali, C., et al., 2000, New Astron 5, 143
- (33) Fiore, F., Comastri, A., LaFranca, F., et al., 2001, “Deep Fields” ESO Proc., (astro-ph/0102041)
- (34) Foschini, L., Di Cocco, G., Dadina, M., et al., 2002, Proc. of “New Visions of the Universe in the XMM-Newton and Chandra era”, F.Jansen et al. (ed.), (astro-ph/0202247)
- (35) Gallagher, S.C., Brandt, W.N. Laor, A., et al., 2000, ApJ 546, 795
- (36) Gandhi, P., Crawford, C.S., Fabian, A.C., et al., 2001, Proc. of “Galaxy Clusters and the High Redshift Universe Observed in X-rays”, D.Neumann, F.Durret, & J.Tran Thanh Van (ed.), (astro-ph/0106139)
- (37) Gebhardt, K., Bender, R., & Bower, G., 2000, ApJ 539, L13
- (38) Georgantopoulos, I., Nandra, K., & Ptak, A., 2001, Proc. of “X-ray astronomy 2000 (Palermo Sep. 2000)”, in press
- (39) George, I.M., Turner, T.J., Yaqoob, T., et al., 2000, ApJ 531, 52
- (40) Ghizzardi, S., 2001, XMM-SOC-CAL-TN-0022
- (41) Giacconi, R., Rosati, P., Tozzi, P., et al., 2001, ApJ 551, 624
- (42) Gilli, R., Risaliti, G., Salvati, M., 1999, A&A 347, 424
- (43) Gilli, R., Salvati, M., & Hasinger, G., 2001, A&A 366, 407
- (44) Gioia, I.M., Maccacaro, T., Schild, R.E., et al. 1990, ApJS 72, 567
- (45) Giommi, P., Perri, M., & Fiore, F., 2000, A&A 362, 799
- (46) Gondoin, Ph., Aschenbach, B., Erd, C., et al., 2000, Proc. of SPIE 2000 , in press
- (47) Guainazzi, M., Matt, G., Fiore, F., & Perola, G.C., 2002, A&A, in press (astro-ph/0204052)
- (48) Halpern, J.P., Turner, T.J., & George, I.M., 1999, MNRAS 307, L47
- (49) Hasinger, G., Altieri, B., Arnaud, M., et al., 2001, A&A 365 , L45
- (50) Hasinger, G., 2002, Proc. of “New Visions of the Universe in the XMM-Newton and Chandra era”, F.Jansen et al. (ed.), (astro-ph/0202430)
- (51) Ho, L.C., Filippenko, A.V., & Sargent, W.L.N., 1997, ApJ 487, 568
- (52) Hornschemeier, A.E., Brandt, W.N., Garmire, G.P., et al., 2001, ApJ 554, 742
- (53) Jansen, F., Lumb, D. H., Altieri, B., et al., 2001, A&A 365, L1
- (54) LaFranca, F., Fiore, F., Vignali, C., et al. 2000, Proc. of “The New Era of Wide Field Astronomy”, (astro/ph 0011008)
- (55) Lawson, A.J., Turner, M.J.L., 1997, MNRAS 288, 920
- (56) Loewenstein, M., Mushotzky, R.F., Angelini, L., et al., 2001, ApJ 555, L21
- (57) Lumb, D.H., Guainazzi, M., & Gondoin, P., 2001, A&A 376, 387
- (58) Lumb, D.H., Warwick, R.S., Page, M., & De Luca, A., 2002, A&A 389, L39
- (59) Maloney, P.R., & Reynolds, C.S., 2000, ApJ 545, L23
- (60) Marshall, F.E., Boldt, E.A., Holt, S.S., et al., 1980, ApJ 235, 4
- (61) Matsumoto, H., Koyama, K., Awaki, H., et al., 1997, ApJ 482, 133
- (62) Matsushita, K., Ohashi, T., Makishima, K., 2000, PASJ 52, 685
- (63) Matt, G., 2000a, Proc. of “X-ray Astronomy ’99: Stellar Endpoints, AGNs and the Diffuse X-ray Background”, (astro-ph/0007105)
- (64) Matt, G., 2000b, A&A 355, L13
- (65) Mineo, T., Fiore, F., Laor, A., et al. 2000, A&A 359, 471
- (66) Miyaji, T.,Hasinger, G., & Schmidt, M., 2000, A&A 353, 25
- (67) Narayan, R., Mahadevan, R., & Quataert E., 1998, The Theory of Black Hole Accretion Discs, A. Abramowicz, G. Bjornsson, & J.E. Pringle. (ed.), (Cambridge: Cambridge University Press), (astro-ph/9803141)
- (68) Norman, C., Hasinger, G., Giacconi R., et al., 2001, ApJ submitted, (astro-ph/0103198)
- (69) Ohsuga, K., & Umemura, M., 1999, ApJ 521, L130
- (70) Pappa, A., Georgantopoulos, I., Stewart, G.C., & Zezas, A.L., 2001a, MNRAS 326, 995
- (71) Pappa, A., Stewart, G.C., Georgantopoulos, I., et al., 2001b, MNRAS 327, 499
- (72) Rector, T.A., Stocke, J.T., Perlman, E.S., et al., 2000, AJ 120, 1626
- (73) Reeves, J.N., Turner, M.J.L., 2000, MNRAS 316, 234
- (74) Reynolds, C.S., 1997, MNRAS 286, 513
- (75) Risaliti, G., Marconi, A., Maiolino, R., et al., 2001, A&A, 371, 37
- (76) Rosati, P., Tozzi, P., Giacconi, R., et al., 2002, ApJ 566, 667
- (77) Sakano, M., Koyama, K., Tsuru, T., et al. 1998, ApJ 505, 129
- (78) Salvati, M., & Maiolino, R., 2000, Large Scale Structure in the X-ray Universe, M.Plionis & I.Georgantopoulos (ed.), (Paris: Atlantisciences), 277
- (79) Sambruna, R.M., Eracleous, M., & Mushotzky, R.F., 1999, ApJ 526, 60
- (80) Sarazin, C.L., Irwin, J.A., & Bregman, J.N., 2001, ApJ 556, 533
- (81) Schartel, N., Schmidt, M., Fink, H.H., et al., 1997, A&A 320, 696
- (82) Stern, D., Moran, E.C., Coil, A.L., et al. 2001, ApJ, in press
- (83) Stocke, J.T., Morris, S.l., Gioia, I.M., et al., 1991, ApJS 76, 813
- (84) Struder, L., Briel, U., Dennerl, K., et al., 2001, A&A 365, L18
- (85) Tozzi, P., Rosati, P., Nonino, M., et al. 2001, ApJ 562, 42
- (86) Turner,T.J., George, I.M., Nandra, K., & Mushotzky, R.F., 1997, ApJ 488, 164
- (87) Turner, M.J.L.T., Abbey, A., Arnaud, M., et al., 2001, A&A 365, L27
- (88) Ueda, Y., Takahashi, T., Inoue, H., et al.,1999, ApJ 518, 656
- (89) Ueda, Y., Ishisaki, Y., Takahashi, T., et al., 2001, ApJS 133, 1
- (90) Vecchi, A., Molendi, S., Guainazzi, M., et al., 1999, A&A 349, L73
- (91) Vignali, C., Comastri, A., Cappi, M. et al., 1999, ApJ 516, 582
- (92) Vignali, C., Mignoli, M., Comastri, A., et al. 2000, MNRAS 314, L11
- (93) Wei, J.Y., Xu, D.W., Dong, X.Y., Hu, J.Y., 1999, A&AS 139, 575
- (94) Wilkes, B.J., Schmidt, G.D., Cutri, R.M., et al., 2001, ApJ in press, (astro-ph/0112433)
- (95) Willott, C.J., Almaini, O., Manners, J., et al., 2001, Proc. of “Galaxy Clusters and the High Redshift Universe Observed in X-rays”, D.Neumann, F.Durret, & J.Tran Thanh Van (ed.), (astro-ph/0105560)
- (96) Wrobel, J.M., & Herrnstein, J.R., 2000, ApJ 531, 716
- (97) Yaqoob, T., 2000, Large Scale Structure in the X-ray Universe, M.Plionis & I.Georgantopoulos (ed.), (Paris: Atlantisciences), 257
- (98) Yuan, W., Matsuoka, M., Wang, T., et al., 2000, ApJ 545, 625