BeppoSAX observations of the EXS 1737.92952 region
We have observed the region of the hard X-ray transient EXS 1737.92952 near the Galactic Centre using the Narrow Field Instruments (NFI) of the BeppoSAX X-ray satellite. In this second part of our investigation we report on our spectrum analysis and time variability study of the field. The main results are the MECS spectra of each of the 10 identified sources in the interval 1.6510 keV and spectral fits of the source data. The fluxes obtained with the spectral fits are . The absorption for the sources with powerlaw and Raymond-Smith thermal plasma models is in the range . The low number of counts and lack of source identifications in the simultaneous 0.12 keV LECS data of the same field supports high absorption. This indicates that these sources are at least at the distance of the Galactic Centre. From the distance estimate a lower limit for the X-ray luminosity erg/s (210 keV) is obtained. A powerlaw with a photon index in the range generally gives a fair fit to the data, but strong line contribution (iron line at 67 keV) is evident for 5 sources and exists at lower confidence also in the other 5 sources. The fits indicate differences in line position in the range 6.17.0 keV suggesting that the ionisation state and/or emission mechanism may not be the same in all sources. The Raymond-Smith model for the 5 sources with reasonable spectral fit yields keV. Due to the low S/N of the data, other line parameters are not used in our analysis. A -analysis of the time-binned data indicates that two of the sources are variable on a time scale of hours at very high confidence ( %), and one source with lower confidence (99.67%). The scale ( hours) of the time variability indicates that these sources could be low-mass X-ray binaries. The other sources are most probably high or low mass X-ray binaries or supernova remnants. We also extracted and analysed spectra from larger subfields in the observed MECS region. A subfield including 8 of the new sources and a major contribution of diffuse emission between them yielded a fairly good fit to a power-law spectrum with photon index and a strong iron line at 6.8 keV, but a poor fit to a Raymond-Smith and bremsstrahlung model for a single source. A spectral fit to another field with only residual emission and no point sources yielded spectral parameters close to the diffuse emission near GC observed by other investigators, except for the high interstellar absorption (). The PDS spectrum at harder X-rays centred on the same position was also observed. Due to lack of spatial resolution, and a FOV larger than that of MECS, this spectrum was more difficult to interpret. The largest contribution of the spectrum is probably by 1E1740.72942. It is reasonably close to the centre of PDS collimator field, and also the observed flux matches the prediction. The source for the hard X-ray transient EXS 17137.92952 cannot be identified from the present observations.
Key Words.:
Galactic centre region – soft X-ray sources – hard X-ray transients1 Introduction
The existence of black hole candidates near the Galactic Centre (GC), such as 1E1740.72942 (see Sunyaev et al. Sun91 (1991)), has lead us to predict an increasing number of such X-ray objects with improving observing sensitivity. The discovery of 10 previously undetected objects within the SAX MECS field of view centred at EXS 1737.92952 (Huovelin et al. 1999, Paper I ) was nevertheless a surprise, since the region had revealed no clues as to their existence at any wavelength, except one transient in hard X-rays observed by the EXITE balloon experiment (Grindlay et al. Gri93 (1993)).
The analysis of the new sources is not straightforward, since we have only one energy region (MECS, 1.6510.5 keV) where we can utilise spatially resolved BeppoSAX data to derive source spectra and study their variability (see Paper I ). Lack of spatial resolution and the large field of view of PDS and HPGSPC make the interpretation of the hard X-ray data difficult.
As pointed out in Paper I , it can not be taken for granted that the new sources really are physically near the GC. It would, however, strengthen this scenario, if were clearly enhanced for the X-ray spectra of sources overlapping with a molecular cloud near the GC. There is, indeed, another source of potentially useful data of this sky area, provided by our submillimeter (SEST) observations at CO emission lines by Vilhu et al. (Vil94 (1994)). They found a dense molecular cloud moving at a peculiar velocity near EXS 1737.92952. In 1990’s, there have also been several other studies at different wavelengths, which are summarized in Durouchoux et al. (Dur98 (1998)).
Most of the observed SAX spectra contain the iron K-shell line (at 6-7 keV). K-shell emission can be produced by either by fluorescence or radiative recombination. The line strength, width and position depend on several parameters of the emitting gas, e.g. temperature, ionization state, and iron abundance. Thus the iron line provides a valuable diagnostic of the physical properties of the gas.
In this paper we report on the spectral and time variability analysis of the new BeppoSAX sources identified in Paper I , discuss alternatives as to their nature, and also study the emission of the region divided in larger subfields.
2 Observations
The observations were made on 1998 April 1213, using the co-aligned narrow field instruments LECS (Parmar et al. Par97 (1997)), MECS (Boella et al. Boe97 (1997)), PDS (Frontera et al. Fro97 (1997)), and HPGSPC (Manzo et al. Man97 (1997)) of the BeppoSAX satellite. The time interval of the observing programme was from 12/04/98 14:00 to 13/04/98 07:30 (UTC), including 13200, 30500, 14300, and 51700 seconds of effective source observing time (i.e. sum of good time intervals, GTI’s) with LECS, MECS, PDS and HPGSPC, respectively. Final, separately reduced data from MECS2 and MECS3 were summed. A more detailed description of the observations and reductions is given in Paper I .
For the MECS data we extracted the events from circular areas of radius centred at the 10 source positions. The extraction circles overlap slightly for several sources (see Fig. 1 of Paper I ). Due to the small fraction of overlapping (less than 10% of area in all cases), the effect of duplicating a fraction of the source fluxes is not significant. The background spectra for all sources were extracted from the standard MECS background event list, which is relevant to observations made after May 7, 1997, provided by the SAX ftp site on the WWW. The source spectra were rebinned in energy for data between 1.6510 keV so that each bin contains at least 20 source events. Finally, the data files for individual sources were used for further spectral and timing analysis.
| Model: | ||||||
| Powerlaw | ||||||
| Source/ Name | erg cm-2 s-1 | cm-2 | ph cm-2 s-1 keV-1 | |||
| 1/SAXJ1740.82950 | 2.0 | 0.5 (0.01.5) | 1.1 (0.91.4) | 1.9 | 16.0/21 | |
| 2/SAXJ1741.32948 | 1.7 | 1.5 (0.72.8) | 1.4 (0.43.2) | 3.0 | 19.8/20 | |
| 3/SAXJ1741.62952 | 2.3 | 1.4 (0.43.2) | 1.1 (0.81.4) | 2.1 | 40.3/22 | |
| 4/SAXJ1741.62940 | 3.0 | 3.0 (2.04.9) | 1.4 (1.11.9) | 5.3 | 19.7/17 | |
| 5/SAXJ1742.02941 | 3.1 | 6.2 (4.28.7) | 1.5 (1.02.0) | 7.7 | 14.6/16 | |
| 6/SAXJ1742.22958 | 4.8 | 0.8 (0.01.6) | 0.4 (0.10.6) | 1.4 | 16.7/23 | |
| 7/SAXJ1742.33003 | 4.3 | 1.6 (0.72.7) | 1.1 (0.81.4) | 4.0 | 12.4/16 | |
| 8/SAXJ1740.53013 | 2.4 | 2.4 (0.33.9) | 1.5 (0.82.0) | 5.2 | 4.99/11 | |
| 9/SAXJ1742.62956 | 4.3 | 6.9 (4.89.6) | 1.7 (1.32.2) | 16.5 | 22.6/15 | |
| 10/SAXJ1743.02956 | 4.7 | 3.1 (1.64.8) | 0.8 (0.51.1) | 3.2 | 18.6/16 | |
| Model: | ||||||
| Powerlaw + line | ||||||
| Source/ Name | erg cm-2 s -1 | cm-2 | ph cm-2 s -1 keV-1 | keV | ||
| 1/SAXJ1740.82950 | 1.9 | 1.1 (0.12.2) | 1.5 (1.21.8) | 3.2 | 6.7 (6.66.9) | 9.3/18 |
| 2/SAXJ1741.32948 | 1.8 | 2.0 (1.33.5) | 1.7 (1.42.1) | 4.5 | 6.6 (6.56.8) | 11.9/17 |
| 3/SAXJ1741.62952 | 2.3 | 1.9 (0.63.7) | 1.3 (1.01.7) | 3.1 | 6.6 (6.66.7) | 26.7/19 |
| 4/SAXJ1741.62940 | no line | |||||
| 5/SAXJ1742.02941 | no line | |||||
| 6/SAXJ1742.22958 | 4.8 | 0.6 (0.01.8) | 0.5 (*) | 1.4 | 6.5 (6.06.9) | 14.3/20 |
| 7/SAXJ1742.33003 | 4.0 | 2.3 (0.93.5) | 1.5 (1.02.0) | 7.7 | 6.1 (5.86.4) | 7.8/13 |
| 8/SAXJ1740.53013 | no line | |||||
| 9/SAXJ1742.62956 | 4.3 | 6.7 (4.310.0) | 1.8 (1.22.3) | 17.5 | 6.6 (6.46.7) | 18.1/17 |
| 10/SAXJ1743.02956 | 4.5 | 5.4 (2.68.9) | 1.8 (0.92.1) | 14.0 | 7.0 (6.87.3) | 9.7/19 |
| subfield 1 | 2.8 | 1.1 (0.71.5) | 1.3 (1.11.4) | 3.5 | 6.8 (6.76.8) | 198/184 |
| subfield 2 | 1.0 | 2.0 (1.22.8) | 1.8 (1.52.0) | 2.9 | 6.8 (6.66.9) | 227/184 |
| Model: | ||||||
| Raymond-Smith | keV | |||||
| Sources/Name | erg cm-2 s-1 | cm-2 | ph cm-2 s-1 keV-1 | |||
| 1/SAXJ1740.82950 | 1.8 | 1.8 (1.32.4) | 9.0 (6.613.1) | 15.1 | 10.7/21 | |
| 2/SAXJ1741.32948 | 1.7 | 2.1 (1.62.7) | 9.0 (6.413.9) | 14.7 | 14.6/20 | |
| 3/SAXJ1741.62952 | 2.1 | 3.9 (3.14.8) | 7.9 (5.911.1) | 21.0 | 31.7/22 | |
| 4/SAXJ1741.62940 | 2.8 | 3.6 (2.94.6) | 8.7 (4.916.8) | 26.2 | 16.3/17 | |
| 5/SAXJ1742.02941 | 3.1 | 5.9 (4.97.0) | 22.9 (13.2) | 30.4 | 13.5/16 | |
| 6/SAXJ1742.22958 | 4.1 | 3.7 (3.14.5) | 64.0 (*) | 39.9 | 26.0/26 | |
| 7/SAXJ1742.33003 | 4.0 | 2.5 (1.83.3) | 30.1 (*) | 33.6 | 12.7/16 | |
| 8/SAXJ1740.53013 | 2.4 | 2.3 (1.23.2) | 13.4 (6.2) | 19.1 | 4.51/10 | |
| 9/SAXJ1742.62956 | 4.3 | 5.9 (4.97.0) | 13.0 (7.430.8) | 42.4 | 21.0/15 | |
| 10/SAXJ1743.02956 | 4.2 | 6.5 (5.47.7) | 9.5 (7.013.5) | 45.2 | 13.0/16 | |
| subfield 1 | 2.6 | 1.9 (1.62.1) | 12.6 (10.316.4) | 20.5 | 219/176 | |
| subfield 2 | 1.0 | 1.6 (1.22.0) | 11.2 (7.918.4) | 7.5 | 223/176 |
As already pointed out in Paper I , the data of the LECS detector contained too few events for an independent source analysis. However, since the LECS data must be consistent with the results derived with the MECS, the lack of signal can be used as an additional constraint. Taking the spectral fits derived with the MECS data as the baseline, the low signal in the LECS band is used as a lower limit criterion for interstellar absorption, which is briefly described in Section 3.
Since the HPGSPC and PDS data are spatially unresolved, a further analysis of the sources at hard X-rays is not plausible. There is also a major complication due to the fact that sources outside the LECS and MECS field of view, especially the very strong source 1E1740.92942, most probably dominate the PDS spectrum. This is supported by the observed PDS spectrum in Fig. 2, and discussed in Section 3.
3 Results
The combined spectra of MECS detectors 2 and 3 were analysed using the XANADU/XSPEC version 10 software package (see http://heasarc.gsfc.nasa.gov/docs/xanadu/xspec/). As there is no a priori explanation for the X-ray emission in the sources, we tried several alternative spectral models. The spectrum models with interstellar absorption tried on each source were powerlaw, powerlaw with a Gaussian line (Fe ), Raymond-Smith, thermal bremsstrahlung, and blackbody radiation. Generally, the best models were Raymond-Smith, and powerlaw with or without a Gaussian. The powerlaw with a Gaussian line was applied mainly to obtain an estimate on the centroid energy (position) of the iron K-shell emission line. The best fitted spectral models are presented with the observed spectra in Fig. 1 and the numerical results are shown in Table 1. Most of the spectra are characterized by high hydrogen column density, and a strong iron line is observed in several sources.
The time variability of the sources was tested by calculating the from a constant fit to MECS data binned in photon bins. The length of time bins varies from 2 to 6 hours. Two sources, SAXJ1741.3-2948 and SAXJ1743.0-2956, were found to be variable at confidence above 99.99 , and one, SAXJ1740.8-2950, at confidence 99.67 .
The very low signal in the LECS data suggests high interstellar absorption, which is consistent with the spectral models fitted to MECS data. Quantitative comparisons of the expected LECS counts with those derived from the range of from the MECS spectral fits indicate that the interstellar absorption is more probably above the fit average than below it, and could even be as high as cm-2.

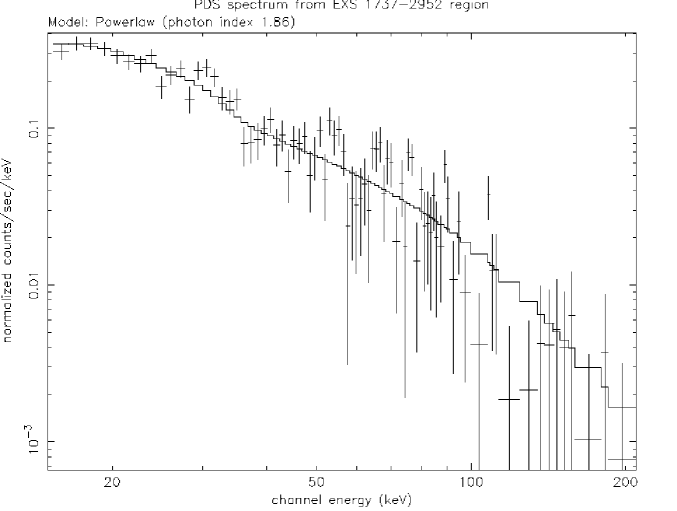
As the PDS instrument has no spatial resolution, we can only make estimates for the contributions of known sources in the field to estimate the total hard X-ray flux from the new sources. Apart from our new sources, the main contributor in the PDS field is probably 1E1740.72942. Using the PDS spectrum slope (powerlaw with , see Fig. 2) and the flux ( between 15-200 keV) from the EXS field, we can make comparisons to other existing data from this source. If we take into account the effect of the PDS collimator efficiency for off-axis objects (50% efficiency at ) we find that a major fraction of the total PDS flux can be covered with the flux of 1E1740.72942. An estimate interpolated in time from the nearly simultaneous (MJD 50915.45) Rossi XTE All Sky Monitor (ASM) count rate of 1E1740.72942 is ASM counts/s, which corresponds to (15200 keV). The estimate is uncertain due to the fact that the ASM data covers a lower energy range (210 keV) than the PDS spectrum (15200 keV), and the spectrum slope may be different for these two energy regions. The PDS spectrum slope suggests a harder spectrum than the typical range of slopes () for different states of 1E1740.72942. This could be explained by the high energy contribution of our new SAX sources. Estimating the total flux from the 10 sources at the PDS energy range we obtain a flux summing up an average of the observed spectrum slopes (). This covers 50% of the observed PDS flux. Thus, with the uncertainties in the above estimates, the observed PDS spectrum can be well explained with the contributions from our new SAX sources and the contribution of 1E1740.72942.
Additional uncertainty in the PDS spectrum may be caused by a strong source in the PDS background field. One of the two fields which were used as background includes SLX 1735-269. It has been observed e.g. by Sigma (see Goldwurm et al. Gol96 (1996)), and clear variations have been detected in hard X-rays. Using the average Sigma spectrum at range 30200 keV, we derived an estimate for the PDS energy range, taking into account the collimator efficiency at the position offset of SLX 1735-296 during our background observation. It turned out that SLX 1735-296 could have been as bright as at 15-200 keV. Conclusively, the uncertainty in the total hard X-ray flux of the new sources is at least several tens of percent.
4 Previous observations of the EXS1737.92952 region
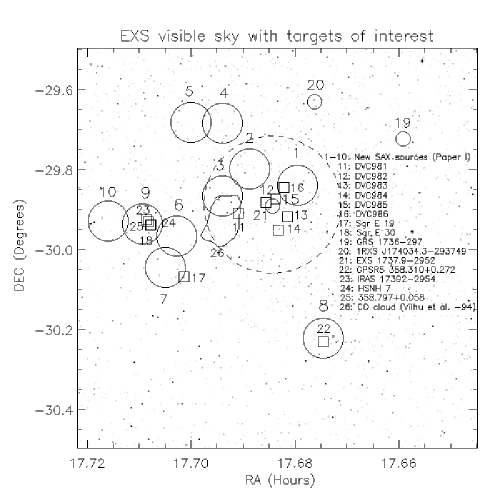
There are a number of previously known sources in the observed region. These are shown in Fig. 3 and discussed case by case below.
Sources 11-16: A part of the SAX/EXS field has been mapped with the VLA at 20 cm and 6 cm (Durouchoux et al. Dur98 (1998), DVC981-6) and with the SEST in (Vilhu et al. Vil94 (1994)). One of the VLA sources (DVC986) overlaps with an X-ray source (source 1), and it is thus possible that the radio source DVC986 is actually the same physical source as SAXJ1740.8-2950.
EXS 1737.92952 is close to the Sgr E complex, and in the field of our X-ray observations there are 5 known radio and infrared sources which belong to Sgr E (sources 17, 18,23,24, and 25 in Fig. 3).
Source 17: A VLA map at 1.6164 MHz of the Sagittarius region (Liszt Lis92 (1992)) covers a fraction of the EXS field with four new SAX sources, SAXJ1742.22958, SAXJ1742.33003, SAXJ1742.62956 and SAXJ1743.02956 (sources 6,7,9 and 10, respectively). The closest match between the radio and the X-ray sources is Sgr E 19 (Liszt Lis92 (1992)) which is at from SAXJ1742.33003 nominal position. E 19 is the brightest radio source in Sgr E, and its estimated ionized hydrogen mass is (Liszt Lis92 (1992)). With the uncertainty of the X-ray source position, sources E 19 and SAXJ1742.33003 could be the same physical source.
Sources 18,23,24, and 25: Source 14 in Liszt (Lis92 (1992)), or Sgr E 30 (source 18 here) is less than from SAXJ1742.62956 (source 9) nominal position. It is a star-forming region, with an estimated HII mass of (, Liszt (Lis92 (1992); , Gray et al. Gra93 (1993)). Sources from other surveys near SAXJ1742.62956 are the infrared and water maser source IRAS 173922954 (source 23 here) (Codella et al. Cod95 (1995)), HSNH 7 of the Nobeyama 10 GHz survey (Handa et al. Han87 (1987), source 24 here), and the HII region 358.797+0.058 (Lockman et al. Loc96 (1996)),source 25 here). HSNH 7 is an extended source of size . All these radio and IR observations support the scenario where SAXJ1742.62956 is embedded in the ISM, which would also explain the high hydrogen column density.
Source 19: GRS 1736297, also known as RXJ 1739.42942, is a Be-type X-ray binary (Motch et al. Mot98 (1998)). It was discovered with the ART-P X-ray telescope on GRANAT (Pavlinsky et al. Pav94 (1994)) and also detected with ROSAT (Motch et al. Mot98 (1998)). In the ART-P observation, GRS 1736297 had a flux of (420 keV), and the spectrum was a powerlaw with photon index . If is set to , this corresponds to a flux of between 210 keV for SAX MECS, which is clearly above the detection limit. In our SAX MECS observations GRS 1736297 was not detected, indicating that the source is highly variable. The estimated upper limit for the X-ray flux of GRS 1736297 is (210 keV). This variation of the X-ray flux by at least one order of magnitude indicates that GRS 1736297 could be a Be X-ray transient, with a compact star in an elliptical orbit.
Source 20: 1RXS J174034.3293749 is a weak X-ray source discovered in the ROSAT all-sky survey (Voges et al. Vog99 (1999)). It is not detected in the LECS or MECS observations, although it is in the observed field. This may be due to the softness of its X-ray emission, and possible variability with low intensity state during our observations.
Source 22: GPSR5 358.310+0.272 is a radio source detected in the VLA 5 GHz Galactic plane survey (Becker et al. Bec94 (1994)). It is at from SAXJ1740.53013 (source 8) nominal position. The proximity of these two sources indicates that they may actually be the same object.
Source 26: A molecular cloud reported by Vilhu et al. (Vil94 (1994)) is close to the centre of our SAX field, with SAXJ1741.62952 (source 3) at the edge of the cloud. A comparison of the molecular hydrogen column density in the CO map () and our SAX/MECS spectral fit for atomic hydrogen (1 limits taken from Table 1, ) suggests that the X-ray source is probably behind the molecular cloud.
5 Interpretation and discussion
The common X-ray spectrum characteristics of the sources are the following. 210 keV flux above , corresponding to an unabsorbed luminosity of , where is the distance in kiloparsecs. The X-ray spectrum matches to a powerlaw model with line emission at 6-7 keV or Raymond-Smith thin plasma model. The spectrum is in both cases modified with significant interstellar absorption, .
A step towards understanding the nature of these objects is via an explanation for the high interstellar absorption. Vilhu et al. (Vil97 (1997)) have demonstrated that the values derived from CO radio maps match well with the absorption derived from spectral fits to X-ray data for 1E1740.92942 and are close to the values derived for our new sources ( cm-2). Therefore we have a good reason to assume that our new sources really are close to, or behind, the GC, and the X-ray luminosities are probably above .
Taking the luminosity level estimate as a new baseline still does not lead to a clear interpretation as to the nature of the new sources. It is also obvious, that there is no common explanation for the nature of all ten sources, since the X-ray spectra are not similar. The spectrum slope, possible variability, and characteristics of the iron line are the remaining classification criteria, which must be considered for each source separately. Also, the emission from the region outside the sources
We next summarize the iron line formation as background information for further discussion, and the following subsections will be devoted to detailed discussion of possible source classes.
K-shell iron lines at 6-7 keV are usually prominent in cosmic plasmas with temperatures of K, and iron lines have indeed been detected in large scale structures such as clusters of galaxies and Seyfert I galaxies as well as stellar-scale objects such as supernova remnants, X-ray pulsars and X-ray binaries (e.g. Stella Ste89 (1989), and references therein), cataclysmic variables (Yoshida, Inoue and Osaki Yos92 (1992)), and also low mass stars with active coronae (Singh, White and Drake Sin96 (1996)).
In the case of a collapsed object with associated strong X-ray flux and accreting matter around the object, the nature of iron K line formation depends on the ratio of incident X-ray flux and gas pressure, i.e. the ionisation parameter (Krolik, McKee and Tarter, Kro81 (1989)). The general dependence of the line energy on the corresponding process can be summarized as follows (Stella, Ste89 (1989)). If the plasma temperature is high ( K) e.g. due to high flux density of the incident radiation, and the gas is highly ionized (ionisation parameter is high), the K-line emission is predominantly due to recombination onto Fe XXVI or Fe XXV, and the line energy is keV. For low plasma temperatures (ionisation parameter is low, and K), the K-line comes mainly from fluorescence of weakly ionized gas, and the line is at keV. For the case of significantly lower line energy (e.g., around 6 kev), the explanation can be gravitational redshift near the compact object. The equivalent width of the line depends mainly on the angular extent of the line emitting gas as seen by the source of the incident X-rays.


5.1 Chromospherically active stars and cataclysmic variables
The X-ray spectra of chromospherically active stars usually show thin plasma emission with temperature up to several keV (Vilhu Vil94 (1994)). Those of magnetic cataclysmic variables show a soft (a few tens of eV) blackbody continuum and a hard thermal brehmsstrahlung component (in excess of 10 keV) with weak or nonexistent line emission, while non-magnetic CV’s have optically thin thermal plasma and/or bremmstrahlung continuum with typically 1-10 keV temperatures and an iron K line in many cases (for a review,see e.g. Mauche Mau97 (1997) and Cordova Cor95 (1995)). The observed X-ray continuum spectra of our new sources are relatively hard and most of them show a strong line at 6-7 keV. Non-magnetic CV’s, and even chromospherically active stars may thus show spectrum characteristics relatively close to those of our sources.
For chromospherically active field stars and cataclysmic variables the X-ray luminosities are typically (Vilhu Vil94 (1994); Verbunt et al. Ver97 (1997) ). For our new sources, the interstellar absorption indicates that their distance is close to, or bigger than 10 kpc, leading to X-ray luminosities of at least erg/s (210 keV) derived from the source intensities in the MECS band. The unabsorbed X-ray luminosities is even somewhat higher, although the effect of the interstellar absorption above 2 keV is not big (the enhancement could be as much as %). Using the luminosity criterion we may thus conclude that the new SAX sources are probably not chromospherically active field stars or cataclysmic variables.
5.2 X-ray binaries
The luminosities of X-ray binaries with neutron stars or black holes are above the level of erg/s (210 keV), and they can be even several orders of magnitude brighter (e.g. White, Nagase and Parmar Whi95 (1995)). Using this criterion, the new sources could be, albeit faint, X-ray binaries.
The continuum spectral hardness for X-ray binaries can vary significantly from fairly soft to very hard, even for a single object (e.g., black hole candidates) (see White, Nagase and Parmar Whi95 (1995)). Therefore all our new sources suit to the range of X-ray binary spectral slopes.
As discussed previously in section 5, Fe line energy can be used as a tracer for the physical processes involved. Considering LMXB’s, the line is more probably produced by recombination in the accretion disk corona, and should be near 6.7 keV. On the other hand, in HMXBs the fluorescent emission from an optically thick accretion disk is a plausible explanation for the iron line near 6.4 keV (or even at lower energies due to gravitational redshift). A study of X-ray spectra in public data archives for both HMXB’s and LMXB’s shows, however, that reality is not so simple, and classification of these systems by the iron line energy is not possible. HMXB’s can have an iron line well above 6.4 keV, and LMXB’s even below 6.4 keV, respectively (see e.g. Gottwald et al. Got95 (1995)).
As for our observations, seven of the ten new sources have prominent iron lines. For the remaining three sources (4,5,8), iron line position could not be determined from the powerlaw plus line model, although the data and the best fit Raymond-Smith model show indications of its existence. The Fe line energy varies from source to source in the range 6.1 to 7 keV, indicating possible differences in the line formation, but all sources remain candidates for both low and high mass X-ray Binaries.
X-ray binaries also show time variability, the period (or time scale) of which is indicative of its nature. The observed variability in sources 1, 2 and 10 (of the order of hours) suits well for typical LMXB’s, but lacking good enough statistics to demonstrate an X-ray light curve, is not a proof for the explanation.
5.3 Diffuse emission and X-ray scattering
The ASCA/SIS observations of the diffuse emission from the GC region (Koyama et al. Koy94 (1994), Tanaka et al. Tan00 (2000)) offer an alternative interpretation for the new sources.
According to the ASCA observations, the spectrum of the diffuse emission is a hard continuum (thermal bremsstrahlung temperature 14 keV) with strong emission lines of iron and lighter elements. No estimate for the absorption is given, but it is assumed that absorption is insignificant. Typical fluxes of a region (corresponding to the SAX/MECS point spread function) are of the order . Spatial variations in the intensity and energy of Fe line and absorbing column are seen, but the overall shape of the spectrum does not vary over the ASCA/SIS field of view (). A strong correlation between the radio and the X-ray structures is also seen in Fig.1 of Koyama et al. (Koy94 (1994)).
Fitting of a thermal bremsstrahlung model to our MECS spectra yields temperatures between 10 and 50 keV for the 10 new sources. Fits to Raymond-Smith model (See Table 1) yield even larger scatter in temperature, 8 to 60 keV. Large scatter in the iron line flux and position among the new sources also evident (see Fig. 1 and Table 1), but the high uncertainty does not allow a more quantitative analysis of the differences. The fluxes of the sources in the EXS region are similar to the diffuse emission of the GC, but the variations in spectral parameters in scales of a few arcminutes argues against the diffuse emission interpretation. In addition, three of our sources are temporally variable. Only SAXJ1742.62956 (source 9) has a spectrum consistent with diffuse emission. It has, however, a better local explanation. The radio source Sgr E 30 in the same position may be associated with the X-ray source, thus being an example of a compact interstellar cloud around an X-ray binary. The cloud could be exposed by the high energy radiation from the binary, and the scattering of X-rays by the cloud would then result to a spectrum of diffuse emission.
We also analysed two larger subfields in our MECS observations to find possible evidence for extended source scenarios. One of the subfields includes most of the new sources, and the other one is void.
A region with 15’ radius centred at source 3 includes 8 of the 10 new sources, added with emission in the field between them. The region is labeled as “subfield 1” in Table 1, and the observed spectrum with the spectrum fit (power-law plus line) is plotted in Fig. 4. Bremsstrahlung and Raymond-Smith models for the spectrum of this field yielded poorer fits. In addition to the strong line at 6.8 keV, there are signs of other lines at several energies between 2 and 5 keV. The 6.8 keV (iron) line and the other lines fit poorly to the lines in a Raymond-Smith spectrum for a single source. This supports our impression that the region contains a range of different sources, and the resulting spectrum is a combination of their spectra. Comparing the power-law indices of the spectra, the average spectrum in this subfield is harder than the average of the individual sources. It should be mentioned that a major part (over 70 per cent) of the emission in subfield 1 is external to the 8 new sources (i.e. it originates in the field between them). Thus there is a strong component of emission, which is diffuse in nature. However, the average hydrogen column density in this subfield (cm-2) is fairly high, which is not consistent with the diffuse emission observed by Koyama et al. (Koy94 (1994)).
The other region of 10’ radius (“subfield 2” in Table 1) does not contain any sources in our MECS observations, and it has a significantly weaker emission than “subfield 1” (the flux is approximately one third of that in “subfield 1”). The power-law index of this subfield is 1.8. The emission in subfield 2 is softer than average diffuse background. The photon index of the diffuse background is approximately 1.4, corresponding to a bremsstrahlung temperature of 40 keV (e.g. Gendreau et al. Gen95 (1995)). Since diffuse background does not contain strong line contributions, and the spectrum slope of subfield 2 also does not correspond to it, subfield 2 is probably not dominated by diffuse background. On the contrary, the spectrum slope, as well as the level of emission are close to the “local” diffuse emission at the GC region observed by Koyama et al. (Koy94 (1994)). The only difference is the high interstellar absorption (cm-2), which is typical of the whole MECS field observed by us.
A model for reflection and Compton scattering has recently been introduced by Churazov, Sunyaev, and Sazonov (Chu01 (2001)) to explain the observed X-ray spectrum of Sgr B2 cloud. It is near the GC and could be emitting reprocessed radiation due to a big X-ray flare at GC which may have occured a few hundred years ago. The “X-ray reflection nebula” model includes Compton scattering of an external hard X-ray continuum and fluorescence on the surface of the cloud. This process could, in principle, contribute to the X-ray spectra of our new sources. However, the slope of the observed continuum (clearly decreasing) below 7 keV does not support this scenario. Also the position of the iron line (above 6.5 keV) for sources 1-3 is not consistent with fluorescence. Since the spectrum signal is very low at energies above 7 keV, the possible iron absorption edge cannot be distinguished, and also the spectrum slope is uncertain above the edge. Considering these uncertainties, and the iron line position, we cannot exclude the possibility that there is significant contribution from X-ray reflection above 6 keV, most probably in sources 6, 7, and 9.
Conclusively, it is difficult to match our SAX MECS observations with diffuse emission near the Galactic Centre excluding X-ray point sources.
5.4 Supernova remnants
SNR’s typically have erg/s. Two of such young SNRs, Kepler and Tycho, are characterized by and , respectively (Smith et al. Smi89 (1989)). The spectrum slope of the Crab Nebula corresponds to a power law with photon index 2.1 (e.g. Cox Cox00 (2000)), and another SNR of similar age, 3C 58, has a slope with photon index 1.7 (Helfand et al. Hel95 (1995)). An example of a very young SNR is SN 1987A, which has been observed recently with the Chandra satellite by Burrows et al. (Bur00 (2000)). They report on X-ray spectrum with strong line emission concentrated at soft X-rays ( erg/s, erg/s), corresponding to a softer X-ray spectrum than for the older SNRs. SN 1987A shows an X-ray luminosity erg/s (2-10 keV), which makes it more difficult to use the luminosity criterion for distinguishing between low luminosity X-ray binaries and young SNRs.
Hardening of X-ray spectrum and an increase in the X-ray luminosity are probably general features in the time evolution of an SNR. The reason for this is the fact that a hard spectrum component due to deceleration of the shock wave begins to show only after the shock front has reached interstellar medium of sufficient density, and after that the hard spectrum component from shock heating increases with the volume of ISM involved. The time evolution of the remnant’s X-ray luminosity, as well as the shape of the X-ray emitting volume reflects the distribution of ISM around the exploded star. The ISM consists of not only matter ejected by the star via stellar wind during the giant phase, but also more ISM of different origin. Therefore the secular time evolution of the X-ray emission, and the observed morphologies of SNRs are strongly case dependent.
The new SAX sources have marginally harder spectra than a typical SNR, and three of the sources show variability at time-scales of hours, which are in contrast with the SNR interpretation. Two known supernova remnants, Cas A and N132D, have also been observed with BeppoSAX (Favata et al. 1997A , 1997B ), which provides a reliable comparison without differences in instrumental effects. According to Favata et al., both Cas A and N132D were found to have cooler CSM thermal spectrum components (3.5-4.2 keV, and 1.8-6.0 keV, respectively) than those found for our new BeppoSAX sources.
Given the uncertainties of our observations, nothing conclusive can be said for or against an SNR explanation for individual sources, except for the three variable sources, which definitely can be removed from the possible SNR list.
The possibility of one supernova remnant being responsible for all the emission should also be considered. If the whole field with all sources were interpreted as an SNR with an angular extent of half a degree, the distance of an SNR similar to Tycho would be about 60 pc. This is definitely not the case, since such young and nearby SNR could not have remained unobserved until now. Furthermore, for any nearby (distance less than 1 kpc) SNR, the high hydrogen column densities would be difficult to explain. Finally, variations of the spectrum within the suspected SNR shell, as well as the observed time variability are not characteristic to an SNR.
5.5 Extragalactic sources
The class of extragalactic sources, which would fit best to our observations, is dust-obscured Seyfert galaxies. A strong iron line is typical of a dust-obscured AGN. Also a typical slope of an AGN X-ray continuum (spectral hardness) is also similar to what we observed. The spectrum characteristics of our new sources would thus not rule out the extragalactic source hypothesis.
For our sources, the hydrogen column densities derived from the MECS spectral fits correspond closely with values derived from CO measurements of Galactic Centre region (e.g. Vilhu et al. Vil94 (1994)). Significantly higher values would be expected from extragalactic sources behind the GC. Such values are not ruled out, if we account for the bias towards higher column densities caused by the nonexistence of the sources in the LECS image of the same field. Thus the best candidates for extragalactic sources are among those of our sources with the highest hydrogen column densities.
The expected number of extragalactic sources brighter than (210 keV) in the MECS field of view is 0.2. This estimate is based on the logN-logS-relation of Ueda et al. (Ued99 (1999)). Thus, from statistical point of view, finding ten extragalactic sources from a MECS field is very unlikely, and this category is ruled out as a common explanation for our observations.
6 Conclusions
On the basis of the X-ray spectral fitting of our MECS observation, the new BeppoSAX sources are characterised by high hydrogen column density. Thus they are probably close to the Galactic Centre or behind it. Deriving from the nondetection of sources in the LECS observation of the same field, the hydrogen column density may be so high that even extragalactic origin might be possible. Using the assumption that the sources are near the GC, the (absorbed) X-ray luminosities of the sources are in the range erg/s (210 keV), and the maximum unabsorbed luminosities are 40% higher.
The rough indications of X-ray spectrum slope and iron line properties from the observation do not allow to find conclusive evidence for any specific interpretation as to the nature of the sources. It is, however, reasonable to consider case by case different types of sources as possible explanations for our observation. The following conclusions include first our considerations of a common explanation (diffuse emission near the GC, and a SNR) for the whole observed field.
The average emission spectrum of the region including 8 of the 10 new sources is hard (powerlaw photon index 1.3) and it includes a strong iron line at 6.8 keV (subfield 1 in Table 1, and Fig. 4). It also shows a strong interstellar absorption component (N). These features do not match the diffuse emission near the GC observed by Koyama et al. (Koy94 (1994)), and thus the diffuse emission scenario is improbable.
Taking into account the observed time variability of sources 1, 2, and 10, and the differences between the spectra of individual sources, an explanation of the whole field consisting of a supernova remnant is also very improbable. The minimum distance derived from the hydrogen column density would lead to to a size scale for the source, which is far too large for any single SNR. The spatial and temporal fluctuations of the X-ray spectrum also speaks for existence of a group of independent sources superimposed by a spectrum component due to the radiation and absorption by interstellar medium.
Considering explanations for the nature of individual sources in the field, one source category can be readily ruled out. The X-ray luminosities of the new sources are well above those of chromospherically active stars and cataclysmic variables.
From the remaining possible source categories, X-ray binaries are the most favourable explanation for all 10 sources. The observed luminosities of the new sources, assuming that they are near the GC or further away from us, are well within the range of X-ray binaries. X-ray binaries also provide a plausible explanation for the variability in the order of hours for three of the new sources (1,2, and 10), and the fairly hard X-ray spectra with 67 keV iron line emission suit well for typical XRBs.
The remaining seven sources (3-9), where variability could not be verified, might as well be supernova remnants or extragalactic sources (AGN), if just the spectrum characteristics are considered. However, the low probability of finding ten AGNs in a SAX MECS field makes the extragalactic explanation too far fetched. Judging from the expected number (0.2) of extragalactic sources with the observed luminosity of our sources, and the lack of identifications of extragalactic sources with any previous observations of our MECS field, we strongly suggest that the new SAX sources are all galactic.
Looking at the remaining exlanations, any of the sources 39 could be either a SNR or an X-ray binary. For the SNR scenario, it is not plausible to make further suggestions, since the soft X-ray emission, which would be a good diagnostic of different types of SNR, is strongly depressed, very probably by interstellar absorption. Also, the angular resolution of our observation is not good enough to distinguish any spatial features of a SNR at the GC distance.
The identification of the source for the hard X-ray transient (Grindlay et al. Gri93 (1993)) is still not possible on the basis of the presented observations, and the nature of EXS 1737.9-2952 remains an enigma.
Even a short observing time of the EXS region with large X-ray satellites like Chandra or XMM-Newton would improve significantly the classification of these new X-ray sources. Unfortunately we have not been successful enough to get observing time for our project with these facilities.
Acknowledgements.
The BeppoSAX satellite is a joint Italian and Dutch programme. We acknowledge the SAX instrument team for providing the results of the standard supervised analysis, and Drs Fabrizio Fiore and Luigi Piro for useful advice in our data analysis. This work is supported by a project research grant for Osmi Vilhu, and an appropriation for senior scientists for Juhani Huovelin, both provided by the Academy of Finland. This research has made use of NASA’s Astrophysics Data System Bibliographic Services.References
- (1) Becker R.H., White R.L., Helfand D.J., Zoonematkermani S., 1994, ApJS 91, 347
- (2) Boella G., Chiappetti L., Conti G., et al, 1997, A & AS 122, 327
- (3) Burrows, D.N., Michael, E., Hwang, U., et al., 2000, ApJ 543, L149
- (4) Churazov, E., Sunyaev, R., Sazonov, S., 2001, astro-ph/0111065
- (5) Codella C., Palumo G.C.C., Pareschi G., et al., 1995, MNRAS, 276, 57
- (6) Cordova F., 1995, in Lewin W.H.G., van Paradijs J. and van den Heuvel E.P.J. (eds.), X-ray binaries, Cambridge University Press, p. 331
- (7) Cox, A.N., ed., 2000, ”Allen’s Astrophysical Quantitites”, 4th ed., AIP Press/Springer, p. 194
- (8) Durouchoux Ph., Vilhu O., Corbel S., et al., 1998, ApJ 507, 781
- (9) Favata, F., Vink, J., Dal Fiume, D., et al., 1997A, A & A 324, L49
- (10) Favata, F., Vink, J., Parmar, A.N., Kaastra, J.S., Mineo, T., 1997B, A & A 324, L45
- (11) Frontera F., Costa E., Dal Fiume D., et al., 1997, A & AS 122, 357
- (12) Gendreau, K. C., Mushotzky, R., Fabian, A.C., 1995, P.A.S.J. 47, L5-L9
- (13) Goldwurm, A., Vargas, M., Paul, J., et al. ,1996, A & A 310, 857
- (14) Gottwald, M.; Parmar, A. N.; Reynolds, A. P., White, N. E., Peacock, A., Taylor, B. G, 1995, A & AS 109, 9
- (15) Gray A.D., Whiteoak J.B.Z., Cram L.E., Goss W.M., 1993, MNRAS 264, 678
- (16) Grindlay J.E., Covault C.E, and Manandhar R.P. 1993, A & AS 97, 155
- (17) Helfand, D.J., Becker, R.H., White, R.L., 1995, ApJ 453, 741
- (18) Handa T., Sofue Y., Nakai N., Hirabayashi H., Inoue M. 1987, PASJ 39, 709
- (19) Huovelin J., Schultz J., Vilhu O., Hannikainen D., Muhli P., Durouchoux Ph., 1999, A & A 349, L21 (Paper I )
- (20) Koyama K., Maeda Y., Sonobe T., Takeshima T., Tanaka Y., Yamauchi S., 1994, PASJ 48, 249
- (21) Krolik J.H., McKee C.F., Tarter C.B., 1981, ApJ 249, 422
- (22) Liszt H.S., 1992, ApJS 82, 495
- (23) Lockman F.J., Pisano F.J., Howard D.J., 1996, ApJ 472, 173
- (24) Manzo G., Giarusso S., Santangelo A., et al., 1997, A & AS 122, 341
- (25) Mauche C., 1997, in F. Makino, K. Mitsuda (eds.), X-ray imaging and spectroscopy of cosmic hot plasmas, Universal Academy Press, Tokyo, p. 529
- (26) Motch C., Guillout P., Haberl F., et al., 1998, A & AS 132, 341
- (27) Parmar A.N., Martin D.D.E., Bavdaz M., et al., 1997, A & AS 122, 309
- (28) Pavlinsky M.N., Grebenev S.A., Sunyaev R.A., 1994, ApJ 425, 110
- (29) Singh K.P., White N.E., Drake S.A., 1996, ApJ 456, 766
- (30) Smith A., et al., 1989, ApJ 347, 925
- (31) Stella L., 1989, proc. 23rd ESLAB Symp. on Two Topics in X-ray Astronomy, ESA SP-296, p. 19.
- (32) Sunyaev R.A., Churazov E., Gilfanov M., et al., 1991, A & A 247, L29
- (33) Tanaka Y., Koyama K., Maeda Y., Sonobe T., 2000, PASJ 52, L25
- (34) Ueda, Y. et al., 1999, ApJ, 518, 656
- (35) Verbunt F., Bunk W.H., Ritter H. and Pfeffermann E., 1997, A & A 327, 602.
- (36) White N.E., Nagase F. and Parmar A.N., 1995, in Lewin W.H.G., van Paradijs J. and van den Heuvel E.P.J. (eds.), X-ray binaries, Cambridge University Press, p. 1
- (37) Vilhu O. 1994, in D’Antona F.D., Caloi V., Maceroni C. and Giovanelli F. (eds.) ’ Evolutionary Links in the Zoo of Interacting Binaries’, Mem. Soc. Astronomica Italiana, vol. 65, No. 1. p. 61.
- (38) Vilhu O.,Durouchoux Ph., Wallyn P., Huovelin J., Bally J., 1994, in: F. Makino and T. Ohashi (eds.) “New Horizons of X-ray astronomy: First results from ASCA”, Universal Academic Press, p. 445
- (39) Vilhu O., Hannikainen D., Muhli P., Huovelin J., Poutanen J., Durouchoux Ph., Wallyn P., 1997, ESA SP 0379-6566; 382, p. 221-224
- (40) Voges B., Aschenbach Th., Boller H., et al., 1999, A&A 349, 389
- (41) Yoshida K., Inoue H., Osaki Y., 1992, PASJ, 44, 537