The Y2 Isochrones for -element Enhanced Mixtures
Abstract
We present a new set of isochrones in which the effect of the -element enhancement is fully incorporated. These isochrones are an extension of the already published set of Y2 Isochrones (Yi et al. 2001: Paper 1), constructed for the scaled-solar mixture. As in Paper 1, helium diffusion and convective core overshoot have been taken into account. The range of chemical compositions covered is . The models were evolved from the pre-main-sequence stellar birthline to the onset of helium burning in the core. The age range of the full isochrone set is 0.1 – 20 Gyr, while younger isochrones of age 1 – 80 Myr are also presented up to the main-sequence turn-off. Combining this set with that of Paper 1 for scaled-solar mixture isochrones, we provide a consistent set of isochrones which can be used to investigate populations of any value of -enhancement. We confirm the earlier results of Paper 1 that inclusion of -enhancement effects further reduces the age estimates of globular clusters by approximately 8% if [/Fe]=+0.3. It is important to note the metallicity dependence of the change in age estimates (larger age reductions in lower metallicities). This reduces the age gap between the oldest metal-rich and metal-poor Galactic stellar populations and between the halo and the disk populations. We also investigate whether the effects of -enhancement can be mimicked by increasing the total metal abundance in the manner proposed by Salaris and collaborators. We find such simple scaling formulae are valid at low metallicities but not at all at high metallicities near and above solar. Thus it is essential to use the isochrones rigorously computed for -enhancement when modeling metal-rich populations, such as bright galaxies. The isochrone tables, together with interpolation routines have been made available via internet.
1 Introduction
This paper presents an extension of the Isochrones: scaled-solar mixtures (Yi et al. 2001: Paper 1). Its purpose is to study the effect of the -element enhancement on theoretical isochrones. Already for some time, it has become clear that the abundances of some chemical elements, in particular the elements synthesized by nuclear capture reactions (the so-called -elements; e.g., O, Ne, Mg, Si, S, Ca, and Ti etc.), are enhanced with respect to iron in Population II stars. Norris et al. (2001) is one of the latest such studies which report that metal-poor stars do not have a scaled-solar chemical composition. One popular interpretation for this is that Population II stars formed in a relatively fast collapse of the proto-galaxy, in which a rapid chemical enrichment and -enhancement through efficient feedback from massive stars took place. Similar -element enhancements have also been observed in super metal-rich (greater than solar) stellar populations. Spectrophotometric studies of giant elliptical galaxies (Peletier et al., 1990; Rich, 1992), and more recent spectroscopic studies of stars in the bulge (McWilliam & Rich, 1999) and thick disk (Prochaska et al., 2000) of the Galaxy, using the Keck I telescope, indicate that various degrees of -element enhancement are commonplace. A thorough discussion of the significance of stellar abundances in understanding the evolution of stellar populations can be found in the reviews by Wheeler et al. (1989) and McWilliam (1997). Applications to elliptical galaxies, which also appear to be -enhanced, have been performed by Weiss et al. (1995) and Salaris & Weiss (1998), using the spectral indices of Worthey et al. (1992).
Because opacity tables for -enhanced mixtures covering the complete relevant range of temperature and density became available only recently, several sets of theoretical isochrones have been constructed assuming scaled-solar abundances for the elements heavier than helium. However, the obvious limitation is that they refer to the scaled-solar compositions only. For stars with -enhanced chemical compositions, one needs then to construct stellar models and isochrones for the particular distribution of metals. Although it is possible in principle to calculate a large number of possible combinations of -enhanced ratios, it would not be practical considering the degree of the uncertainties in abundance analysis and the size of the computational effort. VandenBerg et al. (2000), and Salasnich et al. (2000) are among the latest who published sets of the -enhanced isochrones assuming a particular choice for the -enhanced chemical compositions, based on the OPAL opacities (Rogers & Iglesias 1995, Iglesias & Rogers 1996).
In this study, we construct a set of -enhanced isochrones which is fully consistent with the standard set of Isochrones previously released for scaled-solar mixtures (Paper 1). The purpose of this research is twofold. One is to provide an extensive and consistent set of the Isochrones for general use. And, the other is to explore the validity of the common practice of mimicking -enhanced isochrones by adopting more metal-rich non--enhanced isochrones, utilizing a simple scaling formula in the heavy element abundance (Chieffi et al., 1991; Chaboyer et al., 1992; Salaris et al., 1993).
2 Stellar Evolutionary Computations
2.1 The solar mixture
The original Anders-Grevesse study (Anders & Grevesse, 1989) suggests a metal-to-hydrogen ratio of 0.0267, based on meteoritic iron. The solar mixture by Grevesse & Noels (1993) contains some significant changes to the CNO abundance in comparison to the Anders-Grevesse value. There was a major effort in the early 1990’s to determine new and more accurate CNO and Fe abundance in the Sun which were reported by Grevesse & Noels (1993). Finally, the solar iron abundance agrees with the meteoritic abundance; and in 1996, Grevesse et al. (1996) quoted at the surface of the Sun. However, more recent estimates suggest that systematic errors much larger than the errors quoted above may still exist in the measurements. Grevesse & Sauval (1998) lately found , with a 10% error estimate, and Asplund (2000), using a solar model atmosphere constructed with a more realistic treatment of convection, derives . This uncertainty in the observed directly translates into the uncertainty in the theory-predicted efficiency of diffusion just below the convection zone, in the solar tachocline. In fact, helioseismic inversions (Basu & Antia, 1997) show that the tachocline region is the least well understood part of the standard solar model.
2.2 The -element enhanced mixture
Although the -elements are undoubtedly enhanced in some stars, the enhancement factor for each -element is not well determined. VandenBerg et al. (2000) assumed a constant enhancement for most -elements in their work, while Salasnich et al. (2000) took an empirically-guided enhancement. Considering the degree of uncertainty in the observation, however, one cannot make a simple choice between these two assumptions.
In this study, we have made the assumption of a constant enhancement, as chosen by VandenBerg et al. (2000). The scaled-solar abundance ration of metals are taken from Grevesse & Noels (1993). In the -enhanced case, we adopt a mixture in which the -elements were enhanced by a constant factor with respect to the solar abundance ratios. The twice enhanced ([/Fe]=+0.3)and four times enhanced ([/Fe]=+0.6) mixtures as well as the solar mixture are summarized in Table 1. Note that, as in VandenBerg et al. (2000), we have assumed that the abundance changes in Mn and Al are anticorrelated with those of the -elements(VandenBerg et al., 2000; Norris et al., 2001).
| Element | [/Fe]=0.0 aa The scaled-solar abundance ratios of metals are taken from Grevesse & Noels (1993). | [/Fe]=+0.3 | [/Fe]=+0.6 |
|---|---|---|---|
| C | 8.55 | ||
| N | 7.97 | ||
| O | 8.87 | 9.17 | 9.47 |
| Ne | 8.08 | 8.38 | 8.68 |
| Na | 6.33 | 6.63 | 6.93 |
| Mg | 7.58 | 7.88 | 8.18 |
| Al | 6.47 | 6.17 | 5.87 |
| Si | 7.55 | 7.85 | 8.15 |
| P | 5.45 | 5.75 | 6.05 |
| S | 7.21 | 7.51 | 7.81 |
| Cl | 5.50 | 5.80 | 6.10 |
| Ar | 6.52 | 6.82 | 7.12 |
| K | 5.12 | ||
| Ca | 6.36 | 6.66 | 6.96 |
| Ti | 5.02 | 5.32 | 5.62 |
| Cr | 5.67 | ||
| Mn | 5.39 | 5.24 | 5.09 |
| Fe | 7.50 | ||
| Ni | 6.25 |
Note. — The abundance of the elements in logarithmic scale, , where is the abundance by number.
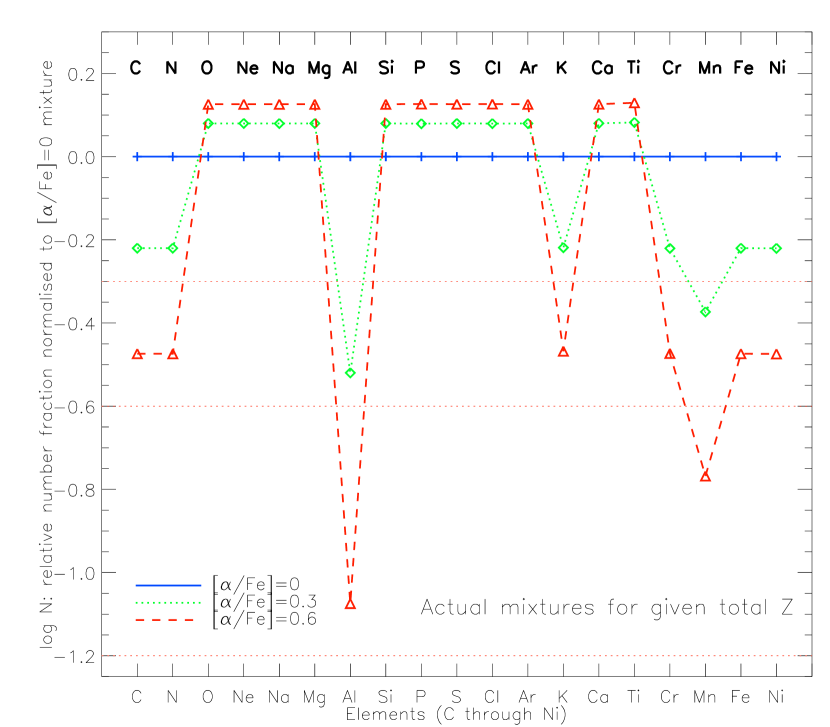
Figure 1 shows the relative abundances in the two -element enhanced mixtures (twice solar and four times solar, respectively), normalized to the solar mixture abundances. The legends [/Fe]=0.0, 0.3, and 0.6 denote solar mixture without -enhancement, two-times, and four-times -enhanced mixtures, respectively. Note that because total is fixed, -enhanced mixtures are only slightly (approximately by 0.1) above the non--enhanced mixture (top horizontal line at logN=0). When all mixtures are normalized to the -elements (e.g., O, Mg) the amount of -enhancement appears to be roughly a factor of two in the [/Fe]=0.3 mixture (dotted line) and four in the [/Fe]=0.6 mixture (dashed line), respectively. As mentioned above, Al and Mn have been assumed to be depleted. It is important to remember that our isochrones have been computed for a given total metallicity . In this context, more -enhanced isochrones are simply less abundant in non--elements. Oxygen is the most important element, and it affects both energy generation and opacity in an important way. Neon is also a significant contributor to interior opacities near the main sequence.
2.3 Metallicity parameters and composition scaling
Departing from the solar mixture can create confusion in assigning chemical abundance parameters to the isochrones, and in making comparisons with observations. Depending on the kind of data available, it is at times useful to parameterize heavy element content in terms of [Fe/H], or at other times in terms of . Generally, [Fe/H] is the quantity measured observationally by spectroscopy or photometry. Relative abundances by number are also favored in theoretical stellar atmosphere models. To help clarify possible confusion, Table 2 shows the conversion from [Fe/H] to for the solar mixture and the two -enhanced mixtures used in the calculations. Table 2 was constructed assuming that for the chemical enrichment.
| [Fe/H] | |||
|---|---|---|---|
| [/Fe]=0.0 | [/Fe]=+0.3 | [/Fe]=+0.6 | |
| -3.0 | 0.000019 | 0.000032 | 0.000058 |
| -2.5 | 0.000062 | 0.000102 | 0.000182 |
| -2.0 | 0.000195 | 0.000321 | 0.000574 |
| -1.5 | 0.000615 | 0.001012 | 0.001807 |
| -1.0 | 0.001935 | 0.003174 | 0.005627 |
| -0.5 | 0.006021 | 0.009774 | 0.016990 |
| 0.0 | 0.018120 | 0.028557 | 0.047000 |
| 0.5 | 0.049711 | 0.072793 | 0.106471 |
| 1.0 | 0.110798 | 0.142689 | 0.177489 |
There is another motivation for studying the relationship between and [Fe/H] for different chemical mixtures. Until recently, interior opacity tables were only available for the solar mixture, and in studies of very metal-poor systems, such as globular clusters and dwarf spheroidal galaxies, there was interest in mimicking the effects of -enhancement by correcting the metallicity used in the opacities. It was first pointed out by Chieffi et al. (1991) — see also (Chaboyer et al., 1992; Salaris et al., 1993; Salaris & Cassisi, 1996) — that one can simply write:
| (1) |
where is the -element enhancement factor and is the heavy element abundance by mass for the solar mixture with the same [Fe/H]. Note that the coefficients used here are taken from Yi et al. (2001), and are slightly different from those of Salaris et al. (1993) because they apply to the Grevesse-Noels solar mixture (Grevesse & Noels, 1993). Comparing with Table 2 reveals that this formula, which yields the correct values of at extremely low metallicities, becomes increasingly less exact at higher metallicities. This is due to two main reasons: at high metallicities, (1) the heavy elements contribute a larger fraction of the total mass in the mixture relative to hydrogen and helium, and (2) the helium mass fraction increases steeply with increasing (Table 2 assumes =2).
It is now possible to calculate opacities for -enhanced mixtures and investigate the validity of such scaling formulae for a wide range of metallicity. Detailed comparisons between isochrones based on scaled-solar mixtures and isochrones constructed for the correct -enhancement are discussed in the rest of this paper. We will confirm, as previously noted by several authors (Chaboyer et al., 1992; Salaris et al., 1993; VandenBerg et al., 2000), that simple scaling formulae are adequate at low metallicities. However, not surprisingly, such scalings and even simple interpolations turn out to be very unreliable at high metallicities.
2.4 Input physics and opacities
In order to maintain as much homogeneity and consistency with our solar mixture isochrones as possible, the input physics, calibrations and computational details were kept the same for this set of evolutionary tracks as in Paper 1. A full description can be found in § 2 of Paper 1.
The only difference is in the opacity tables. The effect of the -element enhanced mixture on the opacities has been taken into account. The OPAL opacities for the Grevesse & Noels (1993) mixture were used for the computation, as in Paper 1. These opacities are now regarded as one of two best sets of Rosseland mean opacities available today, the Opacity Project tables being the other (Seaton et al., 1997). The fact that both sets of opacities, which were calculated independently and using different physical models, are for the most part in excellent agreement, lends support to their validity. Lately, the OPAL group released newer tables for the Grevesse & Noels (1993) solar mixture that include the effects of seven additional heavy elements as well as some physics changes (Rogers & Iglesias, 1995; Iglesias & Rogers, 1996). The OPAL interior opacities used in this paper were generated for each -element enhanced mixture from the OPAL web site (www-phys.llnl.gov/Research/OPAL/).
At low temperatures, tables were computed specifically for the -enhanced mixtures by one of us (DRA). These low temperature opacity tables were constructed using the same physics as the solar mixture low temperature opacity tables published by Alexander & Ferguson (1994).
2.5 Solar Calibration, Evolutionary Tracks and Isochrone Construction
For internal consistency, we used the same solar calibration as in Paper 1. In Paper 1, a model of the Sun was evolved from the zero-age main sequence (ZAMS) to the current solar age of 4.55 Gyr (Guenther, 1989). The mixing length to scale height ratio () and the initial helium content () were adjusted in the usual way so as to match the solar luminosity, radius, and the observed solar ratio of heavy element to hydrogen abundance (Grevesse et al., 1996) at the solar age. The mixing length parameter , the initial , and were used to produce this match. At the solar age, the solar model has the surface hydrogen abundance , which satisfies , consistently with the recent standard solar models of Guenther & Demarque (1997) and Winnick et al. (2002). The same mixing length parameter was used for all models.
Evolutionary tracks were constructed for the masses 0.4 to 5.0 and for the metal abundances, . In this study, the was assumed to be 2.0, which is consistent with the initial = (0.23, 0.00) and the solar calibration above. Unlike many studies, which are based on evolutionary tracks with starting points on the ZAMS, all models in this grid were evolved from the pre-MS stellar birthline (Palla & Stahler, 1990, 1993) to the onset of helium burning. This enabled us to construct isochrones for younger ages. The age range of the isochrone set was 0.1 – 20 Gyr. All isochrones in this age range are suitable for population synthesis.
In addition, very young isochrones, for ages of 1, 2, 4, 6, 8, 10, 20, 40, 60, and 80 Myr have been included. However, because these isochrones reach only up to 5 , they do not cover the red giant branch (RGB). So, one must not use them by themselves for population synthesis studies. But they would be useful for color-magnitude diagram (CMD) fitting of young clusters, in particular as they begin at the pre-MS birthline. The treatment of convective core overshoot is the same as in Paper 1 (Yi et al., 2001). The overshoot parameter was chosen to be 0.2 for age3 Gyr. The two independent color transformation tables of Green et al. (1987) and of Lejeune et al. (1998) are adopted as in Paper 1, making two separate sets of isochrones available.
3 Effects of Enhanced -element Abundances
3.1 Isochrone morphology
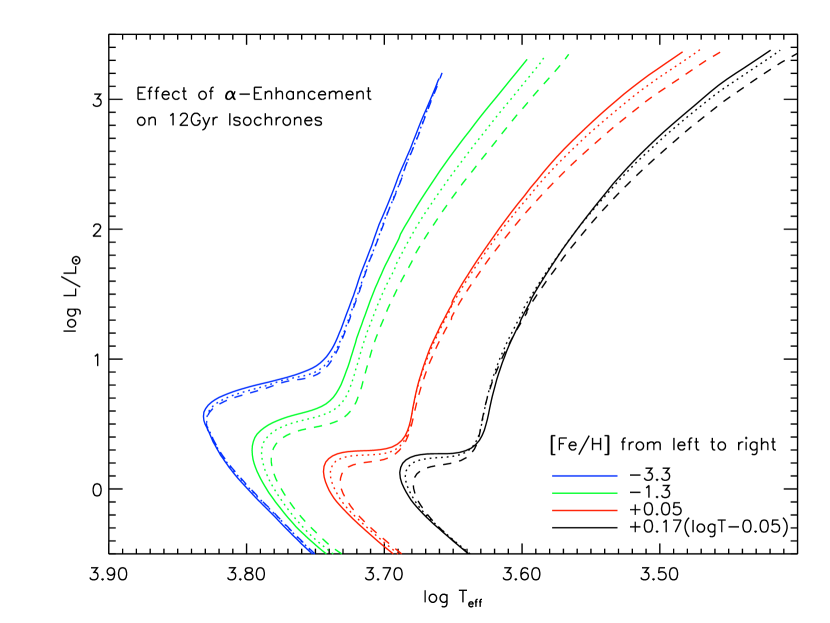
The overall effects of the enhanced -element abundances on the isochrone morphology are complex at all metallicities because they involve a non-linear interaction between opacities and energy generation. The effects are shown in Figures 2 and 3.
Figure 2 shows that low metallicity isochrones (panels a and b) depend primarily on the total amount of heavy elements, and not much on the mixture of heavy elements. The effects of the -element enhancement are still complicated since they affect both the energy generation and the opacity, but they are less noticeable in the HR-diagram. The location of the giant branches and the turn-offs are not a monotonic function of the degree of -enhancement. Although these effects are very small, they are visible in the figures. For example, the MS turn-off temperatures of the young (1 Gyr) isochrones are not in linear relation with the magnitude of -enhancement at extremely low metallicities (panel a). These non-linear behaviors of the isochrone morphology are the first indications that a simple scaling law cannot fully reproduce the -enhancement effects.
The complexity of -enhancement effects are magnified in metal-rich isochrones (Figure 2-(d) for example). When the total metal abundance, , is fixed, increased [/Fe] means ‘less’ iron abundance which is the main provider of free electrons. Near the turn-off, this results in the -enhanced isochrones behaving as if they have lower metal abundance in comparison to the scaled-solar ones. As shown in this figure, the -enhanced isochrones generally have their turn-offs at higher temperature. For the younger isochrones whose turn-off stars derive most of their luminosity from the CNO cycle during the main sequence (MS) phase, -enhancement also affects the MS lifetime. Thus, the turn-off masses of the -enhanced isochrones are smaller, resulting in the lower luminosity and higher temperature of the turn-offs as the -element abundance increases. While the location of the MS is mainly affected by the oxygen abundance, that of the red giant branch is mainly determined by the iron abundance and the abundance of -elements heavier than oxygen. For a given , more -elements means less iron, which in turn means fewer free electron, and lower atmospheric opacity. Thus, as [/Fe] increases, the red giant branch of the isochrones shift toward higher temperature and luminosity.
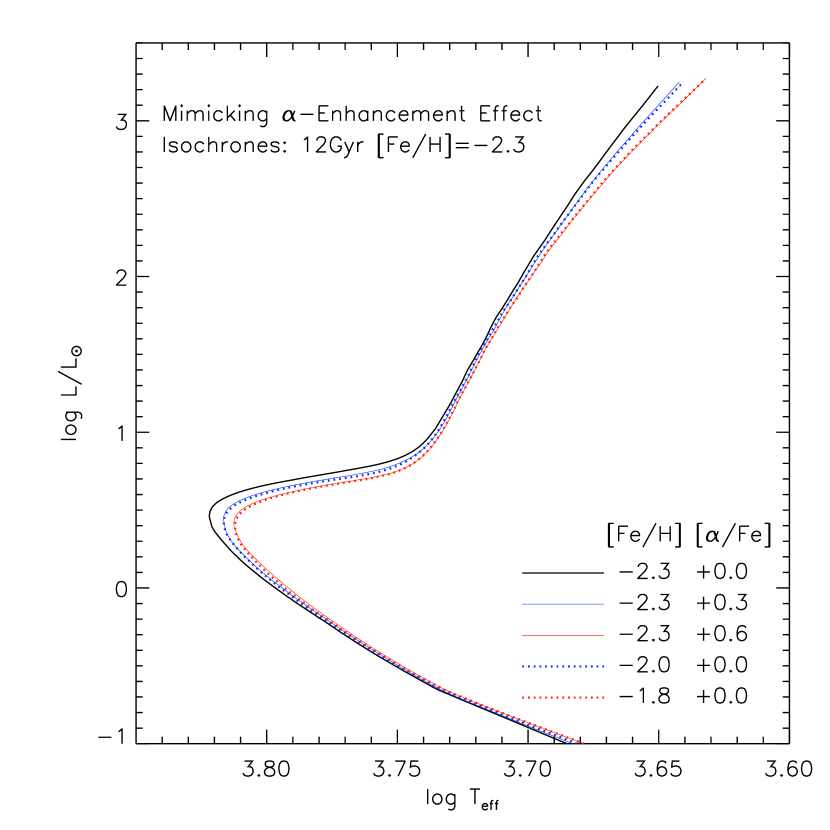
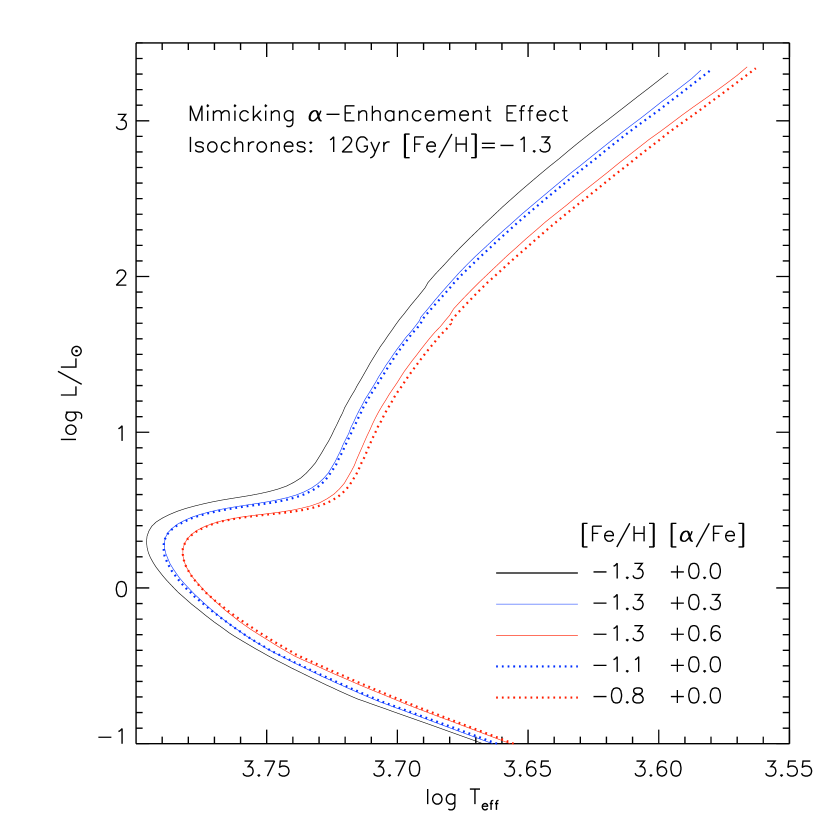
When the isochrones are plotted for a fixed [Fe/H], as in Figure 3, the behavior of the isochrone morphology is easier to understand. The major factor here is the overall metal abundance . For a fixed [Fe/H], the -element enhancement means simply the increase of the overall metal abundance. The clearest linear trend is visible in Figure 3-(b) where [Fe/H]= (typical Galactic globular cluster metallicity) models are displayed. Here again, however, one may find a clue that simple scaling laws cannot be valid: although one notices a general trend toward lower temperature and luminosity with increasing [/Fe], changes in the gradient of the giant branches with increasing luminosity are recognizable even in the metal-poor cases.
At the lowest metallicities, the main source of opacity in the interior is derived from the free-free transitions of hydrogen and helium, and models on the MS are unaffected by the relative heavy element abundances. The principal effect of -enhancement is to increase the relative importance of the CNO cycle in the energy generation. As first pointed out by Simoda & Iben (1968), this results in an earlier central hydrogen exhaustion, resulting in a less luminous turn-off for a given age. This effect is important in that CNO enhancement with respect to hydrogen reduces the derived ages of globular clusters with a given [Fe/H] without modifying appreciably the MS position (Figure 6). At higher [Fe/H], the interplay between opacity effects and energy generation is more complex, as is evident in Figure 3-(d).
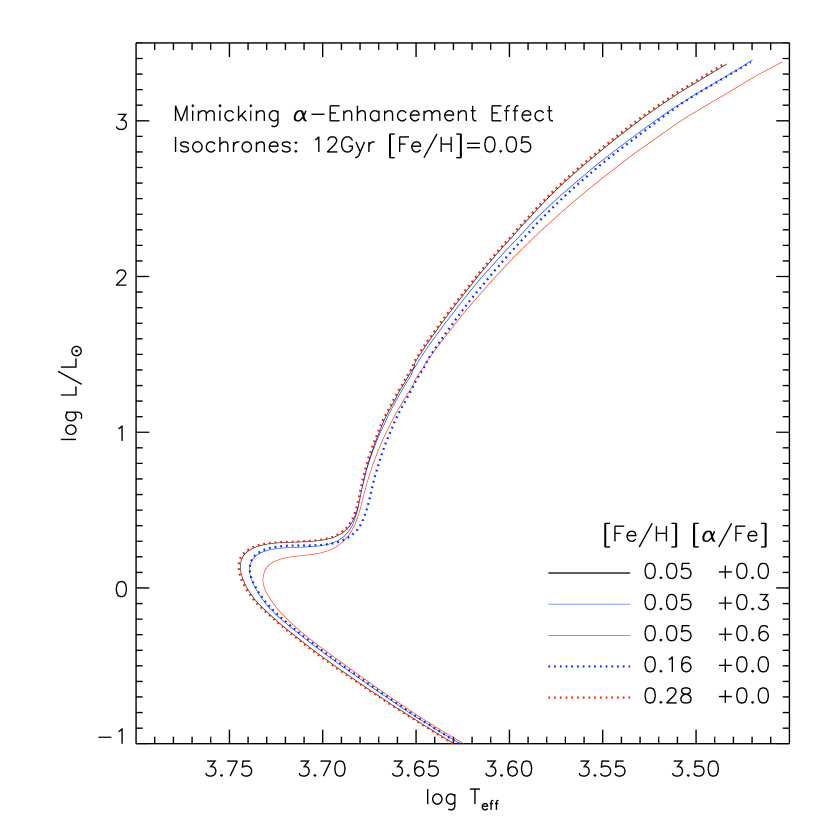
The complex metallicity dependence of the effects of -enhancement is illustrated in Figure 4. The four sets of 12 Gyr isochrones are for various values of [Fe/H] and -enhancement. Note that the most metal-rich isochrones (a group of three on the right) have been shifted by to the right so that they appear separated from the [Fe/H]=0.05 (approximately solar) isochrones.
3.2 Isochrone Ages
The changes in age estimates from the twice and the four times -enhanced cases with respect to that of the Revised Yale Isochrones (Green et al. 1987), are summarized in Table 3, together with that of the updated input physics (the Isochrones–solar mixture). The ages were derived based on the turn-off luminosity defined as (1) total theoretical luminosity (denoted as ‘’), (2) visual magnitude estimated using the Green et al. table, (G), and (3) visual magnitude estimated using the Lejeune et al. color table, (L).
The age changes in the [/Fe]=0.0 ‘’ column are the same as those in Table 7 of Paper 1. The approximately 15% age reduction in Galactic globular cluster metallicity range comes from the update in the physical input in stellar model calculation and does not include the effect of -enhancement. Quite expectedly, the two -enhanced models (columns 5 and 8) show that there is further age reduction when -enhancement is considered. But it should be noted that here we are not comparing the models of the same total any more. Instead, we have fixed [Fe/H], which is usually the observationally measured quantity, and inspected the effects by changing [/Fe], which is similar to increasing total . Note that the -element enhancement would not affect much age estimates if the total were to be fixed. The amount of further age reduction due to -enhancement is approximately 8 and 23% for [/Fe]=0.3 and 0.6 cases, respectively. The total age reduction, derived from the turn-off luminosity, between RYI and Isochrones is as much as 19–23% for moderately -enhanced populations. Figure 5 shows this effect using [/Fe]=0.3 isochrones.
We prefer theoretical luminosities () for this analysis to magnitudes () because is free from the uncertain luminosity-to-magnitude conversion scheme, which is a part of the color transformation procedure. Yet, observers depend on observed quantities; and thus we present similar comparisons using turn-off magnitudes in other columns of Table 3 and in Figure 6. The -based age reduction is by and large comparable to that from theoretical luminosity. All this illustrates the difficulty of estimating stellar ages in systems for which only [Fe/H], but not [/Fe], is known.
| [/Fe]=+0.0 | [/Fe]=+0.3 | [/Fe]=+0.6 | |||||||
|---|---|---|---|---|---|---|---|---|---|
| [Fe/H] | aaThe ages were derived from the theoretical turn-off luminosities. | (G)bbThe ages were derived from the V magnitude of the turn-off based on the Green color tables. | (L)ccThe ages were derived from the V magnitude of the turn-off based on the Lejeune color tables. | aaThe ages were derived from the theoretical turn-off luminosities. | (G)bbThe ages were derived from the V magnitude of the turn-off based on the Green color tables. | (L)ccThe ages were derived from the V magnitude of the turn-off based on the Lejeune color tables. | aaThe ages were derived from the theoretical turn-off luminosities. | (G)bbThe ages were derived from the V magnitude of the turn-off based on the Green color tables. | (L)ccThe ages were derived from the V magnitude of the turn-off based on the Lejeune color tables. |
| -2.3 | -15 | -12 | -12 | -19 | -18 | -18 | -31 | -25 | -26 |
| -1.7 | -14 | -12 | -13 | -23 | -21 | -21 | -40 | -32 | -35 |
| -1.3 | -15 | -13 | -16 | -23 | -20 | -26 | -38 | -35 | -40 |
| -0.7 | -10 | -6 | -14 | -19 | -12 | -20 | -26 | -26 | -35 |
| 0.0 | 12 | 14 | 6 | 7 | 6 | -3 | -8 | -8 | -18 |
4 Scaling formulae that simulate -enhancement effects
Many studies have shown that the effects of the -enhancement on the early evolution of low mass stars may be treated by increasing the overall of models computed for scaled-solar mixtures of the heavy elements (Chieffi et al., 1991; Chaboyer et al., 1992; Salaris et al., 1993; Salaris & Cassisi, 1996). Salaris et al. (1993) type formula for the Grevesse & Noels (1993) mixture has been mentioned above as Eqn. (1). The validity of such a scaling procedure should be investigated especially for the higher metallicities (Weiss et al., 1995; Salaris & Weiss, 1998).
Figures 7 and 8 represent independent confirmation of the results of VandenBerg et al. (2000). The plots show that at least at low metallicities the -enhancement effect on the overall shape of the isochrone can be mimicked by adopting more metal-rich non--enhanced isochrones. It is important to note that our matching effort was made to fit the upper MS. Since empirical determination of the turn-off temperature is not easy, and since the turn-off luminosities of the simulated isochrones seem not so different from those of the -enhanced ones (see below), it seemed to us sensible to concentrate on the upper MS near turn-off, but not on the turn-off itself.
Figure 7 shows the 12 Gyr isochrones for [Fe/H]=. The twice and four times -enhanced models are compared with the more metal-rich non--enhanced models. The overall fit is good. It is clear that as metallicity increases, such scalings become less reliable. At [Fe/H]=, the simulated models (dotted lines) produce good fits on the MS of the -enhanced models but fail to match the giant branches, as shown in Figure 8. A bit of the shift in the giant branches may be corrected by a small reduction of . But in this analysis, we assumed that the MS is generally the branch that is best determined empirically and thus put more weight on MS fitting. Besides, such small differences will be considered smaller than the accuracy of current stellar models anyway.
The fits become impossible when metallicity is as high as close to solar, as shown in Figure 9. Our numerous simulations showed that no single simulated isochrone can match the true -enhanced model for all of MS, MS turn-off, and red giant branch simultaneous. We conclude that it is recommended to use any such simulation formulae at high metallicities.
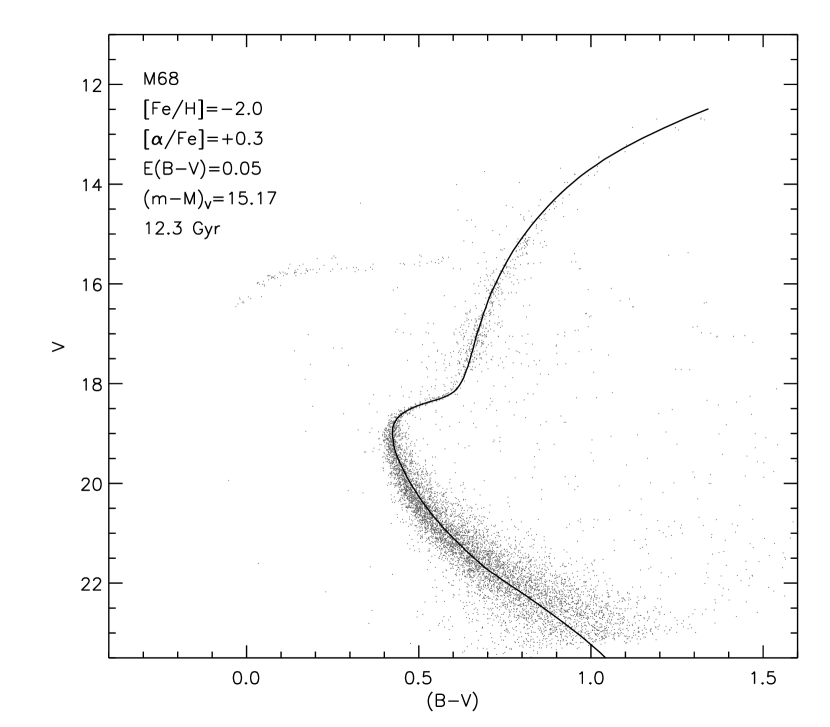
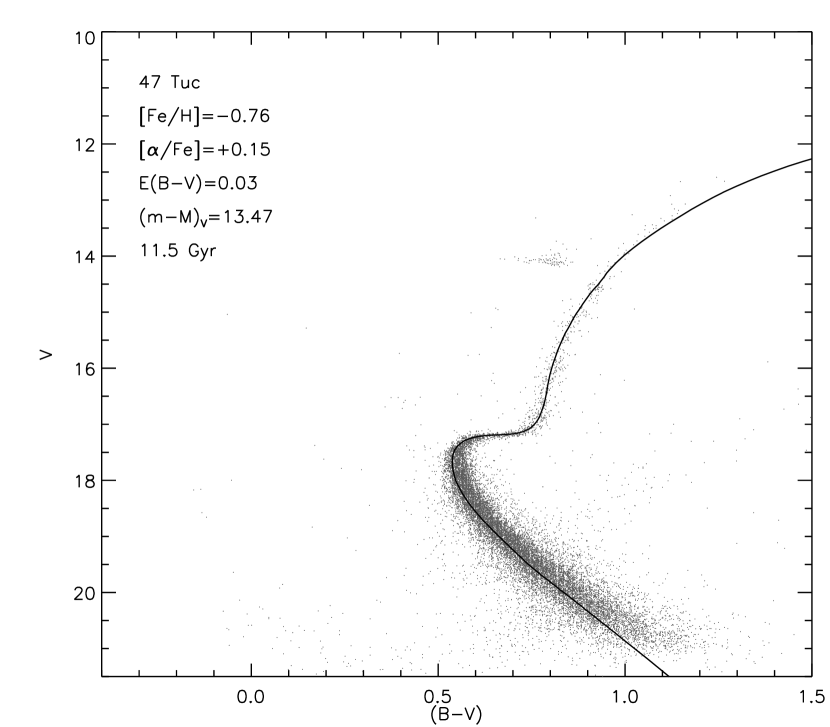
In Paper 1, we presented isochrone fits to two globular clusters, one metal-poor (M 68), the other metal-rich (47 Tuc), using non--enhanced isochrones but corrected for -enhancement using previously available simulation formulae. We present the same fits now using true -enhanced isochrones. Figures 10 and 11 show the fits. The fits are at least as good as in Paper 1; the only difference is that we do not need such formulae any more. In general, globular cluster distances are still uncertain that one should not place too much reliance on the quality of this kind of CMD fitting. It is remarkable, however, that the distance modulus used for 47 Tuc in Figure 11, (m-M)=13.47, is within 1.0 of the latest value based on the main sequence fitting using 43 local subdwarfs (Hipparcos) which is (Percival et al., 2002). And, it is within 1.4 of the white dwarf distance modulus, 13.27 0.14 (Zoccali et al., 2001). This is a rather good agreement considering many uncertainties not only in distance, but also in the bolometric correction and color calibration etc.
5 Summary and discussion
This paper presents an extension of the isochrones (Yi et al., 2001) including the effects of -element enhancement. Two values of -enhancement, [/Fe]=0.3 and 0.6 have been considered.
As in Paper 1, pre-MS evolutionary phases are included, allowing for the construction of younger isochrones. Isochrones including the complete hydrogen burning phase, suitable for population synthesis, have been constructed for the age range 0.1 – 20 Gyr. In the case of stars with a convective core near the MS, overshoot by 0.2 pressure scale height at the edge of the convective core has been taken into account. An additional set of very young isochrones for ages 1 – 80 Myr is presented. They are unsuitable for population synthesis because their post-MS phases are not included but would be useful for comparing with the CMDs of very young stellar populations.
We confirm that the use of simple scaling formulae, such as the one introduced by Salaris et al. (1993), can approximate the effect of -enhancement on the isochrone morphology especially at low metallicities. Thus, such formulae, in the absence of appropriate models, can be useful to the studies of globular clusters and dwarf spheroidal galaxies. However, the range of validity of such scaling laws is limited. In general, because of the complex interaction between opacities, the equation of state and nuclear processes, it is not possible to derive a scaling formula that is applicable for a large range of .
From the point of view of stellar population chronology, this paper confirms that for a given [Fe/H], the updated isochrones that include the effects of -element enhancement lead to significant age reductions of up to 23% if [/Fe]=0.3, as shown in Table 3. Approximately a third of this reduction is due to a factor of two increase in the -element abundances (see the difference between the second and fifth columns in Table 3). A new result, which is equally important, is the age increase at high , which removes the age gap that used to exist between the oldest metal-rich and metal-poor stellar populations.
Caveats of this work include the treatment of -enhancement in the temperature-color transformation. Theoretical stellar properties (temperature, gravity, etc.) are converted to observable quantities (magnitudes and colors) based on a stellar spectral library (in our case, either the Green et al. table or the Lejeune et al. table). Such a spectral library is usually calibrated empirically so that it reproduces the colors of sample stars in the Milky Way for a given set of parameters. In fact, the calibration is based on a limited and incomplete sample. For example, such Milky Way samples may imply [/Fe]=0.3 for [Fe/H]=2, [/Fe]=0.15 for [Fe/H]=0.7, and [/Fe]=0.0 for [Fe/H]=0. Users of these isochrones should be warned that for this reason, interpolated isochrones, even if well within our parameter range ([/Fe] = 0.0 – 0.6), are not necessarily based on a proper temperature-color transformation scheme. Some colors are more sensitive to [/Fe] than others. Thus, a full -enhancement treatment will be possible only when temperature-color transformation schemes are available for a wide range of -enhancement as well.
Similarly, the importance of -enhancement effects on the spectral line analysis for clusters and galaxies has been recognized (Vazdekis et al., 2001) as well. The effects of -enhancement occur mainly in two steps. The first is in the stellar model construction through opacities and energy generations. The next is through the convolution of the stellar models with a stellar spectral library. For this reason, one must have a properly -enhanced stellar spectral library for a wide range of -enhancement in order to generate consistent population synthesis models.
Despite the caveats, we believe that these new isochrones with -enhancement options will be useful in many studies. The full set of isochrones and a FORTRAN package that work for age, metallicity, and -enhancement interpolation are available at the following internet sites.
http://www-astro.physics.ox.ac.uk/yi/yyiso.html
http://www.astro.yale.edu/demarque/yyiso.html
http://csaweb.yonsei.ac.kr/kim/yyiso.html
References
- Alexander & Ferguson (1994) Alexander, D. R. & Ferguson, J. W. 1994, ApJ, 437, 879
- Anders & Grevesse (1989) Anders, E. & Grevesse, N. 1989, Geochim. Cosmochim. Acta, 53, 197
- Asplund (2000) Asplund, M. 2000, A&A, 359, 755
- Basu & Antia (1997) Basu, S. & Antia, H. M. 1997, MNRAS, 287, 189
- Chaboyer et al. (1992) Chaboyer, B., Sarajedini, A., & Demarque, P. 1992, ApJ, 394, 515
- Chieffi et al. (1991) Chieffi, A., Straniero, O., & Salaris, M. 1991, in ASP Conf. Ser. 13, The Formation and Evolution of Star Clusters, ed. K. Janes (San Francisco: ASP), 219
- Girardi et al. (2000) Girardi, L., Bressan, A., Bertelli, G. & Chiosi, C. 2000, A&A, 141, 371
- Green et al. (1987) Green, E. M., Demarque, P., & King, C. R. 1987, The Revised Yale Isochrones and Luminosity Functions (New Haven: Yale Univ. Obs.)
- Grevesse & Noels (1993) Grevesse, N. & Noels, A., 1993, in Origin and Evolution of the Elements, eds. N. Prantzos, E. Vangioni-Flam, & M. Cassé (Cambridge: Cambridge Univ. Press), 15
- Grevesse et al. (1996) Grevesse, N., Noels, A., & Sauval, A. J., 1996, in Cosmic Abundances, ASP Conf. Ser. Vol. 99, eds. S. S. Holt & G. Sonneborn (San Francisco: Astron. Soc. Pacific), 117
- Grevesse & Sauval (1998) Grevesse, N. & Sauval, A. J., 1998, Space Science Reviews, 85, 161
- Guenther (1989) Guenther, D. B. 1989, ApJ, 339, 1156
- Guenther & Demarque (1997) Guenther, D.B. & Demarque, P. 1997, ApJ, 484, 937
- Harris (1996) Harris, W.E. 1996, AJ, 112, 1487
- Iglesias & Rogers (1996) Iglesias, C. A. & Rogers, F. J. 1996, ApJ, 464, 943
- Lejeune et al. (1998) Lejeune, Th., Cuisinier, F. & Buser, R. 1998, A&A, 130, 65
- McWilliam (1997) McWilliam, A. 1997, ARA&A, 35, 503
- McWilliam & Rich (1999) McWilliam, A. & Rich, R. M. 1999, in Chemical Evolution from Zero to High Red Shift, Proc. ESO Workshop, Garching, ed. J. R. Walsh & M. R. Rosa (Springer-Verlag: Berlin), 73
- Norris et al. (2001) Norris, J. E., Ryan, S. G., & Beers, T. C. 2001, ApJ, 561, 1034
- Palla & Stahler (1990) Palla, F. & Stahler, S. W. 1990, ApJ, 360, L47
- Palla & Stahler (1993) Palla, F. & Stahler, S. W. 1993, ApJ, 418, 414
- Peletier et al. (1990) Peletier, R. F., Valentijn, E. A., & Jameson, R. F. 1990, A&A, 233, 62
- Percival et al. (2002) Percival, S. M., Salaris, M., van Wyk, F., & Kilkenny, D. 2002, ApJ, 573, 174
- Prochaska et al. (2000) Prochaska, J. X., Naumov, S. O., Carney, B. W., McWilliam, A., & Wolfe, A. M. 2000, AJ, 120, 2513
- Rich (1992) Rich, R. M. 1992, in The Stellar Populations of Galaxies, eds. B. Barbuy & R. Renzini (Reidel:Dordrecht), 29
- Rogers & Iglesias (1995) Rogers, F. J. & Iglesias, C. A. 1995, ASP Conf. Ser. 78, p. 78
- Salaris & Cassisi (1996) Salaris, M. & Cassisi, S. 1996, A&A, 305, 858
- Salaris et al. (1993) Salaris, M., Chieffi, A., & Straniero, O. 1993, ApJ, 414, 580
- Salaris & Weiss (1998) Salaris, M. & Weiss, A. 1998, A&A, 335, 943
- Salasnich et al. (2000) Salasnich, B., Girardi, L., Weiss, A., & Chiosi, C. 2000, A&A, 361, 1023
- Seaton et al. (1997) Seaton, M. J., Yan, Y., Mihalas, D. & Pradhan, A. K. 1997, VizieR On-line Data Catalog: VI/80
- Simoda & Iben (1968) Simoda, M. & Iben, I. 1968, ApJ, 152, 509
- VandenBerg et al. (2000) VandenBerg, D. A., Swenson, F. J., Rogers, F. J., Iglesias, C. A., & Alexander D. R. 2000, ApJ, 532, 430
- Vazdekis et al. (2001) Vazdekis, A., Salaris, M., Arimoto, N., & Rose, J. A., 2001, ApJ, 549, 274
- Walker (1994) Walker, A. 1994, AJ, 108, 555
- Weiss et al. (1995) Weiss, A., Peletier, R. F., & Matteucci, F. 1995, A&A, 296, 73
- Wheeler et al. (1989) Wheeler, J.C., Sneden, C. & Truran, J.W. 1989, ARA&A, 27, 279
- Winnick et al. (2002) Winnick, R., Demarque, P., Basu, S. & Guenther, D.B. 2002, ApJ, in press
- Worthey et al. (1992) Worthey, G., Faber, S.M. & Gonzales, J.J. 1992, ApJ, 398, 69
- Yi et al. (2001) Yi, S., Demarque, P., Kim, Y. -C., Lee, Y.-W., Ree, C. H., Lejeune, T., & Barnes, S. 2001, ApJS, 136, 417 (Paper 1)
- Zoccali et al. (2001) Zoccali, M., Renzini, A., Ortolani, S., Bragaglia, A., Bohlin, R., Carretta, E., Ferraro, F. R., Gilmozzi, R., Holberg, J. B., Marconi, G., Rich, R. M., & Wesemael, F. 2001, ApJ, 553, 733