The Apparent Host Galaxy of PKS 1413+135: HST, ASCA and VLBA Observations
Abstract
PKS 1413+135 () is one of very few radio-loud AGN with an apparent spiral host galaxy. Previous authors have attributed its nearly exponential infrared cutoff to heavy absorption but have been unable to place tight limits on the absorber or its location in the optical galaxy. In addition, doubts remain about the relationship of the AGN to the optical galaxy given the observed lack of re-emitted radiation. We present new HST, ASCA and VLBA observations which throw significant new light on these issues. The HST observations reveal that the active nucleus of PKS 1413+135 has an extremely red color: mag, requiring both a spectral turnover at a few microns due to synchrotron aging and a giant molecular cloud-sized absorbing region. Combining constraints from the HST and ASCA data we derive an intrinsic column and covering fraction . The spin temperature of the molecular absorption lines found by previous authors suggests that the cloud is located in the disk of the optical galaxy, making our sightline rather unlikely (). The properties of this region appear typical of large giant molecular clouds in our own galaxy. The HI absorber appears centered 25 milliarcseconds away from the nucleus, while the X-ray and nearly all of the molecular absorbers must cover the nucleus, implying a rather complicated geometry and cloud structure, in particular requiring a molecular core along our line of sight to the nucleus. Interestingly, the HST/NICMOS data require the AGN to be decentered relative to the optical galaxy by milliarcseconds. This could be interpreted as suggestive of an AGN location far in the background compared to the optical galaxy, but it can also be explained by obscuration and/or nuclear structure, which is more consistent with the observed lack of multiple images.
1 Introduction
Despite two decades of observations in the radio, infrared, optical and X-rays, the unusual flat-spectrum, radio loud AGN PKS 1413+135 remains a puzzle. The source was first classified as a “red quasar” by Rieke et al. (1979), and Bregman et al. (1981) and Beichman et al. (1981) presented the first analysis of its broadband spectrum, showing an extreme, essentially exponential cutoff just blueward of the thermal infrared. Subsequent observations have shown that its appearance changes radically as one observes in progressively blueward bands throughout the near-infrared and optical. In K band, the source is highly polarized (16 3%, Stocke et al. 1992) and shows a featureless spectrum (Perlman et al. 1996), both properties typical of BL Lacertae (BL Lac) objects, a classification which was first applied to PKS 1413+135 by Bregman et al. (1981) and Beichman et al. (1981). Similarly, ground-based imaging in the H band reveals a dominant nuclear point source surrounded by a faint nebulosity (Lamer et al. 1999). But in the optical, the spectrum of the object is red, with only stellar features and a very weak [OII] line (Stocke et al. 1992). Optical images obtained with both ground-based telescopes and HST reveal a clear spiral galaxy but show no evidence of an active nucleus (Stocke et al. 1992; McHardy et al. 1991, 1994).
A variety of evidence points to heavy absorption as the cause of this spectral cutoff. Einstein observations require an absorbing column of (Stocke et al. 1992). Radio observations reveal a strong, redshifted 21 cm HI absorption line (Carilli et al. 1992), and a rich variety of molecular species, including OH, 12CO, 13CO, HCN, HCO+, HNC, and CN (Wiklind & Combes 1995, 1997; Kanekar & Chengalur 2002). And an optical HST image reveals a prominent dust lane across the disk midplane (McHardy et al. 1994). With such a large absorbing column within a powerful AGN’s host galaxy, one might expect to see evidence for a bright, reradiated thermal continuum or near-IR emission lines (e.g., NGC 1068, Thompson, Lebofsky & Rieke 1978; Rotaciuc et al. 1991). Yet the object’s broadband spectrum shows no evidence of a thermal “hump”(Bregman et al. 1981, Beichman et al. 1981, Stocke et al. 1992), and near-infrared spectroscopy (Perlman et al. 1996) found no evidence for emission lines.
The resulting picture of PKS 1413+135 is both puzzling and incomplete. It was in the light of these mysteries that Stocke et al. (1992) proposed that the AGN might be background to the optical galaxy, and perhaps also amplified by gravitational lensing. But confirmatory evidence for this hypothesis has been difficult to come by. Ground-based images reveal that the nuclear point source appears centered within the optical galaxy to within (Lamer et al. 1999, Stocke et al. 1992). And radio VLBI imaging (Perlman et al. 1994, 1996) shows no evidence of double images, instead revealing an arcuate morphology reminiscent of wide-angle-tail radio sources, but with a total linear size of only 200 pc. However, as was pointed out by Perlman et al. (1996), these arguments are not entirely decisive, particularly given the large scale height of the optical galaxy.
Here we report new HST, ASCA and VLBA observations of PKS 1413+135, which shed considerable light on the nature of the host galaxy and absorbing medium. In Section 2, we discuss the details of the observations themselves and our data reduction procedures. In Section 3, we present the new HST/NICMOS image and analyze it along with an archival HST/WFPC observation. In Section 4, we discuss new X-ray observations of PKS 1413+135. In Section 5, we discuss new VLBA observations, in the redshifted 21 cm line as well as continuum observations at 2 cm and 0.7 cm (15 GHz and 43 GHz). Section 6 discusses the overall impact of these results, particularly as it affects both our picture of the optical galaxy and its relationship to the AGN.
Throughout this paper, we assume a redshift of for the optical galaxy associated with PKS 1413135, as derived from the redshifted HI absorption (Carilli et al. 1992). We assume and throughout, which gives a map scale of 1 arcsecond = 4.05 kiloparsecs.
2 Observations and Data Reduction
2.1 HST Observations
We observed PKS 1413+135 with HST/NICMOS on 25 August 1998, using the F160W filter (corresponding roughly to band) and the NIC1 camera. The resulting image has a scale of approximately 0.0432 arcseconds per pixel. The total integration time was 5120s. To maximize resolution and minimize the effect of known instrumental problems such as grot (Sosey & Bergeron 1999), bad columns and warm pixels, the NICMOS observations were dithered in a square, four-position pattern with offsets of between each pointing.
We obtained from the archive WF/PC 1 observations of PKS 1413+135, taken by I. McHardy and collaborators on 26 December 1992, using the Planetary Camera mode, which has a scale of 0.046 arcseconds per pixel. The observation was taken with the F555W filter, corresponding roughly to band. The total integration time was 2523 sec, split between three exposures offset from one another by . The WF/PC observations were analyzed extensively by McHardy et al. (1994), and we do not attempt to repeat their analysis, except to compare the and band images and create an optical/near-IR color image.
We reduced both HST datasets in IRAF using the best recommended flat fields, darks, biases and illumination correction images. Unequal pedestal effects in the NICMOS data were eliminated with UNPEDESTAL. The dithered NICMOS images were combined using DRIZZLE. In the process, we corrected the image for the slightly rectangular NICMOS pixels and for geometric distortion using the best available correction files. The dithered WF/PC images were first registered, then combined, using CRREJ. We then smoothed the resulting image using GAUSS, assuming a Gaussian of pixels. Flux calibrated images were obtained from the reduced image using SYNPHOT. The images were rotated so that North is along the y axis using header information + IMLINTRAN in IRAF.The NICMOS image is shown in Figure 1, with the panels showing two stretches meant to emphasize (respectively) the unresolved AGN and the galactic structure. Figure 2 shows a contour map of the nuclear regions of the NICMOS image. The WF/PC image is shown in Figure 3.
2.2 X-ray Observations
The ASCA observation of PKS 1413+135 was carried out on 24-25 July 1998. The SIS detectors were operated in a 1-CCD mode, and all data were converted to the BRIGHT mode. The GIS detectors were operated in the standard PH-nominal mode. We used standard ASCA data selection, which includes rejection of the data during SAA passages, and when the geomagnetic rigidity was lower than 6 GeV . The only exception to the standard screening criteria was that we accepted only data when the source was at least 20o from the Earth limb. This is because we expected that 1413+135 would be a faint X-ray emitter, and we wanted to minimize the effect of any potential contamination from the Earth’s atmosphere. We extracted photon data from the resulting X-ray images from a circle within 3.5′ and 3′ radii respectively for the GIS and SIS detectors, selecting the SIS data corresponding to grades 0, 2, 3, and 4. For background, we used regions away from the target, avoiding any other obvious point sources.
For all instruments, the net exposure time was about 36000 seconds after the above selection criteria were applied. The net count rates were ct s-1 for SIS0, ct s-1 for SIS1, ct s-1 for GIS2, and ct s-1 for GIS3. The count rates for SIS0, SIS1 and GIS2 match well; however, the count rate for GIS3 is somewhat higher. The most likely reason for this discrepancy is that the location of the source on GIS3 is closer to the optical axis than on GIS2, SIS1 or SIS0. As a result, the observing efficiency was higher in GIS3.
For the subsequent spectral fitting, we grouped the data to have at least 20 counts in each PH bin. As expected, the source was quite faint; the 2-10 keV flux inferred from the data using the best-fit absorbed power law model as below was erg cm-2 s-1. Needless to say, with such low count rates, there was no indication of variability during the ASCA observations. For the X-ray spectral fitting, we prepared the response matrices using the standard ASCA tools. This included the sisrmg tool for generation of the redistribution matrix for the SIS detectors, and the ASCAarf tool for preparation of the effective area files. The results we report supercede those of Sugiho et al. (1999), which included an earlier analysis of the same data.
2.3 VLBI Observations
2.3.1 Redshifted HI line Observations
VLBA observations of PKS 1413+135 in the redshifted HI line were carried out on 8 July 1998. All ten antennas of the VLBA were used, for 12 hours observing time. The observing frequency was 1.137319 GHz, corresponding to the rest frequency of the HI 21 cm line at (Carilli et al. 1992). Spectral line mode was used, with 256 channels of frequency width 15.625 kHz, corresponding to a velocity width of 4.1 km/s. The beam of the VLBA was 21.53 14.55 milliarcseconds in PA .
The data were correlated at the VLBA correlator in Socorro, NM. Fringe-fitting, calibration and mapping were done in AIPS, using a point-source model for initial fringe fitting. A priori amplitude calibration was done using the gain and system temperature curves for each station, yielding correlated flux densities. Maps were made in each channel; a channel 0 continuum map was made and then subtracted from each channel to produce the final, continuum-subtracted cube. Hybrid-mapping procedures were started using clean components from the 18 cm image of Perlman et al. (1996) as a starting point for initial phase calibration. In subsequent iterations of self-calibration, we allowed first the phase and then both amplitude and phase to vary.
The cumulative line profile from these VLBA observations was discussed in a different context by Carilli et al. (2001). We refer the reader to that paper for a discussion of the cumulative line profile. That paper did not give absorption maps, which is the subject of our discussion in §5.
2.3.2 High-frequency Continuum Observations
VLBA observations of PKS 1413+135 at 15 and 43 GHz were carried out on 16 July 1995. All ten antennas of the VLBA were used. The data were obtained in continuum mode, with 128 MHz bandwidth. Both left and right hand circularly polarized data were obtained. These observations were part of a campaign featuring twice-yearly monitoring, designed to measure proper motions and high-frequency spectral structure in PKS 1413+135; this time block also included 8 and 22 GHz observations which will be discussed, along with a detailed discussion of the source structure, spectral morphology and proper motions in Langston et al. (2002). The beam of the VLBA at 15 GHz was 0.96 0.49 milliarcsec in PA , while at 43 GHz it was 0.34 0.19 milliarcsec in PA .
The data were correlated at the VLBA correlator in Socorro, NM. Fringe-fitting, calibration and mapping were done in AIPS, using a point-source model for initial fringe fitting. A priori amplitude calibration was done using the gain and system temperature curves for each station, yielding correlated flux densities. Hybrid-mapping procedures were started using a point source model for initial phase calibration. In subsequent iterations of self-calibration, we allowed first the phase and then both amplitude and phase to vary. Uniform weighting (Robust = -1 in IMAGR) was used to make the final images.
3 Results from the HST Observations
As can be seen from Figures 1 and 2, the dominant feature in the NICMOS image is the AGN point source, which is so bright that its first Airy ring is roughly twice as bright as the galaxy at the same radius. This is quite different from the situation for the WF/PC image (Figure 3, McHardy et al. 1994), where no evidence of an unresolved source is seen. Also marked on Figure 1 is a faint companion galaxy about away, which was noted by Lamer et al. (1999).
3.1 Isophotal Analysis of the NICMOS Image
We extracted isophotes for the host galaxy of PKS 1413+135 using the IRAF tasks ELLIPSE, BMODEL and IMCALC. This extraction and analysis was done on the unrotated image, in order to minimize any effects from rotating the image to the North-up configuration. The results of this procedure are shown in Figure 4a-e. We exclude from our analysis isophotes with semi-major axis because of the extreme brightness of the unresolved AGN source (Figure 1, left panel). Indeed, the innermost of the isophotes beyond still shows some significant effect from the first Airy ring, and there is also evidence for a second, and even third Airy ring in the isophotes within .
Figure 4a shows the isophotal profile of the optical galaxy. We fit this profile to an exponential model of the form , with best fit values for the parameters and . As can be seen, the fit to this model is quite good at . At smaller radii, the galaxy’s profile visibly flattens, such that the model overshoots. This is a typical characteristic of spiral galaxies with a significant bulge; the presence of a significant bulge at (i.e., 3 kpc) was in fact noted by McHardy et al. (1994) in their analysis of the WF/PC 1 data. We have shown the division between the bulge and disk at in Figure 4a by a dashed vertical line. The large size of the bulge suggests that the optical galaxy is a fairly early spiral, perhaps an Sa, as suggested by McHardy et al. (1994). The disk itself is rather extensive, as at (8 kpc), the galaxy’s profile flattens yet further, such that the model overshoots. This might be a remnant of past interactions with companions such as the one seen on Figure 1. The bulge can also be seen in Figure 4b, where we plot isophote ellipticity. As can be seen, varies from near zero at to at , increasing nearly monotonically with . As Figure 4c shows, the dependence of isophotal PA with semi-major axis appears weak. This is not at all atypical of bright spiral galaxies seen at large inclination angle (Courteau 1996).
Figures 4d and 4e plot the location of the centroid of each isophote. In those plots, the location of the unresolved point source is denoted by a dashed line. It is particularly interesting to examine the points within the inner , i.e., the bulge. One would expect that the location of the point source should coincide with the centroid of the bulge isophotes (the disk isophotes might be affected by patchiness in the disk and/or dust obscuration). However, as can be seen, there appears to be a significant offset. We take the most conservative estimate of this offset, generated by the isophotes at , which yields a decentering of or pc at , relative to the isphote centroids (as can be seen in Figure 4e we find even larger decentering at larger values of ). The X isophotal centers show much less significant (if any) evidence of an offset. The offset can just be seen in Figure 2, which shows that the nucleus appears just northeast of the center of the galaxy isophotes (marked by a cross). This is quite surprising, as all previous images of this object have shown that the AGN appears to be well centered within the optical galaxy (see Stocke et al. 1992, Lamer et al. 1999). Those images were, however, ground-based and could not detect a decentering of . We tried several different permutations of initial parameters for ISOPHOTE but this effect remains present. An off-center AGN could indicate either that the AGN is background to the optical galaxy, or alternately if the AGN is hosted by the optical galaxy, that there is significant nuclear structure aligned with the AGN or radio lobes, perhaps augmented by any effects due to dust, which is not completely absent at band ( for , Mathis 1991). We discuss both possibilities in §6.
3.2 WF/PC Image and Optical/Near-IR Colors
As shown by Figure 3, a rather different picture of this system is seen in the optical than in the infrared. The archival WF/PC image shows no evidence for a central point; instead, the most prominent feature on the image is a dust lane more than 4 arcseconds long, extending roughly along the disk plane of the galaxy, and traversing the nuclear region. The dust lane appears to be clearly resolved with a width (1 kpc). The nuclear regions appear distinctly peanut-shaped, with a central bar extending for over perpendicular to the dust lane. Interestingly, the orientation of the nuclear bar corresponds fairly closely to that of the milliarcsecond radio structure (Perlman et al. 1996).
By combining the WF/PC and NICMOS images, we constructed a color image. To do this, we resampled the NICMOS image to /pix, and registered the two images by assuming that the unresolved point source seen in the NICMOS image corresponds to the center of the nuclear bar seen on the WF/PC image (which also corresponds to the middle of the dust lane). Even though this assumption is not supported by an image in an intermediate band, it is consistent with the large absorbing column required by the Einstein data (Stocke et al. 1992) as well as the HI and other radio absorption line observations (Carilli et al. 1992, Wiklind & Combes 1997, see also §5).
The resulting image is shown in Figure 5. This image has two dominant features. First, the disk midplane is considerably redder than other regions of the galaxy, with typical values of compared to . This is consistent with the presence of dust, as noted above, and as in McHardy et al. (1994). Interestingly, the dust disk does not appear in the image as a sharp feature, instead appearing more gradual, perhaps indicating a patchy distribution of dust in the optical galaxy’s disk. There is also significant variation in color along the disk midplane, with generally redder values closer to the nucleus. This is a property that shared with the small companion galaxy away, which also appears to have a ’disky’ morphology and somewhat redder colors in its midplane and nucleus ( compared to .)
Second, the nucleus is extremely red ( = 6.9), four magnitudes redder than any other feature in the map. Given the lack of a nuclear point source in the optical, it is useful to note that since the central ’bar’ is the brightest feature in the WF/PC image any alternate choice for registering the nucleus would yield an even more extreme color for the AGN.
This speaks to either extreme absorption, an infrared spectral cutoff, or both. In fact, the spectral cutoff implied by the color is so extreme ( for ) that no synchrotron aging mechanism can account for the observed spectral cutoff by itself, without resorting to an unphysical exponential cutoff in the particle distribution. Thus we are forced to conclude that a significant and probably dominant factor in the shape of the infrared spectrum of PKS 1413+135 is extinction. This conclusion is supported by the large column implied by the X-ray spectrum (Stocke et al. 1992, §4). However, it is also difficult to account for the observed nuclear spectrum by reddening alone, given a normal extinction law. This difficulty was first pointed out by Beichman et al. (1981) without the X-ray data or a high-resolution near-IR image; given the extreme color we find for the nucleus it is even more acute now. The most consistent explanation is a combination of a rollover due to synchrotron aging combined with extinction, as first advocated by Stocke et al. (1992). If, for example, the intrinsic nuclear spectral index were to steepen by in the neighborhood of 3-5 microns ( is predicted for synchrotron aging with continuous reinjection of electrons, Meisenheimer & Heavens 1989), then our data require an excess 3 mag of extinction at the position of the nucleus. If one then assumes a normal extinction law (Mathis 1991) and , the required column is , assuming a covering factor . A more likely value for the covering factor. however, is , given the value of we derive in §4 for the X-ray absorption (see also Stocke et al. 1992). This implies 10-30 mag of extinction along our sightline to the AGN. These conclusions would be helped significantly by an HST image in an intermediate band to confirm the spectral slope and compare in detail to extinction laws.
4 ASCA Observations
PKS 1413+135 has been the target of several X-ray observations. The source was quite faint for both Einstein (Stocke et al. 1992) and ROSAT (McHardy et al. 1994), where only photons at energies keV were observed (only about 15 above background in each case). However, neither Einstein nor ROSAT had significant sensitivity above keV, where most of the observable X-ray emissions for such a heavily absorbed source would be. It was for this reason that we observed PKS 1413+135 with ASCA.
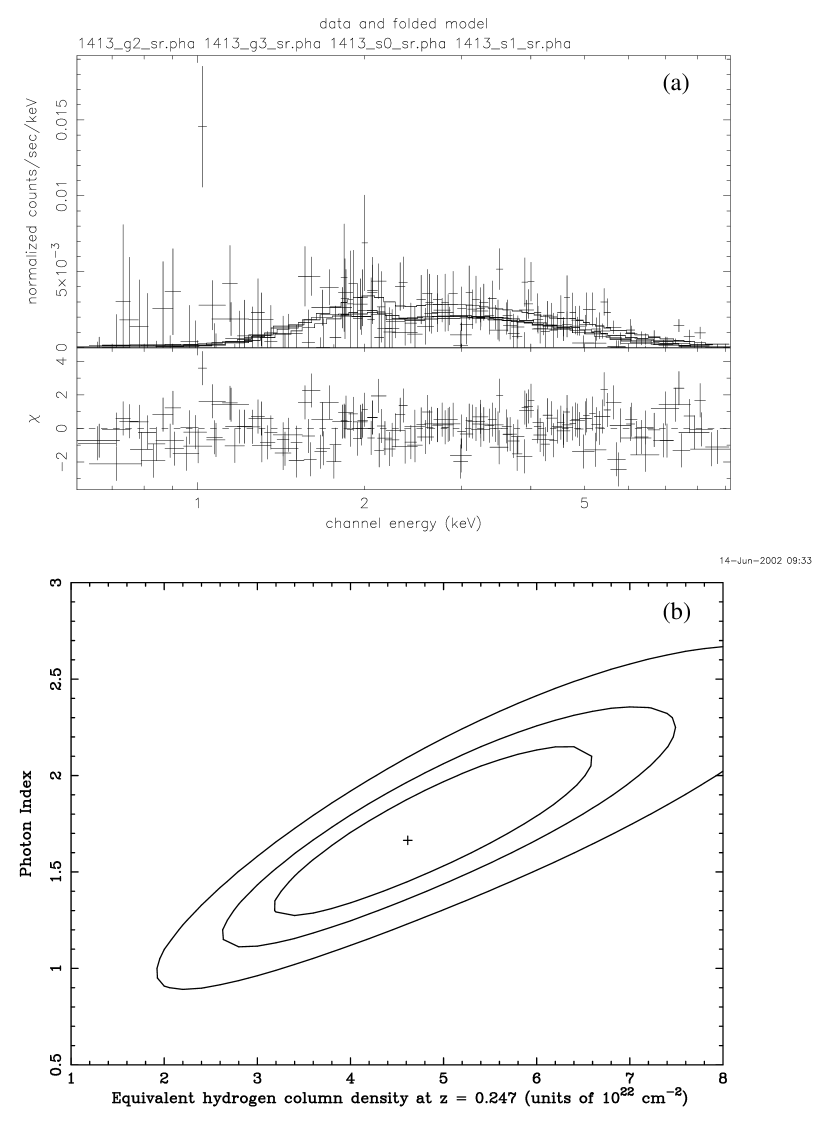
For the purposes of this paper, ASCA is essentially a spectrometer only, as its angular resolution is arcminute. We show in Figure 6a the X-ray spectrum of PKS 1413+135 extracted from both the SIS and GIS data. In Figure 6b we show contour ellipses in the plane at 68 %, 95% and 99% confidence. The model fitted in Figure 6 is a power law with two components of Morrison & McCammon (1992) absorption. We fix the Galactic absorption at the value indicated by the survey data of Stark et al. (1992), (Galactic) , and assume that the dominant absorption comes from the optical galaxy at The best fit parameters for this model are and intrinsic , and the goodness of fit is (errors are quoted at 90% confidence). These parameters agree well with the parameters fitted to the Einstein data by Stocke et al. (1992) as well as those quoted by Sugiho et al. (1999) for an earlier fit to these data. The X-ray spectral index is typical of those seen in both OVV quasars and low-frequency peaked BL Lacs (Urry et al. 1996, Sambruna et al. 1999).
The X-ray flux was F (2–10 keV) = , and the derived luminosity was . Thus in this observation PKS 1413+135 was fainter by a factor than seen in previous X-ray observations. It is worth noting that any 2–10 keV flux figure obtained from the ROSAT and Einstein observations is based almost completely on extrapolations, so the actual variability could be somewhat different in magnitude. However, as was noted by Stocke et al. (1992), Stevens et al. (1994), Perlman et al. (1996) and Lamer et al. (1999), this source is highly variable in both the radio and optical, so variations of a factor 5 in the hard X-rays should not be seen as surprising.
The large column required by all the X-ray observations of PKS 1413+135 is quite consistent with the observed optical absorbing column (§3.2) if the absorbing material is patchy, with covering fraction (the errors are at 90% confidence and are dominated by the error in the column fit to the ASCA data). This suggests that the absorbing material covers only of a WF/PC pixel, i.e., parsecs at . Such a size, patchiness and absorbing column would not be atypical of giant molecular cloud complexes in our own galaxy (e.g., Orion; Green & Padman 1993). Given that the observed CO excitation temperature ( K; Wiklind & Combes 1995, 1997) is more typical of outer-galaxy GMC complexes than a nuclear cloud (Maloney 1990), it is then useful to point out that our sight-line to PKS 1413+135 remains highly unusual. Indeed, if one assumes projected dimensions of kpc for the dust lane, the probability of observing the AGN projected behind a pc GMC complex is . Since PKS 1413+135 has unique properties for a Parkes radio source, this low inferred probability is consistent with the very small percentage of similar sources found in bright radio surveys.
If indeed a large amount of absorbing material were present in the nuclear regions, we would expect to see a bright, but narrow, Fe K line. As can be seen (Figure 6a) no line is observed, although due to the low signal to noise our upper limit on equivalent width is quite modest: 500 eV. Our nondetection of this line is consistent with the absorbing material being either well out in the disk of the optical galaxy, or far in the foreground compared to the AGN (the so called background AGN hypothesis, cf. §6).
5 VLBA Observations
5.1 HI Absorption Observations
The existence of a redshifted 21 cm HI line in the spectrum of PKS 1413+135, discovered by Carilli et al. (1992) was a second important link implicating significant absorption as the cause of the IR rollover. In the light of evidence indicating a patchy absorbing column and a significantly resolved radio source with a size corresponding to milliarcsec, i.e., WF/PC pixels, it is quite useful to look at any spatial structure in the radio HI absorber.
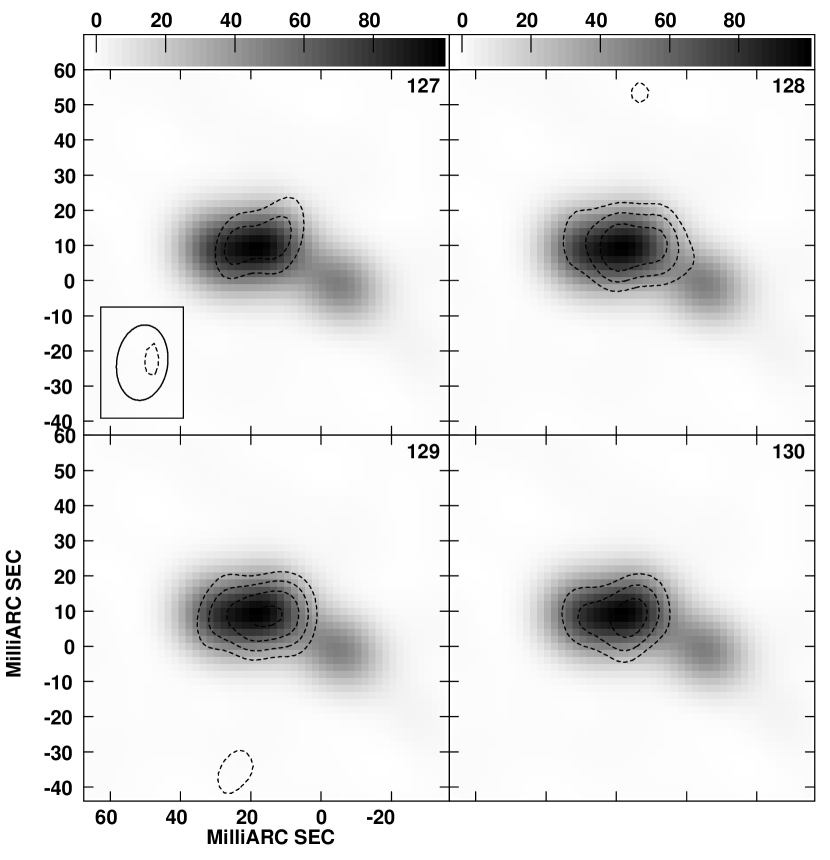
In Figure 7, we show contour maps of the absorbing material in four of the 256 channels in our VLBA observations, corresponding to a range of 16 km/s centered around the frequency of the HI line at (Carilli et al. 1992). All panels of Figure 7 have the channel 0 image shown in greyscale. The nucleus is shown at (0,0) in all four panels. No other significant features were found in the image for these or any other channels, although noise is a significant issue. For comparison, the single-dish observation of Carilli et al. (1992) found a FWHM of 18 km s-1, consistent with the four channels found in these observations, but suggesting that some less-obscured regions may exist in outlying channels, below the noise level.
Because of the relatively low signal to noise of the absorption maps, we do not show optical depth maps; however, an examination of those maps indicates that the optical depth within the absorber is typically , i.e., optical depth . By comparison, Carilli et al. (1992) found a peak line depth of . However, those single-dish measurements did not resolve the source. If, as indicated by Figure 7, a significant amount of the source flux is not obscured by the HI absorbing screen, multiplying the observed optical depth by the fraction of flux that is behind the screen, yields good agreement with the value quoted by Carilli et al. (1992).
As can be seen, the radio HI screen obscures primarily the mini-lobe 15-40 milliarcsec northeast of the nucleus. There is a possible, slight extension of the absorber to the southwest (towards the nucleus). There is also some marginal velocity structure, with the easternmost part of the screen having a velocity width somewhat narrower than the region near the mini-lobe’s flux maximum. We do not observe significant absorption at the nucleus position, to a optical depth limit of ; however as this is not much lower than the optical depth figures we observe to the eastern mini-lobe this is only a weak limit. We cannot use the total HI optical depth to improve significantly on this because of the relative faintness of the nucleus at this frequency. Interestingly, the HI absorber covers the regions with the steepest radio spectral index ( ranging from 1.3-2.5) regions in the maps of Perlman et al. (1996).
5.2 High-frequency Observations
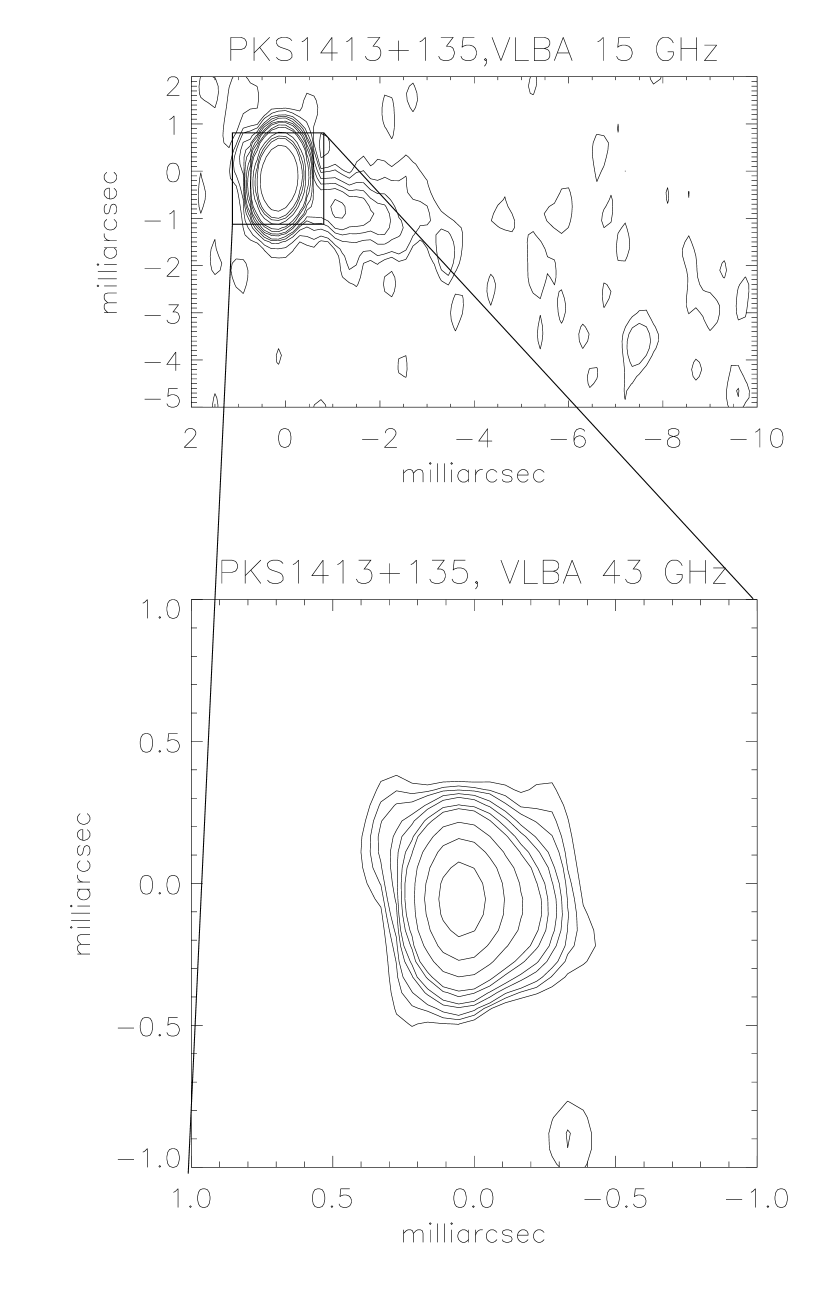
The 15 and 43 GHz VLBA images of PKS 1413+135 are shown in Figure 8. As in Figure 7, the nucleus is shown at (0,0). As can be seen, by far the brightest feature in these images is the nucleus, a stark contrast from the structure seen in Figure 7 (redshifted 21 cm), where the lobe is a factor 5-6 brighter than the nucleus. This is not terribly surprising given the spectral index maps published by Perlman et al. (1996) which show a highly inverted spectrum () for the core but very steep spectra for all the extended structure (ranging from to ).
The 15 GHz image shows a jet extending west for about 3 milliarcsec, before taking a bend. There is flux at greater distances which is just barely visible in the contours but is significant on smoothed image; the position angle of the jet in this image matches that of the jet at 5 GHz and 8.4 GHz (Perlman et al. 1996). The western jet appears to emerge south of the nucleus’s centroid, indicating a likely second bend closer in to the nucleus which we cannot resolve. Also visible on the 15 GHz image is a possible counterjet, at a PA similar to that of the eastern mini-lobe, and about 180∘ from the location where the western jet emerges. At 43 GHz, all that is seen is the nucleus and a slight extension to the west (supporting the indications of a bend at submilliarcsecond scales, seen in the 15 GHz map), which unfortunately becomes too faint to see about 0.3 milliarcsec from the nucleus. We see no evidence of structure outside this fairly simple configuration, and in particular there is no evidence of a double image of the nucleus down to resolutions of about 0.2 arcseconds (see §6.2). Note that the high frequency radio emission from PKS 1413+135 is synchrotron in nature and thus physically unrelated to the high-frequency absorption features superposed along our line of sight.
6 Discussion
The data shown in §§3-5 allow us to place significant constraints on several of the outstanding mysteries (mentioned in §1) regarding the absorbing material in PKS 1413+135 and its relationship to the AGN. Based on the NICMOS image, we confirm that the optical galaxy is indeed a spiral, as found by previous workers. The spiral has a fairly large nuclear bulge, about 3 kpc in size, with a significantly flatter surface brightness profile than the outer regions of the galaxy. McHardy et al. (1994) found that the scale height of the bulge of the optical galaxy was 6.9 kpc, a figure which our data support.
Two issues addressed in the foregoing section particularly bear further elucidation.
6.1 Location and Properties of the Absorbing Material
Our data provide strong evidence that the AGN of PKS 1413+135 is heavily reddened by absorbing dust and gas along our line of sight. The optical galaxy itself has a prominent dust lane along the disk midplane which measures 15 kpc 1 kpc, where the color is about 1 mag redder then elsewhere in the galaxy. Such features are common among edge-on spirals. However, the AGN has a far more extreme color than anything else in the image () , implying a spectral cutoff so steep that it requires both an intrinsic break at a few microns plus 3-4 mag of extinction. The implied absorbing column is consistent with the VLBA HI and ASCA observations if the covering factor and the HI spin temperature is a few hundred degrees. Combining this with a molecular line spin temperature of K (Wiklind & Combes 1995, 1997) we can state that it is most likely that the absorber is a giant molecular cloud (GMC) complex in the outer reaches of the optical galaxy’s spiral disk (a location in the galaxy’s nucleus would predict a somewhat higher spin temperature and a strong Fe K line, which is not observed). The superposition of an outer-galaxy GMC right along the line of sight is rather unlikely (, as discussed in §4), but it does appear to be the most consistent hypothesis.
As discussed in §5.1, the radio HI absorber appears to be centered about 20-25 milliarcseconds east of the nucleus, along our line of sight to the eastern mini-lobe. This mini-lobe dominates the radio flux below about 2 GHz (Perlman et al. 1996), with a surface brightness some 5-6 times that of the core at 1139 MHz. This offset of the HI absorber with respect to the nucleus (which must be covered by the X-ray absorber) is very interesting. It therefore behooves us to inquire as to the relationship of the various absorption components to one another. It would not at all be surprising, for example, to have a GMC complex or star formation region with both warm and cold components, with the warm component responsible for the X-ray absorption and the colder, dusty component responsible for the optical and radio absorption.
Absorption lines from a wide variety of molecular species have been observed in the radio spectrum of PKS 1413+135. Only one of these lines is at low frequencies - the recently-discovered OH line found in GMRT observations (Kanekar & Chengalur 2002). The remainder of the lines, discovered by Wiklind & Combes (1995, 1997), were all at much higher frequencies (ranging from about 70-200 GHz in the observed frame; see Table 1 of Wiklind & Combes 1997). All the molecular lines are narrow, with the OH absorption width being 14 km while the other lines are , and only very slightly offset from the HI line center ( compared to an HI line width of 18 km s-1).
As its radio structure spans only 100 millarcseconds (Perlman et al. 1996), PKS 1413+135 was unresolved for all the molecular line observations. However, given the information presented here and in Perlman et al. (1996) we have adequate information to resolve the likely location of the molecular absorbing material. At low frequencies, the eastern mini-lobe dominates the radio flux (Figure 7, §5.1). Therefore, we believe it is more likely that the material which produces the OH line covers the eastern mini-lobe, although it may also partially cover the core, a conclusion somewhat at variance with that of Kanekar & Chengalur (2002). The situation is different, however, for the higher-frequency lines. Above 20 GHz, the core accounts for nearly all the emission from PKS 1413+135 (Figure 8). Thus the molecular material accounting for the high-frequency lines observed by Wiklind & Combes must be projected within a small distance of the core ( milliarcsec given the compactness of the 43 GHz structure, Figure 8).
To sum up, then, the center of the observed HI absorber appears to be along the line of sight to the eastern mini-lobe, 20-25 milliarcseconds from the nucleus. However, the X-ray absorbing material and most of the molecular absorbing material must cover the core, where our data gives a weak upper limit of , only less than that observed against the lobe. Thus the radio molecular and HI absorbers are not necessarily all physically co-located. Looking at the small velocity difference between the HI and molecular features, however, it is still most likely that all the absorbing material is part of the same GMC complex, as much larger velocity differences would be expected if the HI and molecular clouds were at different locations within the galaxy’s spiral disk. The projected location of most of the molecular absorbing material (i.e., covering the VLBI core) is logical, given the observed optical/near-IR reddening.
With a linear size of at least 40 milliarcseconds (160 100 pc) and an HI velocity width of , this GMC complex must be somewhat more massive than, for example, the Orion region in our own galaxy (which spans pc region and has an HI velocity width of a few km s-1), and it likely has a rather patchy and/or filamentary structure, similar to GMC complexes in our own galaxy. A patchy structure would make it rather difficult to estimate a mass or other physical parameters for the absorber. For the sake of illustration only we assume a cylindrical GMC region measuring milliarcsec ( parsecs), with the long dimension superposed near the direction of the eastern lobe but overlapping the position of the nucleus, and with one of the molecular cores located virtually along our line of sight to the nucleus (within 0.2 milliarcsecond or 0.8 parsecs impact parameter - see §6.2). Such a configuration is consistent with the covering fraction constraints from combining the optical and ASCA data. To conform with both the HI and molecular line data it would have to be centered somewhere along the line between the lobe and nucleus, at perhaps 15 milliarcsec projected distance from the nucleus. This works out to a volume of just under cubic parsecs, or . For a path length of 100 parsecs ( cm) and the mean density would be , thus yielding a mass of . While this estimate is of course geometry dependent, it is roughly comparable to the largest GMC complexes in our own galaxy. Deeper observations are required to further constrain the configuration of the radio absorbing material.
6.2 Relationship of the AGN to the Optical Galaxy and Absorber
Perhaps the most surprising result of our isophotal analysis is that the HST data seem most consistent with an AGN position very slightly offset (, just at the edge of HST’s astrometrical capabilties in the near-IR) from the center of the galaxy’s isophotes. This could be interpreted as the first evidence in favor of the background source hypothesis. If indeed the source were decentered, then given the very large scale length of this galaxy (6.9 kpc) and a smoothly varying projected mass distribution, we might not expect to see either double images or an arc (see Narayan & Schneider 1990 although n.b., this source has a decentering two orders of magnitude smaller than that seen for AO0235+164 and 0537441, the sources modelled in that paper).
In light of the evidence presented here, however, we cannot assume that the projected mass distribution of the optical galaxy is smooth. To the contrary, a patchy, likely filamentary GMC complex with mass and size pc must lie along our line of sight to the AGN. This geometry is considerably more interesting with respect to the issue of possible microlensing of a background source and the AGN/absorber relationship. The Einstein radius for a GMC is about 5.7 milliarcsec (for an AGN at ), compared to a likely projected location of the cloud center milliarcsec from AGN position on the sky. Thus the most naive examination of the geometry would conclude that milli-lensing by the GMC complex is quite unlikely. However, the molecular line and X-ray absorption data lead us to conclude that there is a molecular core within 0.2 milliarcsecond of the line of sight to the nucleus. If the molecular cloud core is responsible for all the X-ray absorption, and if we assume a density in this region typical of molecular cores, , the path through the absorber must be pc long. Assuming this molecular core to be spherical, then, we derive a mass of 32000 which must be located within at most 0.2 milliarcsec of our line of sight – well within its Einstein radius of 0.37 milliarcsec. One would expect such a lens to produce multiple images with separation milliarcsec, which is not seen in Figure 8. Given the available data, the only way for a background AGN to not produce prominent evidence of microlensing would be to have the AGN at . At such a redshift (only slightly greater than that of the optical galaxy) the host galaxy of the AGN would easily be visible on the near-IR image - yet as can be seen from Figure 1 we see no evidence of it. Thus the available data now make the background AGN hypothesis even more unlikely.
There are other, less exotic explanations for such a small decentering. If indeed the absorption is patchy and as suggested by our data, some regions of the nucleus might well be absorbed, even in H band. This could significantly bias the isophote centroids, since for a standard extinction law one would still expect 2-5 mag of extinction at band for 10-30 mag of extinction at V band. Furthermore, if the nuclear “bar” is the result of structure aligned and perhaps associated with the radio source’s “lobes” (i.e., a miniature alignment effect, as seen in, for example, 4C31.04, Perlman et al. 2001), such aligned emission would not be expected to be symmetrical and in fact would be expected to bias the measurement of isophote centroids. Either (or both) of these constitute a much more plausible explanation for the observed decentering given the available data.
As was previously suggested by Perlman et al. (1996), one can reconcile an absorber within the optical galaxy with the observed lack of re-emitted AGN continuum by locating the absorber in the outer disk, as our data seem to suggest. One would also have to assume some beaming of the continuum (as in the models of Snellen et al. 1998) to explain the observed lack of IR emission lines; however that does not appear to be inconsistent with the known properties of PKS 1413+135 including high and variable polarization, extreme variability and extremely core-dominated high-frequency VLBI structure, although it would require some superluminal motion, which was not seen by Perlman et al. (1996) based on two-epoch data which, however, did not adequately resolve the jet’s inner regions. We will return to this latter issue in Langston et al. (2002, in preparation). The same model would, however, require a somewhat underluminous broad line region compared to most Seyfert galaxies, as observed in other compact symmetric object radio sources (Perlman et al. 1996 first drew the link between PKS 1413+135 and compact symmetric objects). Indeed, the reasonability of this hypothesis is underscored by the fact that IRAS data in NED (which was not included in Perlman et al. 1996) show fluxes at 60 m and m of 220-290 mJy (two observations with some possible variability between them) and a roughly flat spectrum between 60-100 m. This is within 50 % of the prediction one would make by simply scaling up by a factor of 10 (appropriate to the observed ) the correlation of Knapp (1990) between galaxy magnitude and 60 m flux.
6.3 Conclusions
The most consistent explanation to the properties we observe in PKS 1413+135 appears to be that the absorbing screen consists of a GMC complex within the outer disk of the optical galaxy. This geometry is fully consistent with our new HST, ASCA and VLBA observations and is also fully consistent with previous observations in other wavebands. The optical galaxy is most likely the true host of the AGN and radio source given the properties we observe. While it is still not possible to fully rule out the background AGN hypothesis, it now becomes significantly less likely given that the absorption data require a molecular core within 0.2 milliarcsec of our line of sight.
References
- (1) Beichman, C. A., Neugebauer, G., Soifer, B. T., Wootten, H. A., Roellig, T., & Harvey, P. M., 1981, Nature, 293, 711
- (2) Bregman, J. N., et al., 1981, Nature, 293, 714
- (3) Carilli, C. L., Perlman, E. S., & Stocke, J. T., 1992, ApJ, 400, L13
- (4) Carilli, C. L., et al. 2001, Phys. Rev. Lett, 85, 5511
- (5) Courteau, S., 1996, ApJS, 103, 263
- (6) Green, D. A., & Padman, R., 1993, MNRAS, 263, 535
- (7) Heavens, A. F., & Meisenheimer, K., 1987, MNRAS, 225, 335
- (8) Kanekar, N., & Chengalur, J. N., 2002, A & A 381, L76
- (9) Knapp, P. R., 1990, in The Interstellar Medium in Galaxies, ed. H. Thronson & J. M. Shull (Dordrecht: Kluwer), p. 3
- (10) Lamer, G., Newsam, A. M., & McHardy, I. M., 1999, MNRAS, 309, 1085
- (11) Langston, G., Minter, T., Ghigo, F., Perlman, E., 2002, in preparation
- (12) Maloney, P. R., 1990, in The Interstellar Medium in Galaxies, ed. H. Thronson & J. M. Shull (Dordrecht: Kluwer), p. 493
- (13) McHardy, I. M., Abraham, R. G., Crawford, C. S., Ulrich, M. H., Mock, P. C., & Vanderspeck, R., 1991, MNRAS, 249, 742
- (14) McHardy, I. M., Merrifield, M. R., Abraham, R. G., & Crawford, C. S., 1994, MNRAS, 268, 681
- (15) Meisenheimer, K., Röser, H. J., Hiltner, P., Yates, M. G., Longair, M. D., Chini, R., & Perley, R. A., 1989, A & A, 219, 63
- (16) Morrison, R., & McCammon, D., 1983, ApJ, 270, 119
- (17) Narayan, R., & Schneider, P., 1990, MNRAS, 243, 192
- (18) Perlman, E. S., Stocke, J. T., Shaffer, D. B., Carilli, C. L., & Ma, C., 1994, ApJL, 424, L69
- (19) Perlman, E. S., Carilli, C. L., Stocke, J. T., Conway, J., 1996, AJ, 111, 1839
- (20) Perlman, E. S., Stocke, J. T., Conway, J., Reynolds, C. S., 2001, AJ, 122, 536
- (21) Rieke, G. H., Lebofsky, M. J., & Kinman, T. D., 1979, ApJL, 232, L151
- (22) Rotaciuc, C., Krabbe, A., Cameron, M., Drapatz, S., Genzel, A., Sternberg, A., & Storey, J. W. V., 1991, ApJ, 370, L23
- (23) Sambruna, R. M., 1997, ApJ, 467, 536
- (24) Snellen, I. A. G., Schilizzi, R. T., DeBruyn, A. G., & Miley, G. K., 1998, A & A, 333, 70
- (25) Sosey, M., & Bergeron, E., 1999, GROT in NICMOS Cameras (Tech. Rep. NICMOS ISR 99-008)
- (26) Stevens, J. A., et al., 1994, ApJ, 437, 91
- (27) Stocke, J. T., Wurtz, R., Wang, Q., Elston, R., & Jannuzi, B., 1992, ApJ, 400, L17
- (28) Sugiho, M., Tashiro, M., Perlman, E. S., Wang, Q. D., Stocke, J. T., Madejski, G. M., 1999, Astronomische Nachritien, 320, 316
- (29) Urry, C. M., Sambruna, R. M., Worrall, D. M., Kollgaard, R. I., Feigelson, E. D., Perlman, E. S., & Stocke, J. T., 1996, ApJ, 463, 424
- (30) Wiklind, T., & Combes, F., 1994, A & A, 286, L9
- (31) Wiklind, T., & Combes, F., 1997, A & A, 328, 48
- (32)