The 3D Structure of the Virgo Cluster Region from Tully-Fisher and H I Data
Abstract
The distances and H I contents of 161 spiral galaxies in the region of Virgo cluster are used to gain insight into the complicated structure of this galaxy system. Special attention has been paid to the investigation of the suggestion presented in an earlier work that some peripheral Virgo groups may contain strongly gas-deficient spirals.
The three-dimensional galaxy distribution has been inferred from quality distance estimates obtained by averaging distance moduli based upon the Tully-Fisher relationship taken from eight published datasets previously homogenized, resulting in a relation with a dispersion of 0.41 mag. Previous findings that the spiral distribution is substantially more elongated along the line-of-sight than in the plane of the sky are confirmed by the current data. In addition, an important east-west disparity in this effect has been detected. The overall width-to-depth ratio of the Virgo cluster region is about 1 : 4, with the most distant objects concentrated in the western half. The filamentary structure of the spiral population and its orientation are also reflected by the H I-deficient objects alone. The H I deficiency pattern shows a central enhancement extending from 16 to 22 Mpc in line-of-sight distance; most of this enhancement arises from galaxies that belong to the Virgo cluster proper. However, significant gas deficiencies are also detected outside the main body of the cluster in a probable group of galaxies at line-of-sight distances 25–30 Mpc, lying in the region dominated by the southern edge of the M49 subcluster and clouds W′ and W, as well as in various foreground galaxies. In the Virgo region, the H I content of the galaxies then is not a straightforward indicator of cluster membership.
1 Introduction
This article is the continuation of a series of papers on the H I content of spirals from the 21 cm line of neutral hydrogen data devoted to examine the extent to which the cluster environment influences the evolution of the galaxies.
The starting point, developed in Solanes, Giovanelli, & Haynes (1996, hereafter Paper I), was the establishment of reliable standards of H I mass for the various morphological subgroups of luminous spirals from a complete H I-flux-limited sample of these galaxy types in low density environments. That work was followed by a second paper examining the possible connections between gas deficiency and the properties of both the underlying galaxies and their environment in the fields of eighteen nearby clusters by Solanes et al. (2001, hereafter Paper II). The main motivation was to gain insight into the mechanisms responsible for the atomic gas depletion. While no clearly discriminating circumstances were found among those clusters which show significant H I deficiency and those which do not, this work definitely confirmed previous findings (e.g., Giovanelli & Haynes, 1985; Haynes & Giovanelli, 1986; Magri et al., 1988) that in H I-deficient clusters the proportion of gas-poor spirals increases monotonically towards the center. Moreover, Paper II clearly demonstrated, as first suggested by Dressler (1986), that H I-deficient objects move on orbits more radial than those of their gas-rich counterparts. This result made a strong case for the ram-pressure stripping of the spirals by the hot X-ray emitting intracluster medium (ICM) as the most likely process responsible for the gas deficiencies observed in rich cluster environments.
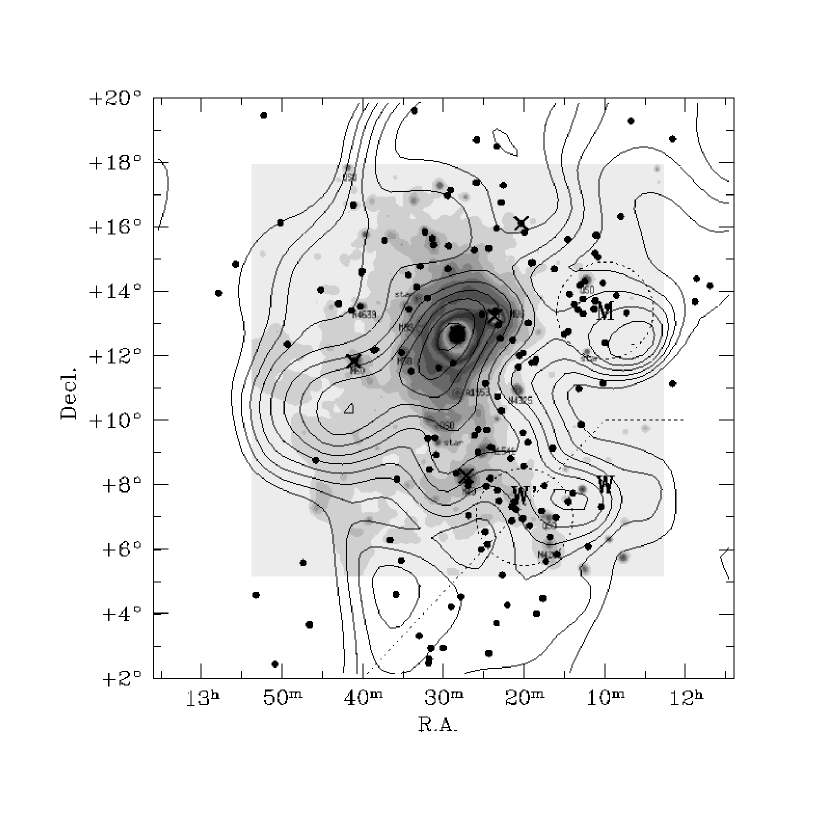
The wealth of 21-cm data gathered for the Virgo region in Paper II also made it possible to examine the distribution in two-dimensional space of the neutral gas deficiency in the Virgo central area. The sky distribution of H I deficiency was found to be in overall agreement with the radial pattern characteristic of rich clusters, showing that the maximum depletion occurred at the cluster center. But quite unexpectedly, the same map of the HI deficiency pattern, a variation of which is produced here as Fig. 1, also revealed peripheral groups of galaxies with a dearth of atomic hydrogen but found in areas where the density of X-ray luminous gas is very low, raising into question the feasibility that the ram-pressure of the ICM was responsible for the observed H I deficiency.
In the current paper, we conduct a further investigation into the nature of and conditions within the three-dimensional structure of the Virgo region, by incorporating into the analysis the H I content of its spiral population. The proximity of the region under study facilitates the gathering of a large number of 21-cm single-dish observations, which we complement with a large number of Tully-Fisher 1977, hereafter TF distance estimates also reported in the literature. Section 2 presents a catalog of 161 galaxies with good H I and TF distance measurements. After reviewing in Section 3 the manner in which the H I deficiency is calculated, our galaxy sample is used in the following two sections to discuss, first the radial pattern of H I deficiency, and then its spatial distribution in the Virgo region. We conclude with a summary and some remarks in Section 7.
2 Observational Data
2.1 Galaxy Selection
The backbone of the present study is the complete spiral sample taken from the Virgo Cluster Catalog (Binggeli, Sandage, & Tammann, 1985, hereafter VCC) by Yasuda, Fukugita, & Okamura (1997, YFO97) to study the Virgo cluster using the -band TF relation. The YFO97 sample has been supplemented by data from seven other studies of the Virgo cluster, likewise presenting TF distance estimates at various wavelengths. Table 1 lists the different sources of TF distances for Virgo objects included in the present work, along with the number of galaxies included in our catalog. These datasets include virtually all spiral galaxies used to date in the application of the TF relation to study the Virgo region.
For the current purpose, we have selected from the original catalogs listed in Table 1 only galaxies with heliocentric radial velocities below the well-defined gap near 3000 km s-1 that neatly isolates the Virgo region in redshift space (Binggeli, Popescu, & Tammann, 1993). In addition, we have focused on galaxies located in the region bounded by and (throughout the paper equatorial coordinates are referred to the B1950.0 equinox), which encompasses the VCC survey boundary and is centered on the classical Virgo I cluster (de Vaucouleurs, 1961). Thus, wherever we use the terminology “Virgo cluster region”, it should be kept in mind that objects located in the “Virgo Southern Extension” (Tully, 1982) or Virgo II cluster, i.e., with , are indeed largely excluded. Note that our selection procedure also implies that all the galaxies included in our sample (even those classified as background objects in VCC) are expected to have peculiar motions influenced by the central mass concentration of the cluster.
Our initial selection of Virgo galaxies includes a total of 198 objects, which we summarize in Table 2. This table contains, among other information, the distance moduli to each galaxy given in the eight TF studies on which our investigation is based. For seven of these galaxies, we also list their Cepheid distances given in the final results from the Hubble Space Telescope Key Project to measure the Hubble constant by Freedman et al. (2001) corrected for the effects of metallicity.
2.2 Homogenization of the distances to individual galaxies
Since our compilation of TF distances was built from eight datasets that contain sometimes inconsistent data, the average of the measurements available for each object does not necessarily provide the best estimate of the galaxy distances. We thus have attempted first to reduce the data to a homogeneous system by eliminating systematic differences among the different sources. We have carried out this task by means of a recursive procedure applied separately to each of the eight Virgo datasets listed in Table 1 and composed of the following steps:
(i) For each dataset, we take only those galaxies which also have distance measurements in any of the other seven datasets and calculate for each of those objects the arithmetic mean of all their distance estimates, as well as the standard deviation of the individual measurements.
(ii) Then, using only the galaxies in the chosen catalog which have multiple distance measurements, we determine the linear regression of the individual distances against the average values, applying a clipping to remove those points which deviate significantly from the regression line. The regression coefficients are then recalculated and the rejection procedure is repeated until no more galaxies are rejected. Once a datum is flagged as highly deviant, it retains this status for the rest of the procedure.
(iii) The regression coefficients calculated at the end of step (ii) are used to transform all distance measurements of the dataset under scrutiny, including those not listed elsewhere, into the system of mean distances defined by the sample members with multiple observations.
The standardization to the mean values affects each dataset differently. So once steps (i), (ii), and (iii) have been performed for the eight source catalogs (excluding the data already flagged as most deviant), the procedure is repeated again until all the corrections become negligible. Convergence to a homogeneous system of mean distances is achieved in only a few cycles.
When all the distance measurements available for an individual object show residuals inconsistent with the regression lines, we ascribe this to a possible source misidentification and accordingly exclude the galaxy from the calculations. This seems to be the case of the galaxies V0975 and V1678, with only two distance measurements each that disagree beyond allowed uncertainty. We have also excluded from the homogenization process the seven galaxies with Cepheid distances: V0596, V1375, V1555, V1562, V1615, V1943, and N4725. For these galaxies we use the Cepheid measurements and their quoted errors.
The distances obtained with the procedure described above and their associated uncertainties are listed in the last column of Table 2. The rms error of the individual distance moduli is mag, which translates to an uncertainty of about 13% in the redshift-independent distance measurements. This means that for an individual galaxy at, say, 20 Mpc, we expect a typical error in the distance of 2.5 Mpc. This implies a sufficient level of accuracy in the measurement of individual distances to allow us to explore the gross features of the three-dimensional structure of the Virgo cluster.
2.3 The 21-cm sample
For the homogenization of the distance moduli, we have taken all the galaxies listed in two or more of the source TF catalogs (i.e., with multiple distance measures), regardless of their Hubble type, in order to minimize the impact of statistical “shot noise”. Since irregular and bulge-dominated galaxies may give, however, unreliable TF distances and/or H I content measurements, we re-examined the morphologies of the galaxies and picked up only those with Hubble types ranging from (Sa) to (Sm), as given in the Third Reference Catalogue of Bright Galaxies (de Vaucouleurs et al., 1991, hereafter RC3).
The principal source for the H I line fluxes is the Arecibo General Catalog (hereafter AGC), a private database maintained by RG and MPH, which contains an extensive compilation of 21-cm-line measurements collected from a large number of sources. Among the galaxies with a clear spiral morphology, there are 15 for which the AGC did not provide useful data, including 2 galaxies that overlap with obvious optical companions and 3 non-detections. We found H I flux measures for 9 of these objects in A General Catalog of H I Observations of Galaxies (Huchtmeier & Richter, 1989) and in the Lyon-Meudon Extragalactic Database (LEDA). All the observational values have been corrected for the effects of random pointing errors, source extent, and internal H I absorption following Haynes & Giovanelli (1984), except the nine non-AGC fluxes and the only non-detection, V0522, which have been corrected only for internal H I self-absorption and assigned an ’H’ flag in the final dataset.
The AGC is also adopted as the source of other observational parameters required by our study, such as the equatorial coordinates of the galaxies, their visual optical diameters, which are involved in the determination of the H I deficiency (see next section), and their heliocentric radial velocities, which we transform to systemic velocities, , by referring them to the kinematic frame of the Local Group, taken equal to 308 km s-1 towards (Yahil, Tammann, & Sandage, 1977).
On the other hand, for the H I-line width, a parameter of lesser importance in this investigation, the heterogeneity of the measures contained in the AGC prompted us to adopt instead the inclination-corrected values of the line width at 20% level of the line-profile peak, , listed in YFO97. For most of the galaxies that concern us here, these authors provide a set of observations standardized into line widths measured at the Arecibo circular feed following a similar process to that carried out here with the distance moduli. For galaxies not included in the YFO97 sample, we use the values of and inclination quoted in LEDA, except for the galaxy V1043, not listed in either of these two catalogs, for which we adopt the corresponding measurements by MAH80 (measurements other than from YFO97 are flagged ’W’ in the final dataset). Furthermore, we have excluded spiral galaxies with km s-1 to reduce the error induced from turbulent disk motion. We do not impose an inclination cut because this parameter does not play any explicit role in our investigation (remember that, for most of the galaxies in our dataset, we are adopting values of the line width already corrected for inclination). Nevertheless, objects with in LEDA are warned with an ’i’ flag in our final catalog.
After all these selections, we end up with a sample of 161 spiral galaxies with reliable H I content and distance data, hereafter called the “21-cm sample”, which is used below to assess the spatial distribution of the neutral gas deficiency in the Virgo cluster region. As stated in § 4, the scatter of the best fitting TF template for the 161 galaxies is 0.41 mag. Hence, the uncertainty in the distance modulus of the individual galaxies in this dataset is comparable to the scatter of the most accurate TF template relations currently available.
All the parameters relevant to our investigation are listed in Table 3, where we have included two different measurements of the H I deficiency and the absolute -magnitude of the galaxies, , calculated from their total apparent corrected -magnitude listed in LEDA and our distance estimate. The sky distribution of the members of the 21-cm sample is presented in Figure 1.
3 The Diagnosis of H I Deficiency
H I deficiency is often quantified by the parameter defined as
| (1) |
e.g., Chamaraux, Balkowski, & Gérard 1980; Haynes & Giovanelli 1984; Paper I, where is the H I mass of the galaxy in solar units, and the angular brackets on the right of the equal sign indicate the expected value of this quantity inferred from a sample of field galaxies of the same optical linear diameter and morphological type . The most recent determinations of the expectation values for the H I mass as a function of the size and morphology of the galaxies are given in Paper I in the form of linear regressions that imply power law relationships of the type , with the values of oscillating between about 1.7 for Sc’s and 1.2 for earlier spiral types.
For the present study, however, we need to use a calibrator for the neutral gas deficiency not tied to the distance to the galaxies. Given that the relationships do not deviate substantially from a constant H I surface density, especially for the latest spiral types, it is reasonable to adopt the distance-independent approximation to equation (1) based on the difference of the logarithms of the expected and observed values of this latter quantity
| (2) |
where is the mean hybrid H I surface density, which can be calculated directly from the ratio of the observables and the apparent optical diameter of the galaxy, , given in arcmin see also Paper I. The adopted values for are: 0.24 units for Sa, Sab; 0.38 for Sb; 0.40 for Sbc; 0.34 for Sc; and 0.42 for later spiral types.
The values of H I deficiency for the galaxies of the 21-cm sample calculated using the two definitions given above are listed in columns (4) and (5) of Table 3 —to gauge the numerical values, they can be compared with the overall scatter of 0.24 units shown by field galaxies Paper I. A brief glance at the figures shows that the two measurements are indeed very close for most galaxies. Hence, statistical measurements of the H I deficiency that rely on values of DEF taken from subsets of objects not segregated according to size should give unbiased estimates of this property. We note also that the error in resulting from the propagation of the uncertainty in the distance modulus (see § 2.2) is equal to 0.079 units for an Sb galaxy, while the model scatter is equal to 0.126 units. This means that a substantial portion of the error budget of this model can be attributed exclusively to the uncertainty of the galactic distances.
4 Possible Bias of H I Deficiency in the Distance
A potential problem with the determination of TF distances from H I line widths, first brought into consideration by Guhathakurta et al. (1988) and Teerikorpi et al. (1992), results from the possibility that gas stripping can reduce the size of the H I disks to radii smaller than the turnover of the rotation curve (see, e.g., Cayatte et al., 1994). This would produce objects that are too luminous for their line width, therefore resulting in TF distances that are artificially underestimated. Possible evidence of this effect has been cited in the Virgo cluster studies by Fukugita et al. (1993), YFO97, and FTS98, though no environmental dependences on TF distance determinations have been found in more distant clusters (Giovanelli et al., 1997; Dale et al., 2001) using combined H I and optical rotation width datasets.
We have investigated the possible alteration of distance resulting from atomic gas deficiency in our Virgo data by inspecting the positions of the members of the 21-cm sample on the - plane (i.e., the TF relation) according to their H I deficiency. The two linear regressions of the data excluding H I-deficient objects (i.e., those with ) are: and . More importantly, the number of gas-poor galaxies on each side of the regression lines is about the same. Similar behaviors are obtained when the threshold for the exclusion of the H I-deficient objects is increased up to 3 and (the latter value implying roughly a factor 10 decrement in the H I mass), with regression lines obeying equations almost identical to the former ones. These results are consistent with a scenario in which the gas deficiency does not have any noticeable effect on the distance estimates, even for the objects most severely depleted in their interstellar H I gas. This conclusion is also supported by the observation that for the data points corresponding to the most H I-deficient galaxies the values of do not appear to be systematically lower than those calculated from the distance-independent parameter DEF.
The absence of systematic deviations from the mean values of the TF relation with increasing gas deficiency suggests that, in any event, the value of the distance underestimates that could affect our most H I-deficient galaxies should be commonly smaller than the rms residual about the regression line, which has a value of 0.41 mag (i.e., should be lower than 19%). We note that this scatter is only slightly larger than the values around 0.35 mag found in TF templates based on the combination of measurements in many clusters e.g., Gav99, Dale et al. 1999 and fully comparable to the intrinsic scatter of 0.43 mag found by Sakai et al. (2000) for nearby galaxies with Cepheid distances.
5 The H I Deficiency in Virgo
Numerous studies (e.g., Giovanelli & Haynes, 1985; Haynes & Giovanelli, 1986; Magri et al., 1988; Cayatte et al., 1994; Bravo-Alfaro et al., 2000) reveal that gas-poor galaxies tend to be more abundant in the centers of rich galaxy clusters than in their periphery. Virgo is less rich and younger than the classical Abell clusters and is characterized by a lower X-ray luminosity and larger spiral fraction than Coma-like clusters. Probably as a result, although it does contain a substantial fraction of H I-deficient galaxies e.g., Haynes & Giovanelli, 1986; Paper II; see also below, the degree of H I deficiency is not observed to increase towards the center as dramatically as in other rich clusters. However, because of its proximity, even strongly gas-poor galaxies remain detected, allowing precise determination of higher degrees of the H I-deficiency, whereas in more distant clusters only lower limits to this parameter can be derived.
The contour map of H I deficiency shown in Figure 1 illustrates that the maximum of the gas deficiency distribution coincides with the position of the central cD galaxy, M87, where the projected galaxy and intracluster gas densities are also the highest. But this map also reveals other zones of significant deficiency at sky positions dominated by background subclumps which lie at substantial clustercentric distances.
5.1 Radial Pattern
The first lines of evidence that there is an excess of highly deficient galaxies on the outskirts of the Virgo cluster are presented here by means of Figures 2 and 3. Figure 2 shows the values of DEF for the 161 members of the 21-cm sample as a function of their line-of-sight (LOS) distance, . This diagram illustrates that most of the galaxies with substantial deficiencies in the Virgo cluster region are localized in a broad range of projected distances, which stretches from about 10 to 30 Mpc along the LOS. A few more gas deficient objects lie beyond 40 Mpc.
By transforming the sky positions of the galaxies and their LOS distances to rectangular coordinates, we can also inspect the behavior of the H I deficiency as a function of the three-dimensional radial distance, , from the center of Virgo. We adopt the standard identification of the cluster center at the position of M87, given by the sky coordinates and a distance modulus of 31.11 mag quoted in LEDA, which translates to a LOS distance of 16.7 Mpc. The results are shown in Figure 3, where we adopt two different representations of the radial run of the H I deficiency: one based on the parameter used in Paper II, which measures the relative populations of deficient and normal spirals, and the other based directly on the averaged values of DEF. In both cases the data have been binned into annuli containing 16 galaxies per ring, with the final bin having 17, in order to increase the statistical weight of the scarcer low- and high-distance objects.
We see that, for Mpc, the radial behavior of the gas deficiency is consistent with the pattern exhibited by the composite sample of 11 H I-deficient clusters investigated previously in Paper II (see Figure 4 therein): it decreases almost monotonically towards normalcy with increasing distance from the cluster center. But at greater Virgocentric distances this tendency is broken by a series of secondary maxima, more conspicuous in the radial run of because of its higher sensitivity to localized enhancements, caused by regional enhancements of gas deficiency where this parameter reaches values several times larger than —and clearly inconsistent with— the field expectation (2–3%). Besides, as illustrated in Figure 2, the spirals on the Virgo cluster outskirts are not only more likely to be deficient in H I than field objects, but they also reach gas deficiencies typical of the cluster core. The reader, however, should be aware of the fact that this same sort of careful analysis of H I deficiency at large clustercentric distances has not been performed on other clusters. So, it is not unfeasible that the differences in the radial pattern can be explained simply by the bias that arises from Virgo’s proximity which leads to (a) much larger number of 21-cm observations, (b) more stringent values of DEF, and (c) more accurate TF distance estimates.
Further inspection of Figure 2 (see also § 6.1) reveals that the central peak in the radial pattern of the H I deficiency is the result of the accumulation of highly deficient galaxies in the interval of LOS distances ranging from 16 up to 22 Mpc. This range coincides essentially with the distribution of the bright ellipticals associated with the cluster core (Neilsen & Tsvetanov, 2000). The second local maxima visible in the radial run of is produced by galaxies with extreme deficiencies at Mpc, while the peak most distant from the cluster core obeys to several gas-deficient objects at LOS distances between about 25 and 30 Mpc. As we show in the next section, this latter enhancement of H I deficiency might be related to one of the classical background clouds of the Virgo cluster region.
Previous studies by Fukugita, Okamura, & Yasuda (1993), YFO97, and FTS98, among others, have shown that the Virgo spiral distribution is strongly elongated along the LOS. The impressions obtained above from the distribution of H I deficiency, although crude, provide further evidence for the large depth in LOS distance of the Virgo spirals, which we now see that is also reflected in the gaseous deficiency. Hence, in contrast to what it is commonly assumed, not all the H I-poor objects in the Virgo region reside in the neighborhood of the cluster core.
5.2 Correlation with Recessional Velocities
The most frequently discussed gas removal mechanism that depends on the ICM density is ram-pressure sweeping (Gunn & Gott, 1972; Quilis et al., 2000; Vollmer et al., 2001). For a given galaxy, the stripping efficiency relies both on the density of the hot intracluster gas and on the square of the relative velocity of the galaxy with respect to the latter (actually, it is only the component in the direction normal to the disk that matters). Suggestive indication that it is a density that correlates with gas deficiency is provided by the radial nature of the deficiency pattern in the core of rich clusters see Paper II, which, as shown above, it is also reproduced in the center of the Virgo cluster region. However, attempts to unearth further evidence of ram-pressure stripping by seeking possible correlations between H I depletion and velocity relative to the cluster are severely limited, not only by projection effects arising from the poor correlation between the unknown space velocities of the galaxies with the one component that can be measured (see, e.g., Giovanelli & Haynes, 1985; Haynes & Giovanelli, 1986; Magri et al., 1988), but also because in some cases the effects of the galaxy-ICM interaction are observed only after the closest passage of the galaxies to the cluster center (Vollmer et al., 2001).
The inclusion of 2D or 3D positional information increases notably the sensitivity of the tests. In Paper II, this approach served to demonstrate that spirals devoid of gas follow more eccentric orbits than the gas-rich objects in the central regions of H I-deficient clusters. However, in the dynamically young Virgo cluster, where the galaxy orbits are not yet fully settled, no correlation was found between the gas deficiency and the orbital parameters of the spirals. A similar exercise is reproduced here in Figure 4 for a much more spatially extended dataset. This figure shows the radial velocities of the galaxies in our 21-cm sample relative to the Virgo systemic velocity —for this parameter we choose the typical value of km s-1 (e.g., Teerikorpi et al., 1992)— plotted as a function of their right ascension and LOS distance for different intervals of H I deficiency. As in the previous study of the central Virgo region, the inspection of the different panels does not reveal any clear connection between the kinematics of the galaxies and their gas contents. An indication exists that the galaxies with – closest to the cluster core have preferentially higher relative velocities. This impression, however, is not corroborated by the objects with the highest gas deficiencies. The only clear trait, consistently repeated in the four panels, is the coherence in sign and in magnitude of the relative velocities of the galaxies located at large Virgocentric distances, suggesting collective motions that still retain a memory of the Hubble expansion: galaxies behind the Virgo core ( Mpc) tend to move far away at high speed, while almost all galaxies in front of this region ( Mpc) exhibit substantial radial movements toward us. The feasibility of a scenario in which the galaxies at large Virgocentric distances are deficient from having traversed the cluster core earlier is explored in Sanchis et al. (2002).
The inclusion of spatial coordinates perpendicular to the LOS in the present graphical analysis serves to emphasize additionally the marked east-west asymmetry in the depth of the galaxy distribution. In the western half of the Virgo cluster region, most galaxies have LOS distances spread throughout the range from 10 to 50 Mpc, whereas, in the eastern half, few objects are seen at distances larger than 25 Mpc. Interestingly enough, West & Blakeslee (2000) also detected a tendency for the brightest elliptical galaxies located in the western region of the Virgo cluster to be more distant than those on the eastern side. In contrast, as evident in Figure 1, the X-ray emission of the cluster core is more extended towards the eastern side.
6 The Three-Dimensional Structure of the Virgo Region
Some progress toward a precise determination of the complex structure of the Virgo cluster region is now beginning to emerge from distance measurement methods capable of determining individual galaxy distances to a precision comparable to the inter-group separations. Recent studies relying on TF, surface brightness fluctuations, or fundamental plane distance measurement techniques e.g., YFO97; Gav99; Neilsen & Tsvetanov 2000; Fouqué et al. 2001 have produced quite an elaborate set of substructures and opened a debate on the original group membership assignments of numerous galaxies. In essence, however, they have confirmed the robustness of the original subdivision inferred from imaging and recessional velocity data e.g., de Vaucouleurs 1961; VCC; Binggeli et al. 1993 that splits the Virgo I cluster region essentially in two major central subclusters and three peripheral groups (cf. Fig. 1). The largest galaxy concentration dominates the northern part of the Virgo region and coincides with the brightest giant elliptical, M87, which also appears to be the center of the X-ray emission (Böhringer et al., 1994). This main subunit, which will be referred to here as the M87 subcluster, is supposed to trace the cluster core, which might not be virialized Binggeli et al. 1993; Böhringer et al. 1994; Schindler, Binggeli, & Böhringer 1999. Another giant elliptical, M49, marks the center of the other major Virgo galaxy concentration, hereafter the M49 subcluster, located southwards from the M87 subcluster. The M49 subcluster appears to be connected towards the southwest with the W′ and W background clouds (de Vaucouleurs, 1961), forming a continuous chain that extends up to roughly twice the distance of the M87 subcluster (interestingly enough, a tenuous bridge of X-ray luminous gas can be seen in Fig. 1 connecting the M49 subcluster with the W′/W cloud region). Finally, in the northwest and at about the distance of the W cloud, there is another well-defined background cloud named M (Ftclas, Struble, & Fanelli, 1984).
6.1 Spherical Coordinates
Let us see now whether the main substructures of the Virgo region that we have just enumerated bear any relationship with any of the maxima observed in the radial pattern of the H I deficiency. For this, we use the tomographic presentation of the sky distribution of the members of the 21-cm sample shown in Figure 5 which partitions the galaxies into 9 segments of TF distance.
It is seen clearly that the center of gravity of the H I deficiency distribution moves from north to south as the distance increases, consistently following the structure of the Virgo cluster described above. The major concentration of H I-deficient spirals is seen in the distance range of 15–20 Mpc encircling the position of M87. Numerous gas-deficient objects are detected also in the panels corresponding to the distance ranges of 10–15 Mpc and 25–30 Mpc. In the latter, these galaxies are essentially concentrated between the southern edge of the M49 subcluster and the W′/W cloud region, while in the former they tend to be located to the north of M87. Some of the gas poor galaxies in the near distance slice could be former companions of M86 ejected at high speeds to relatively high clustercentric distances because of the falling of this subclump into the cluster Paper II; Vollmer et al. 2001. The intermediate range of Mpc is composed mainly of galaxies with moderate neutral gas deficiencies spreaded more or less uniformly over all the sky. Although the uncertainties in the distance estimates do not permit a neat separation of the different Virgo substructures, it is interesting to note that the majority of the objects in the H I-deficient galaxy clustering seen at 25–30 Mpc also have systemic velocities not dissimilar from those of the M87 subcluster (see Tables 2 and 3), in agreement with the original definition of the W′ cloud given in VCC (note that the W cloud is underrepresented in TF datasets). On the other hand, the marginal indications of a galaxy enhancement in the NW of the 30–35-Mpc-distance slice might correspond to the M cloud, given that the candidate galaxies exhibit systemic velocities around 2000 km s-1. Beyond 35 Mpc, galaxies become progressively scarce, although with an apparent tendency to reside in the peripheral W and M cloud regions. This picture is consistent with the claims that the W and M background clouds of Virgo are twice as far away as its central subunits, with the W′ cloud being somewhat closer e.g., Binggeli et al. 1987; YFO97; Gav99.
A final glance at Figure 5 also shows that the gas-deficient enhancement noted in Paper II around the region of the M cloud (see Fig. 1) is indeed the result of the chance superposition along the LOS of several spirals with substantial gas deficiency, but located at very different LOS distances and without any physical connection.
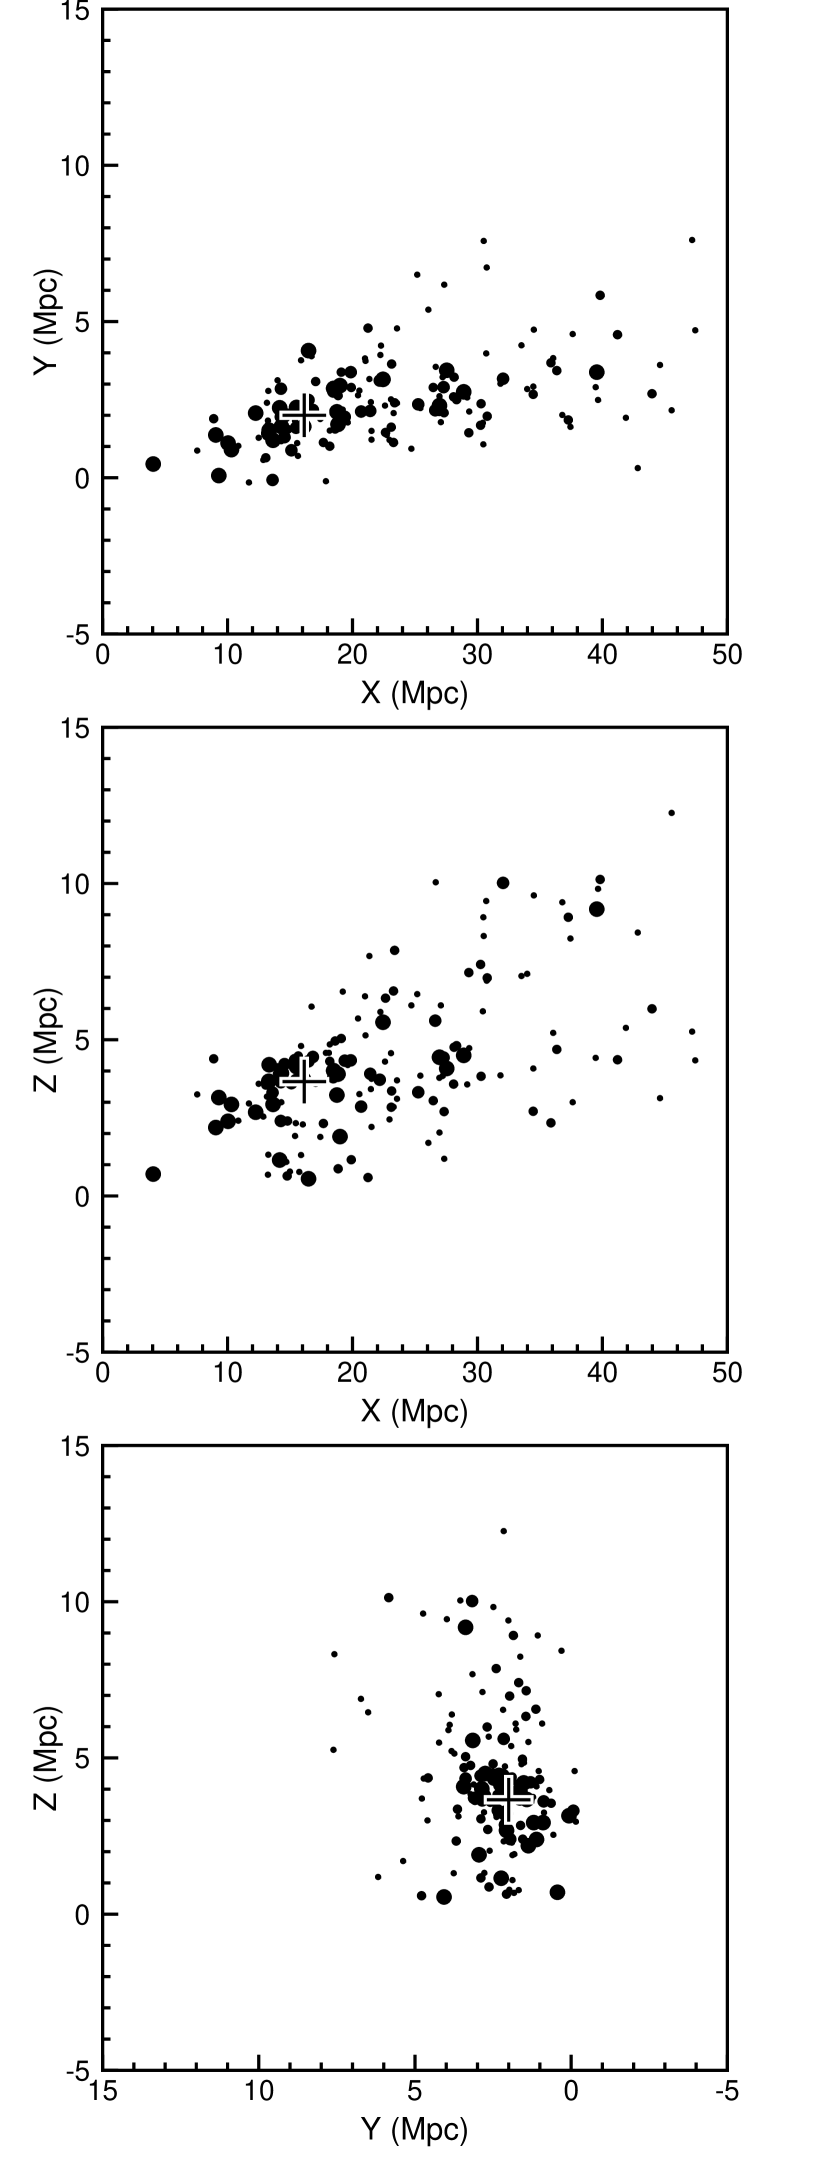
6.2 Cartesian Coordinates
A complementary characterization of the spatial structure of the Virgo region can be inferred from the projected distributions of the spiral galaxies into the three main planes of the cartesian three-dimensional space visualized in Figure 6. In the plots, the xy-plane is taken parallel to the equatorial plane (), with the x- and y-axis pointing to and 18 hr, respectively, and the z-axis pointing to the north. In this coordinate system, the yz-plane is nearly perpendicular to the LOS to M87, i.e., it is roughly a tangent plane to the celestial sphere. The spherical coordinates have been transformed into linear coordinates at the distance of the individual galaxies listed in Table 3. As in previous figures, the symbol sizes are directly proportional to the H I deficiency of the galaxies and the large cross marks the position of M87.
This figure allows one to appreciate the true aspect of the spiral and H I distributions in the Virgo region. One remarkable feature of the galaxy distribution is that at large radial distances (–30 Mpc) it appears to split into two branches in the vertical direction of the xz-plane, which is roughly perpendicular to the plane of the Local Supercluster. The fact that the z-axis is nearly perpendicular to the LOS suggests that this galaxy arrangement is not an artifact produced by the uncertainty in the radial distances affecting for the most part the x direction. Notice also that the upper branch, which goes through M87 and embraces the deficient objects having the most extremal radial distances, contains nearly all the galaxies with strong H I depletions, i.e., those with , or equivalently, with at least a factor three reduction in the H I mass. This upper filament of the spiral distribution is pretty well aligned with the chain of bright elliptical galaxies that defines the principal axis of Virgo (Arp, 1968; West & Blakeslee, 2000).
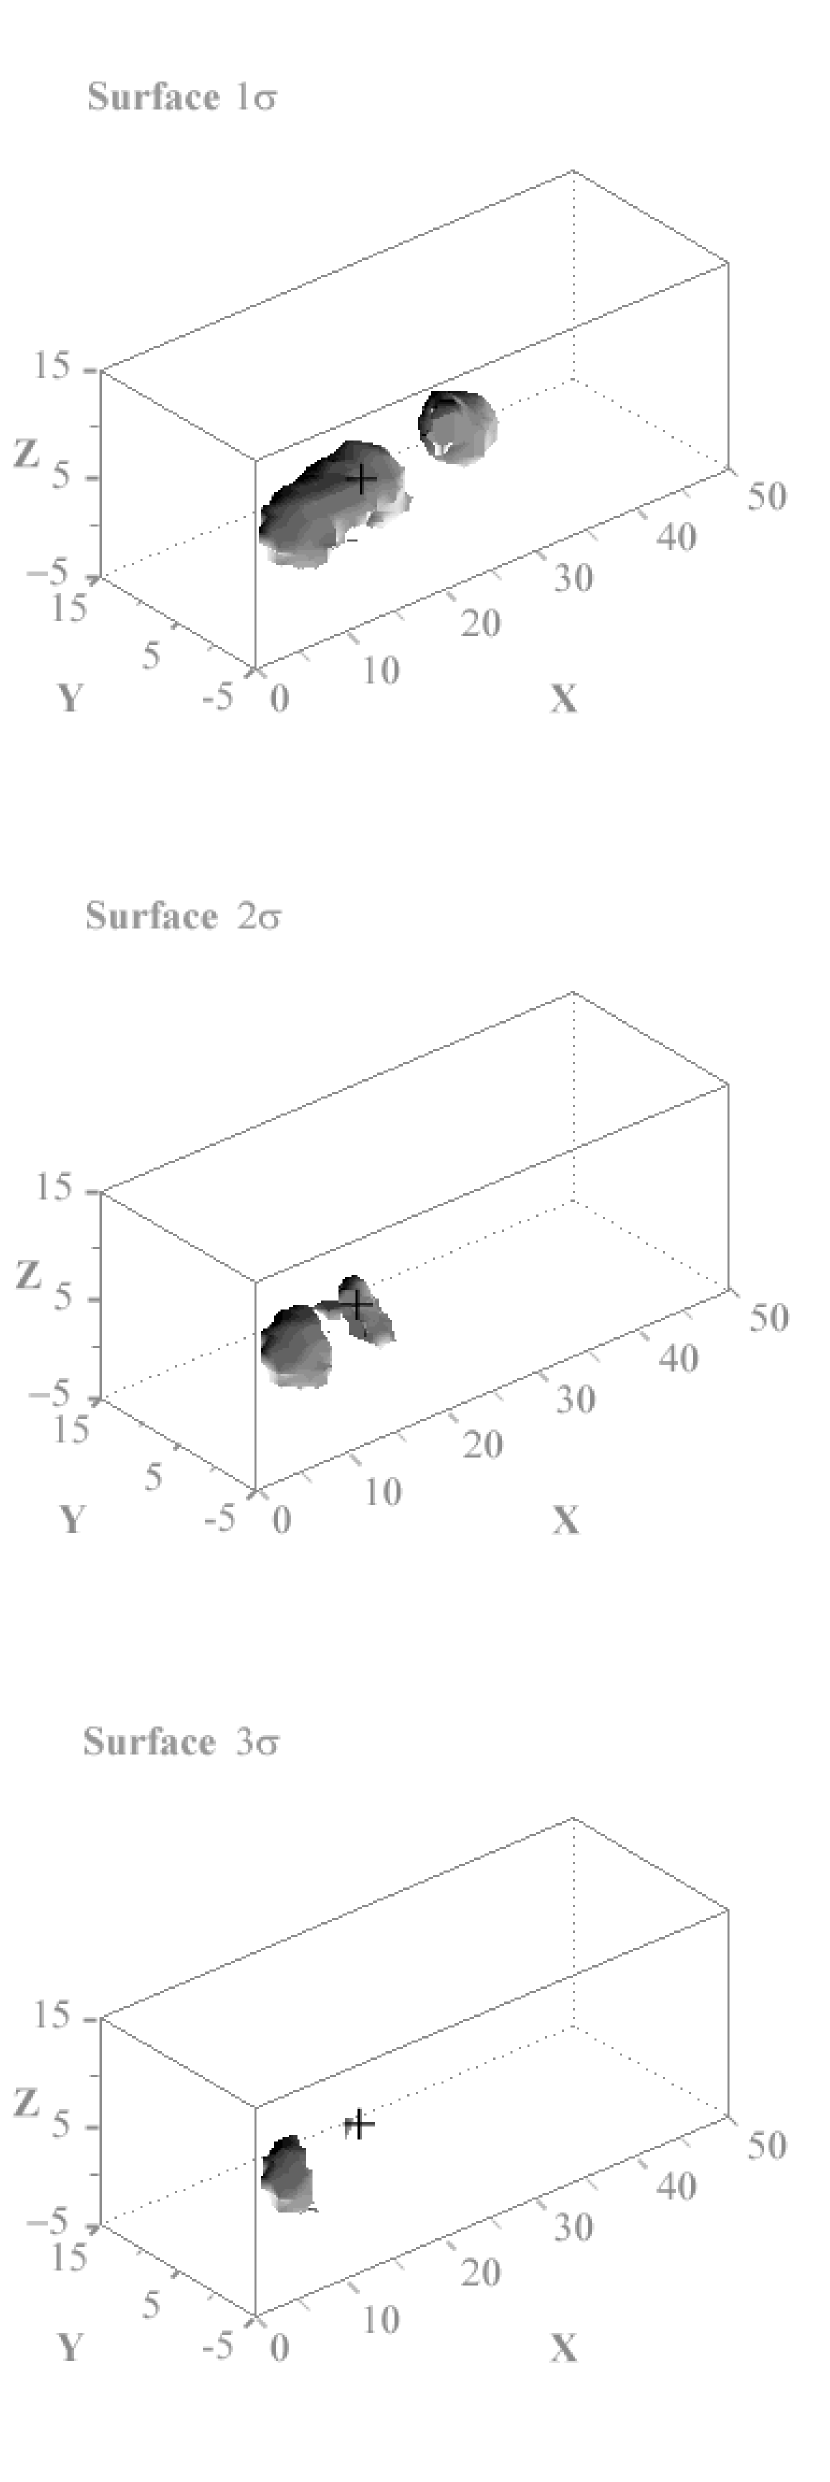
To complete our description of the three-dimensional distribution of the gaseous deficiency, we show in Figure 7 the surfaces of iso-H I deficiency corresponding to 1, 2, and 3 standard deviations from normalcy. These surfaces have been generated by a straightforward extension of the adaptive kernel method described in Silverman (1986) for smoothing galaxy number density distributions, also used in the determination of the H I-deficiency contours depicted in Figure 1. We observe in the panel corresponding to the -level surface the presence of two disconnected condensations of H I deficiency: the elongated one in the front encompasses most of the H I-deficient galaxies associated with the main body of the cluster and the gas-poor objects nearest to us, while the most distant surface is related to the group of strongly gas-deficient galaxies that we have tentatively identified in the background of the Virgo cluster (compare this panel with Figs. 2 and 5). The remaining two panels illustrate the already commented fact that the highest gas deficiencies in the Virgo region are found in the front of the cluster. As explained in § 4, little bias seems to be caused by H I deficiency in the TF distances, even for extreme gas depletions, so the abundance of gas-poor objects at short radial distances from our position appears to be a real effect.
7 Summary and Remarks
In this paper, we have examined in more detail the suggestion presented in Paper II that, in addition to the main galaxy concentration around M87, some of the well-known peripheral Virgo groups also contain strongly gas-deficient spirals. The overall distribution of H I deficiency in the Virgo region has been compared with the three-dimensional galaxy distribution. The following conclusions have been reached:
(1) We confirm that the distribution of the spirals in the Virgo I cluster region is very elongated along the LOS; the galaxies associated with this region have LOS distances raging from less than 10 to more than 50 Mpc. The projected sky distribution of the Virgo spirals, however, looks (lumpy but) relatively compact, with a typical extent of only about 10 Mpc. The overall width-to-depth ratio is approximately 1 : 4, although with a strong east-west variability. The most distant objects concentrate in the western quadrant, while in the eastern half few spirals are seen at LOS distances larger than 25 Mpc. The Virgo filamentary structure appears to split into two branches around the W′ cloud region.
(2) The distribution of spiral galaxies with significant H I deficiency is also characterized by great depth along the LOS. The highly gas-deficient spirals tend to concentrate along the upper branch of the spiral galaxy distribution, which is roughly aligned with the principal axis of the Virgo cluster.
(3) Within 4 Mpc of M87, the measured H I deficiency is essentially a monotonically decreasing function of the distance from that galaxy, in agreement with the behavior observed in other H I-deficient clusters. Moreover, in the Virgo region, significant H I deficiency enhancements are also identified at large distances from the Virgo core, well beyond the typical distance where the hot X-ray emitting ICM is concentrated. Tests of whether locally-high peripheral gas deficiencies are a rather common feature in cluster regions must await the equally-careful tracing of the H I deficiency, incorporating quality 3D distance measures around other clusters.
(4) While the principal peak in the distribution of H I deficiency arises from numerous gas-poor galaxies coincident with the core and with LOS distances ranging from 16 to 22 Mpc, other important enhancements of the gas deficiency are associated with several nearby galaxies ( Mpc) moving away from the cluster with large relative velocities, and with what appears to be a compact background group of galaxies between 25–30 Mpc, most with roughly the same systemic velocities as the cluster mean, which matches the original definition of the W′ cloud. In addition, we have demonstrated that the localized enhancement in DEF observed in the Virgo sky map around the M cloud position actually arises from several galaxies at very different distances aligned along the LOS and without any physical connection. In agreement with results presented by Dale et al. (2001), nothing in our analysis suggests that TF distance measurements are unreliable in objects with severe gas depletion.
Further progress in (1) and (2) needs a careful revision of TF distances —at least until Cepheid distance measurements in Virgo galaxies become more commonplace. Even after the elimination of systematic differences among published Virgo catalogs, a few galaxies still exhibit strongly inconsistent distance measurements: 16 of the 161 members of the 21-cm sample have uncertainties larger than 5 Mpc. Nevertheless, although the details may be questioned, the general picture reporting the elongated structure of the distribution of both the spirals and their H I deficiency, as well as the clumped nature of the latter, should be correct. We can make a simple estimate of the typical elongation introduced by the uncertainty in the distances. The standard deviation of individual distances ( mag) is likely responsible for an increase of 40 in the scale of the true LOS distance distribution by assuming an average distance of the spiral galaxies of 20 Mpc. Given that the absolute errors in distance increase with the values of this quantity, as it is obvious from inspection of Figure 2, one can expect an artificial increment of the depth by a somewhat larger factor for the most distant galaxies which, in any event, would be clearly insufficient to account for the very strong LOS elongation of the galaxy distribution.
On the other hand, results (3) and (4) have profound implications on our understanding of the gas removal events and the influence of the environment on the life of the galaxies. While the characteristics exhibited by the H I deficiency in cluster centers tend to support the interaction between the galaxies and the hot intracluster gas as the main cause of their gas depletion, our finding that a number of spirals with substantial H I deficiencies lie at large radial distances from the Virgo cluster center is hard to reconcile with the proposition that this environmental process is also the cause. At this stage, it would be desirable to investigate whether these peripheral deficient objects have been produced in situ by alternative gas deficiency mechanisms, such as galaxy-galaxy interactions, predicted to operate in galaxy groups. In this sense, it would be of importance to perform multi-wavelength observations of the H I-deficient subclump detected in the Virgo background. Model calculations show that tidal stresses in disks generate extended tail structures in the stellar and neutral hydrogen distributions, the latter with surface densities well above the detection threshold of the most sensitive aperture-synthesis radio observations. In contrast, gas depletion arising from the ram-pressure sweeping of the interstellar medium should produce a dearth of atomic gas in the outer portions of the disks, as well as bow shocks and dense gaseous tails observable in X-rays.
References
- Arp (1968) Arp, H. 1968, PASP, 80, 129
- Binggeli et al. (1993) Binggeli, B., Popescu, C., & Tammann, G.A. 1993, A&AS, 98, 275
- VCC (1985) Binggeli, B., Sandage, A., & Tammann, G.A. 1985, AJ, 90, 1681 (VCC)
- Binggeli et al. (1987) Binggeli, B., Tammann, G.A., & Sandage, A. 1987, AJ, 94, 251
- Böhringer et al. (1994) Böhringer, H., Briel, U.G., Schwarz, R.A., Voges, W., Hartner, G., & Trümper, J. 1994, Nature, 368, 828
- Bravo-Alfaro et al. (2000) Bravo-Alfaro, H., Cayatte, V., van Gorkom, J.H., & Balkowski, C. 2000, AJ, 119, 580
- Cayatte et al. (1994) Cayatte, V., Kotanyi, C., Balkowski, C., & van Gorkom, J.H. 1994, AJ, 107, 1003
- Chamaraux et al. (1980) Chamaraux, P., Balkowski, C., & Gérard, E. 1980, A&A, 83, 38
- Dale et al. (1999) Dale, D.A., Giovanelli, R., Haynes, M.P., Campusano, L.E., & Hardy, E. 1999, AJ, 118, 1489
- Dale et al. (2001) Dale, D.A., Giovanelli, R., Haynes, M.P., Hardy, E., & Campusano, L.E. 2001, AJ, 121, 1886
- de Lapparent et al. (1986) de Lapparent, V., Geller, M.J. & Huchra, J.P. 1986, ApJ, 302, L1
- de Vaucouleurs (1961) de Vaucouleurs, G. 1961, ApJS, 6, 213
- RC3 (1991) de Vaucouleurs, G., de Vaucouleurs, A., Corwin, H.G., Buta, R.J., Paturel, G., & Fouqué, P. 1991, Third Reference Catalogue of Bright Galaxies (New York: Springer) (RC3)
- Dressler (1986) Dressler, A. 1986, ApJ, 301, 35
- Ekh00 (2000) Ekholm T., Lanoix, P., Teerikorpi, P., Fouqué, P., & Paturel, G. 2000, A&A, 355, 835 (Ekh00)
- FTS98 (1998) Federspiel, M., Tammann, G.A., & Sandage, A. 1998, ApJ, 495, 115 (FTS98)
- Fou90 (1990) Fouqué, P., Bottinelli, L., Gouguenheim, L., & Paturel, G. 1990, ApJ, 349, 1 (Fou90)
- Fouqué et al. (2001) Fouqué, P., Solanes, J.M., Sanchis, T., & Balkowski, C. 2001, A&A, 375, 770
- Freedman et al. (2001) Freedman, W.L., et al. 2001, ApJ, 553, 47
- Ftclas et al. (1984) Ftclas, C., Struble, M.F., & Fanelli, M.N. 1984, ApJ, 282, 19
- Fukugita et al. (1993) Fukugita, M., Okamura, S., & Yasuda, N. 1993, ApJ, 412, L13
- Gav99 (1999) Gavazzi, G., Boselli, A., Scodeggio, M., Pierini, D., & Belsole, E. 1999, MNRAS, 304, 595 (Gav99)
- Giovanelli & Haynes (1985) Giovanelli, R., & Haynes, M.P. 1985, ApJ, 292, 404
- Giovanelli et al. (1997) Giovanelli, R., Haynes, M.P., Herter, T., Vogt, N.P., Da Costa, L.N., Freudling, W., Salzer, J.J., & Wegner, G. 1997, AJ, 113, 53
- Guhathakurta et al. (1988) Guhathakurta, P., van Gorkom, J.H., Kotanyi, C.G., & Balkowski, C. 1988, AJ, 96, 851
- Gunn & Gott (1972) Gunn, J.E., & Gott, J.R. 1972, ApJ, 176, 1
- Haynes & Giovanelli (1984) Haynes, M.P., & Giovanelli, R. 1984, AJ, 89, 758
- Haynes & Giovanelli (1986) Haynes, M.P., & Giovanelli, R. 1986, ApJ, 306, 466
- Huchtmeier & Richter (1989) Huchtmeier, W.K., & Richter, O.G., 1989, A General Catalog of H I Observations of Galaxies (Berlin: Springer)
- KCT88 (1988) Kraan-Korteweg, R.C., Cameron, L.M., & Tammann, G.A. 1988, ApJ, 331, 620 (KCT88)
- Magri et al. (1988) Magri, C., Haynes, M.P., Forman, W., Jones, C., & Giovanelli, R. 1988, ApJ, 333, 136
- MAH80 (1980) Mould, J., Aaronson, M., & Huchra, J. 1980, ApJ, 238, 458 (MAH80)
- Neilsen & Tsvetanov (2000) Neilsen, E.H., & Tsvetanov, Z.I. 2000, ApJ, 536, 255
- PT88 (1988) Pierce, M.J., & Tully, R.B. 1988, ApJ, 330, 579 (PT88)
- Quilis et al. (2000) Quilis, V., Moore, B., & Bower, R. 2000, Science, 288, 1617
- Sakai et al. (2000) Sakai, S., Mould, J.R., et al. 2000, ApJ, 529, 698
- Sanchis et al. (2002) Sanchis, T., Solanes, J.M., Salvador-Solé, E., Fouqué, P. 2002, ApJ, in press
- Schindler et al. (1999) Schindler, S., Binggeli, B., & Böhringer, H. 1999, A&A, 343, 420
- Silverman (1986) Silverman, B. W. 1986, Density Estimation for Statistics and Data Analysis (London: Chapman and Hall)
- Paper I (1996) Solanes, J.M., Giovanelli, R., & Haynes, M.P. 1996, ApJ, 461, 609 (Paper I)
- Paper II (2001) Solanes, J.M., Manrique, A., González-Casado, G., García-Gómez, C., Giovanelli, R., & Haynes, M.P. 2001, ApJ, 548, 97 (Paper II)
- Teerikorpi et al. (1992) Teerikorpi, P., Bottinelli, L., Gouguenheim, L., & Paturel, G. 1992, A&AS, 260, 17
- Tully (1982) Tully, R.B. 1982, ApJ, 257, 389
- Tully & Fisher (1977) Tully, R.B., & Fisher, J.R. 1977, A&AS, 54, 661 (TF)
- Vollmer et al. (2001) Vollmer, B., Cayatte, V., Balkowski, C., & Duschl, W.J. 2001, ApJ, 561, 708
- West & Blakeslee (2000) West, M.J., & Blakeslee, J.P. 2000, ApJ, 543, L27
- Yahil et al. (1977) Yahil, A., Tammann, G.A., & Sandage, A. 1977, ApJ, 207, 903
- YFO97 (1997) Yasuda, N., Fukugita, M., & Okamura, S. 1997, ApJS, 108, 417 (YFO97)


| Number of galaxies | |||
|---|---|---|---|
| Source | Acronym | Total | Selected |
| Yasuda, Fukugita, & Okamura 1997 | YFO97 | 246 | 165 |
| Mould, Aaronson, & Huchra 1980 | MAH80 | 23 | 21 |
| Pierce & Tully 1988 | PT88 | 34 | 34 |
| Kraan-Korteweg, Cameron, & Tammann 1988 | KCT88 | 128 | 84 |
| Fouqué et al. 1990 | Fou90 | 178 | 145 |
| Federspiel, Tammann, & Sandage 1998 | FTS98 | 132 | 129 |
| Gavazzi et al. 1999 | Gav99 | 75 | 72 |
| Ekholm et al. 2000 | Ekh00 | 96 | 52 |
| NGC/ | UGC/ | R.A. | Decl. | Distance | ||||||||||||
|---|---|---|---|---|---|---|---|---|---|---|---|---|---|---|---|---|
| VCC | IC | CGCG | (1950) | (1950) | T | Mem. | YFO97 | MAH80 | PT88 | KCT88 | Fou90 | FTS98 | Gav99 | Ekh00 | Ceph. | modulus |
| (1) | (2) | (3) | (4) | (5) | (6) | (7) | (8) | (9) | (10) | (11) | (12) | (13) | (14) | (15) | (16) | (17) |
| CG69-10 | 115700.8 | 140951 | 7 | 30.82 | 29.83 | |||||||||||
| I0755 | U7001 | 115837.3 | 142313 | 3 | 31.63 | 31.03 | 31.20 | |||||||||
| N4037 | U7002 | 115850.6 | 134041 | 3 | 30.68 | 30.61 | ||||||||||
| N4064 | U7054 | 120137.3 | 184316 | 1 | 29.94 | 30.18 | 29.97 | |||||||||
| N4067 | U7048 | 120138.2 | 110813 | 3 | 33.39 | 32.70 | 33.29 | |||||||||
| U7133 | 120646.7 | 191631 | 7 | 33.99 | ||||||||||||
| V0015 | I3021 | U7149 | 120721.6 | 131942 | 9 | M | 33.79 | |||||||||
| V0025 | N4152 | U7169 | 120803.8 | 161845 | 5 | 32.27 | 32.00 | 32.85 | 33.05 | |||||||
| V0034 | I3033 | U7181 | 120837.2 | 135154 | 7 | A | 32.12 | 31.99 | 31.88 | 32.04 | ||||||
| V0047 | N4165 | U7201 | 120939.0 | 133130 | 2 | M | 33.80 | |||||||||
| V0058 | I0769 | U7209 | 120959.4 | 122400 | 4 | M | 32.39 | 32.68 | 32.99 | 32.92 | 33.52 | |||||
| V0066 | N4178 | U7215 | 121013.8 | 110848 | 7 | 30.51 | 31.02 | 30.52 | 29.44 | 30.22 | 30.78 | 30.86 | 30.59 | |||
| V0067 | I3044 | U7216 | 121015.6 | 141518 | 6 | A | 31.57 | 30.69 | 30.94 | 30.94 | ||||||
| V0073 | N4180 | U7219 | 121028.9 | 071901 | 2 | W | 33.33 | 32.50 | 33.53 | 32.72 | 33.57 | |||||
| V0081 | U7223 | 121053.0 | 150300 | 7 | A | 32.87 | 33.70 | |||||||||
| V0087 | 121107.0 | 154354 | 9 | A | 31.92 | 32.02 | 31.75 | |||||||||
| V0089 | N4189 | U7235 | 121114.4 | 134212 | 6 | M | 32.64 | 31.63 | 32.64 | 33.01 | ||||||
| V0092 | N4192 | U7231 | 121115.4 | 151023 | 3 | A | 30.81 | 30.67 | 30.65 | 30.55 | 30.59 | 30.98 | 30.36 | 31.17 | ||
| V0097 | N4193 | U7234 | 121121.0 | 132700 | 4 | M | 32.78 | 32.98 | 32.64 | 33.54 | ||||||
| V0105 | U7239 | 121136.0 | 080300 | 10 | 32.08 | 32.61 | ||||||||||
| V0119 | U7249 | 121205.4 | 130524 | 10 | A | 31.86 | 31.78 | 31.89 | 31.62 | 31.78 | ||||||
| V0120 | N4197 | U7247 | 121204.9 | 060501 | 6 | 31.82 | 31.89 | 31.68 | 31.56 | 31.91 | ||||||
| V0126 | I3059 | U7254 | 121222.8 | 134412 | 10 | A | 31.87 | 31.73 | 31.92 | |||||||
| V0131 | I3061 | U7255 | 121231.8 | 141824 | 5 | M | 33.11 | 32.75 | 32.70 | 33.37 | ||||||
| V0132 | 121232.3 | 131841 | 8 | A | 30.67 | 29.77 | ||||||||||
| V0143 | I3066 | U7262 | 121243.2 | 134506 | 4 | A | 32.89 | 32.33 | 32.04 | |||||||
| V0145 | N4206 | U7260 | 121244.4 | 131812 | 4 | A | 31.48 | 31.36 | 31.01 | 31.47 | 31.20 | 31.15 | 31.29 | |||
| V0152 | N4207 | U7268 | 121258.2 | 095148 | 6 | 31.87 | 32.00 | 31.65 | 31.75 | 31.08 | ||||||
| V0157 | N4212 | U7275 | 121306.6 | 141048 | 5 | A | 31.36 | 31.45 | 31.54 | 31.23 | 31.23 | 31.04 | 31.98 | |||
| V0162 | I3074 | U7279 | 121313.4 | 105836 | 8 | 32.51 | 32.64 | 32.49 | 32.01 | 32.21 | ||||||
| V0167 | N4216 | U7284 | 121321.6 | 132536 | 3 | A | 31.13 | 30.81 | 30.81 | 30.73 | 31.23 | 31.35 | 30.65 | 31.34 | ||
| V0187 | N4222 | U7291 | 121349.8 | 133512 | 6 | A | 31.80 | 31.87 | 31.70 | 31.46 | 32.91 | |||||
| V0199 | N4224 | U7292 | 121400.4 | 074420 | 1 | W | 33.30 | |||||||||
| V0213 | I3094 | U7305 | 121423.4 | 135412 | 5 | A | 33.37 | 32.60 | ||||||||
| V0222 | N4235 | U7310 | 121435.7 | 072811 | 1 | W | 31.48 | 31.76 | ||||||||
| V0224 | I3099 | U7313 | 121437.2 | 124454 | 6 | M | 32.39 | 32.55 | 32.37 | |||||||
| V0226 | N4237 | U7315 | 121438.2 | 153608 | 4 | A | 31.63 | 32.15 | 31.80 | 31.95 | 31.48 | 32.52 | ||||
| V0241 | I3105 | U7326 | 121501.2 | 124000 | 10 | A | 30.48 | 30.56 | 30.74 | 30.69 | ||||||
| V0267 | I3115 | U7333 | 121526.4 | 065553 | 6 | 34.92 | 31.96 | 32.08 | ||||||||
| V0289 | N4252 | U7343 | 121557.6 | 055018 | 3 | 31.81 | 31.62 | |||||||||
| V0297 | CG42-1 | 121605.4 | 065906 | 5 | 31.85 | |||||||||||
| V0307 | N4254 | U7345 | 121616.8 | 144142 | 5 | A | 30.56 | 31.28 | 30.54 | 31.42 | ||||||
| V0318 | I0776 | U7352 | 121630.0 | 090806 | 8 | 32.36 | 32.24 | 32.27 | 31.99 | 32.58 | ||||||
| V0341 | N4260 | U7361 | 121648.8 | 062240 | 1 | W | 33.14 | 33.42 | ||||||||
| V0343 | I3148 | 121648.0 | 080900 | 8 | W | 31.93 | ||||||||||
| V0382 | N4273 | U7380 | 121722.3 | 053727 | 5 | W | 31.83 | 32.27 | 32.19 | 32.91 | ||||||
| V0393 | N4276 | U7385 | 121734.7 | 075810 | 6 | W | 32.23 | |||||||||
| V0404 | U7387 | 121742.9 | 042847 | 7 | W | 32.67 | ||||||||||
| V0415 | CG42-36 | 121752.8 | 071112 | 5 | W | 33.31 | 31.63 | |||||||||
| V0449 | N4289 | U7403 | 121830.0 | 040000 | 6 | W | 33.20 | 33.75 | ||||||||
| V0453 | 121833.0 | 115224 | 6 | A | 32.74 | 32.42 | 31.31 | |||||||||
| V0460 | N4293 | U7405 | 121841.1 | 183936 | 0 | A | 31.14 | 30.81 | 30.91 | 30.53 | 31.03 | |||||
| V0465 | N4294 | U7407 | 121845.0 | 114724 | 6 | A | 30.66 | 31.15 | 30.85 | 30.55 | 30.66 | 30.86 | ||||
| V0483 | N4298 | U7412 | 121900.6 | 145306 | 5 | A | 31.03 | 32.22 | 31.04 | 31.19 | ||||||
| V0491 | N4299 | U7414 | 121907.8 | 114648 | 8 | A | 32.49 | |||||||||
| V0497 | N4302 | U7418 | 121910.2 | 145236 | 5 | A | 31.82 | 31.53 | 31.51 | 30.78 | 32.01 | |||||
| V0509 | U7423 | 121922.3 | 064343 | 9 | W’ | 32.67 | 32.67 | 32.27 | 33.13 | |||||||
| V0512 | U7421 | 121923.0 | 121435 | 10 | A | 32.05 | 32.02 | 31.30 | ||||||||
| V0514 | U7424 | 121925.2 | 085706 | 10 | B | 32.00 | 30.70 | |||||||||
| V0522 | N4305 | U7432 | 121931.2 | 130106 | 1 | A | 33.15 | |||||||||
| V0524 | N4307 | U7431 | 121933.0 | 091906 | 3 | B | 32.75 | 31.91 | 32.02 | 32.05 | 32.49 | |||||
| V0534 | N4309 | U7435 | 121938.9 | 072520 | -1 | W’ | 32.26 | 31.61 | ||||||||
| V0559 | N4312 | U7442 | 121959.4 | 154858 | 2 | A | 30.46 | 30.03 | 29.84 | |||||||
| V0566 | 122005.0 | 083424 | 9 | W’ | 32.17 | 32.25 | 31.68 | |||||||||
| V0567 | I3225 | U7441 | 122006.5 | 065714 | 8 | W | 32.33 | 32.40 | ||||||||
| V0570 | N4313 | U7445 | 122006.6 | 120454 | 2 | A | 30.79 | 30.72 | 30.82 | 30.91 | 30.34 | |||||
| V0576 | N4316 | U7447 | 122010.2 | 093636 | 6 | B | 32.42 | 32.55 | 32.30 | 32.28 | 31.70 | 32.88 | ||||
| V0593 | I3229 | U7448 | 122018.0 | 065700 | 4 | W’ | 32.07 | 31.83 | 31.52 | |||||||
| V0596 | N4321 | U7450 | 122023.2 | 160600 | 4 | A | 30.45 | 31.32 | 30.41 | 30.91 | 30.82 | 30.94 | 30.91 | |||
| V0613 | N4324 | U7451 | 122032.5 | 053136 | -1 | W | 31.81 | 31.19 | ||||||||
| V0620 | I3239 | 122037.8 | 120018 | 9 | A | 32.36 | 31.49 | 30.63 | ||||||||
| V0630 | N4330 | U7456 | 122045.0 | 113842 | 6 | A | 31.21 | 31.76 | 31.30 | 31.38 | 31.31 | |||||
| V0656 | N4343 | U7465 | 122105.0 | 071358 | 3 | W’ | 32.75 | 32.24 | 32.39 | 31.71 | 32.54 | |||||
| V0664 | I3258 | U7470 | 122112.0 | 124518 | 10 | A | 30.18 | 30.50 | 31.57 | |||||||
| V0667 | I3259 | U7469 | 122116.2 | 072749 | 8 | W’ | 32.00 | 31.80 | 32.14 | |||||||
| V0688 | N4353 | 122124.0 | 080400 | 10 | B | 32.84 | 32.05 | 32.68 | ||||||||
| V0692 | N4351 | U7476 | 122129.4 | 122854 | 2 | A | 30.16 | 30.18 | 30.01 | 30.48 | ||||||
| V0697 | I3267 | U7474 | 122133.0 | 071912 | 6 | W’ | 32.89 | |||||||||
| V0699 | I3268 | U7477 | 122134.7 | 065300 | 5 | B | 32.81 | 32.11 | ||||||||
| V0713 | N4356 | U7482 | 122142.1 | 084848 | 6 | B | 31.96 | 32.56 | 32.37 | 32.36 | ||||||
| V0737 | CG42-86 | 122206.6 | 041636 | 8 | W | 32.17 | ||||||||||
| V0740 | 122207.0 | 084647 | 10 | B | 33.22 | 32.75 | 32.21 | |||||||||
| V0768 | I3298 | 122236.0 | 171700 | 4 | 32.79 | 32.34 | 32.59 | |||||||||
| V0785 | N4378 | U7497 | 122244.3 | 051213 | 1 | W | 33.46 | |||||||||
| V0787 | N4376 | U7498 | 122245.3 | 060106 | 10 | 31.49 | 31.31 | 31.13 | 31.55 | 31.89 | ||||||
| V0792 | N4380 | U7503 | 122249.8 | 101736 | 2 | B | 31.47 | 31.20 | 31.30 | 31.27 | 32.09 | 32.13 | 31.73 | 32.42 | ||
| V0801 | N4383 | U7507 | 122253.8 | 164448 | 1 | A | 30.90 | 30.95 | 31.19 | |||||||
| V0809 | I3311 | U7510 | 122300.6 | 123212 | 7 | A | 31.62 | 31.50 | 31.43 | 31.38 | ||||||
| V0827 | I3322A | U7513 | 122309.9 | 072936 | 6 | B | 31.94 | 31.51 | 31.74 | 32.18 | 32.12 | 31.66 | 31.58 | 32.29 | ||
| V0836 | N4388 | U7520 | 122313.8 | 125618 | 3 | A | 31.11 | 31.09 | 30.75 | 30.84 | 30.89 | 31.13 | 31.13 | 32.05 | ||
| V0849 | N4390 | U7519 | 122319.8 | 104348 | 5 | A | 31.45 | 31.21 | 32.15 | 32.09 | ||||||
| V0851 | I3322 | U7518 | 122321.6 | 075000 | 6 | B | 31.72 | 31.67 | 31.57 | 31.43 | ||||||
| V0857 | N4394 | U7523 | 122324.7 | 182930 | 3 | A | 31.93 | 31.83 | ||||||||
| V0859 | U7522 | 122325.8 | 034230 | 6 | W | 32.69 | 33.37 | |||||||||
| V0865 | N4396 | U7526 | 122327.5 | 155655 | 7 | A | 30.58 | 30.62 | 30.25 | 30.33 | 31.00 | |||||
| V0873 | N4402 | U7528 | 122334.8 | 132324 | 3 | A | 31.13 | 31.31 | 30.81 | 31.06 | 30.29 | 32.07 | ||||
| V0874 | N4405 | U7529 | 122335.8 | 162726 | 0 | 31.52 | 30.15 | 30.63 | ||||||||
| V0905 | N4411A | U7537 | 122356.4 | 090854 | 5 | B | 30.27 | 30.68 | 33.04 | bbfootnotemark: | ||||||
| V0912 | N4413 | U7538 | 122400.0 | 125318 | 2 | A | 30.95 | 30.45 | 31.01 | 31.29 | 31.01 | |||||
| V0938 | N4416 | U7541 | 122414.5 | 081151 | 6 | B | 33.12 | 32.36 | ||||||||
| V0939 | N4411B | U7546 | 122415.0 | 090942 | 6 | B | 32.23 | 32.05 | ||||||||
| V0950 | I3356 | U7547 | 122421.6 | 115018 | 10 | A | 31.71 | 30.70 | 30.12 | |||||||
| V0952 | 122422.7 | 100917 | 5 | B | 32.48 | 31.74 | 31.55 | |||||||||
| V0957 | N4420 | U7549 | 122424.6 | 024615 | 5 | W | 31.03 | 30.93 | ||||||||
| V0958 | N4419 | U7551 | 122425.1 | 151928 | 1 | A | 30.73 | 30.82 | 30.15 | 30.97 | ||||||
| V0971 | N4423 | U7556 | 122436.2 | 060923 | 8 | 31.09 | 31.17 | 30.84 | 31.55 | |||||||
| V0975 | U7557 | 122436.0 | 073200 | 9 | B | 31.73 | 33.89 | aafootnotemark: | ||||||||
| V0979 | N4424 | U7561 | 122440.2 | 094148 | 1 | B | 28.00 | 28.25 | ||||||||
| V0980 | I3365 | U7563 | 122442.0 | 161200 | 10 | A | 31.05 | 31.25 | 30.76 | 30.71 | ||||||
| V0989 | 122445.0 | 075654 | 7 | W’ | 34.35 | |||||||||||
| V0995 | I3371 | U7565 | 122449.2 | 110836 | 6 | A | 32.16 | 31.99 | 31.95 | 31.33 | ||||||
| V1002 | N4430 | U7566 | 122453.6 | 063223 | 3 | B | 32.76 | 31.35 | ||||||||
| V1011 | U7567 | 122456.7 | 075517 | 10 | B | 32.53 | 32.31 | 31.70 | ||||||||
| V1043 | N4438 | U7574 | 122513.8 | 131706 | 1 | A | 29.79 | 29.79 | 30.51 | 30.26 | 30.80 | |||||
| V1048 | U7579 | 122522.6 | 055950 | 8 | W | 33.03 | 33.07 | 33.01 | ||||||||
| V1086 | N4445 | U7587 | 122543.8 | 094248 | 2 | B | 31.54 | 31.29 | 31.30 | 31.26 | ||||||
| V1091 | U7590 | 122546.2 | 090018 | 4 | B | 31.79 | 32.03 | 31.67 | 31.25 | |||||||
| V1110 | N4450 | U7594 | 122558.0 | 172140 | 2 | A | 30.77 | 30.22 | 30.67 | 30.43 | 30.56 | 31.35 | 30.51 | 31.88 | ||
| I3391 | U7595 | 122555.6 | 184132 | 6 | 31.07 | 31.86 | ||||||||||
| V1118 | N4451 | U7600 | 122608.4 | 093206 | 3 | B | 32.23 | 31.97 | 32.04 | 32.37 | 32.16 | |||||
| V1126 | I3392 | U7602 | 122612.0 | 151640 | 2 | A | 31.00 | 31.13 | 30.82 | 30.36 | ||||||
| N4455 | U7603 | 122614.1 | 230601 | 7 | 29.85 | 29.96 | 29.20 | |||||||||
| V1189 | I3414 | U7621 | 122656.2 | 070250 | 8 | B | 31.24 | 31.01 | 30.58 | 31.01 | ||||||
| V1193 | N4466 | U7626 | 122658.0 | 075820 | 2 | B | 32.31 | 31.90 | 32.33 | 32.21 | ||||||
| V1205 | N4470 | U7627 | 122705.3 | 080556 | 1 | 30.82 | 30.77 | 31.13 | 31.26 | |||||||
| V1290 | N4480 | U7647 | 122753.4 | 043127 | 5 | W | 32.94 | 32.64 | 33.36 | |||||||
| V1330 | N4492 | U7656 | 122827.4 | 082113 | 1 | B | 31.69 | 32.61 | ||||||||
| V1356 | I3446 | 122851.6 | 114600 | 9 | A | 33.48 | 32.62 | 31.91 | ||||||||
| V1375 | N4496A | U7668A | 122905.8 | 041256 | 8 | W | 30.86 | |||||||||
| V1379 | N4498 | U7669 | 122908.8 | 170746 | 6 | A | 30.82 | 30.34 | 30.36 | 30.63 | 30.72 | 30.98 | 30.99 | |||
| V1393 | I0797 | U7676 | 122922.9 | 152400 | 6 | 31.49 | 31.60 | 31.37 | 31.83 | |||||||
| V1401 | N4501 | U7675 | 122927.6 | 144142 | 3 | A | 31.20 | 31.12 | 31.25 | 31.13 | 30.82 | 31.58 | 30.87 | 31.98 | ||
| V1410 | N4502 | U7677 | 122932.2 | 165747 | 6 | A | 32.53 | 32.80 | 32.25 | |||||||
| V1442 | I3474 | U7687 | 123004.0 | 025618 | 7 | W | 30.95 | |||||||||
| V1450 | I3476 | U7695 | 123010.8 | 141930 | 10 | A | 30.90 | 31.28 | 31.71 | |||||||
| U7697 | 123020.8 | 202740 | 6 | 32.28 | ||||||||||||
| V1486 | I3483 | 123039.0 | 113712 | 3 | A | 32.30 | 33.63 | 33.73 | ||||||||
| V1508 | N4519 | U7709 | 123057.6 | 085548 | 7 | B | 31.27 | 31.82 | 31.25 | 31.28 | 31.38 | 31.84 | 31.33 | 32.57 | ||
| V1516 | N4522 | U7711 | 123107.8 | 092700 | 6 | B | 31.06 | 30.48 | 30.67 | 31.23 | 30.45 | 30.92 | 30.71 | |||
| V1524 | N4523 | U7713 | 123118.0 | 152600 | 9 | A | 32.16 | 33.25 | ||||||||
| V1532 | I0800 | U7716 | 123125.8 | 153751 | 5 | 30.66 | 31.29 | 31.05 | 30.93 | |||||||
| V1540 | N4527 | U7721 | 123135.5 | 025545 | 4 | W | 31.21 | 30.03 | 31.38 | |||||||
| V1554 | N4532 | U7726 | 123146.7 | 064443 | 10 | B | 29.94 | 31.10 | 30.65 | 31.01 | 30.01 | 30.23 | ||||
| V1555 | N4535 | U7727 | 123147.9 | 082825 | 5 | B | 30.47 | 31.19 | 30.60 | 30.51 | 30.16 | 30.78 | 30.67 | 31.68 | 30.99 | |
| V1557 | N4533 | U7725 | 123148.7 | 023610 | 7 | W | 31.43 | |||||||||
| V1562 | N4536 | U7732 | 123153.5 | 022750 | 4 | W | 30.74 | 30.65 | 30.87 | |||||||
| V1566 | I3517 | U7733 | 123158.8 | 092554 | 9 | B | 31.96 | 31.70 | 31.26 | 32.11 | ||||||
| V1569 | I3520 | 123200.0 | 134654 | 6 | A | 33.47 | 31.65 | 32.03 | 31.73 | |||||||
| V1575 | I3521 | U7736 | 123206.8 | 072609 | 10 | B | 31.28 | 31.79 | 31.07 | 31.23 | ||||||
| V1581 | U7739 | 123213.0 | 063435 | 10 | B | 32.58 | 32.77 | |||||||||
| V1588 | N4540 | U7742 | 123220.1 | 154937 | 6 | A | 31.83 | 30.39 | 31.39 | 30.51 | ||||||
| V1605 | 123242.5 | 104224 | 5 | A | 32.45 | 32.04 | 31.25 | |||||||||
| V1615 | N4548 | U7753 | 123255.2 | 144624 | 3 | A | 30.81 | 30.89 | 30.66 | 31.31 | 30.88 | 31.65 | 31.05 | |||
| V1624 | N4544 | U7756 | 123303.3 | 031845 | 1 | S | 31.73 | 31.68 | 31.17 | |||||||
| V1644 | 123321.0 | 140800 | 9 | A | 33.17 | 33.28 | 32.75 | |||||||||
| N4561 | U7768 | 123338.4 | 193556 | 7 | 32.01 | 31.42 | ||||||||||
| V1673 | N4567 | U7777 | 123401.2 | 113200 | 4 | A | 32.68 | |||||||||
| V1676 | N4568 | U7776 | 123402.4 | 113054 | 4 | A | 31.36 | 32.10 | ||||||||
| V1678 | I3576 | U7781 | 123406.0 | 065400 | 9 | B | 33.30 | 30.41 | aafootnotemark: | |||||||
| V1686 | I3583 | U7784 | 123412.6 | 133200 | 10 | A | 30.17 | 31.17 | 30.46 | 30.68 | ||||||
| V1690 | N4569 | U7786 | 123418.6 | 132624 | 2 | A | 29.77 | 29.56 | 29.49 | 29.69 | 30.05 | 30.37 | 31.03 | |||
| V1696 | N4571 | U7788 | 123425.2 | 142948 | 6 | A | 30.99 | 30.55 | 30.84 | 31.70 | 31.41 | |||||
| V1699 | I3591 | U7790 | 123429.9 | 071159 | 10 | B | 31.02 | 31.20 | 30.69 | |||||||
| V1725 | 123509.0 | 085000 | 10 | B | 31.66 | 31.57 | 30.71 | |||||||||
| V1726 | U7795 | 123513.0 | 072247 | 10 | B | 31.08 | 31.03 | 31.20 | ||||||||
| V1727 | N4579 | U7796 | 123512.0 | 120536 | 3 | A | 31.30 | 31.06 | 31.07 | 31.74 | 31.61 | 31.86 | ||||
| V1730 | N4580 | U7794 | 123515.6 | 053838 | 2 | 31.35 | 31.34 | |||||||||
| V1758 | U7802 | 123548.0 | 081000 | 6 | 31.73 | 32.07 | 31.65 | |||||||||
| V1760 | N4586 | U7804 | 123555.1 | 043537 | 1 | S | 31.24 | 30.40 | ||||||||
| V1780 | N4591 | U7821 | 123639.9 | 061711 | 3 | 33.25 | 33.64 | 33.80 | ||||||||
| V1791 | I3617 | U7822 | 123653.0 | 081412 | 10 | 31.34 | 31.06 | 31.89 | 30.92 | |||||||
| V1811 | N4595 | U7826 | 123720.9 | 153423 | 3 | A | 30.66 | 30.91 | 30.78 | 30.71 | 30.94 | |||||
| V1859 | N4606 | U7839 | 123826.4 | 121112 | 1 | A | 30.52 | 30.58 | 30.37 | |||||||
| V1868 | N4607 | U7843 | 123840.8 | 120954 | 3 | A | 31.53 | 31.86 | 31.36 | 31.49 | ||||||
| V1923 | N4630 | U7871 | 123958.5 | 041403 | 10 | S | 31.14 | 30.91 | ||||||||
| V1929 | N4633 | U7874 | 124006.6 | 143748 | 8 | A | 31.63 | 32.57 | 31.45 | 31.86 | 31.48 | |||||
| V1932 | N4634 | U7875 | 124010.2 | 143412 | 6 | A | 31.53 | 31.59 | 31.27 | |||||||
| V1933 | 124012.5 | 073642 | 2 | 32.82 | 32.49 | |||||||||||
| V1943 | N4639 | U7884 | 124021.0 | 133154 | 4 | A | 31.74 | 31.57 | 32.07 | 31.74 | 32.55 | 32.00 | 32.53 | 31.71 | ||
| V1955 | N4641 | U7889 | 124036.0 | 121924 | -2 | A | 29.64 | 29.17 | ||||||||
| V1972 | N4647 | U7896 | 124101.2 | 115112 | 5 | A | 30.65 | 31.09 | 31.57 | 31.19 | 31.95 | |||||
| N4651 | U7901 | 124112.5 | 164005 | 5 | 31.57 | 31.45 | 31.58 | 31.46 | 31.46 | 32.16 | 32.57 | |||||
| V1987 | N4654 | U7902 | 124126.4 | 132400 | 6 | A | 30.56 | 30.79 | 30.43 | 30.74 | 30.51 | 30.74 | 30.75 | 31.41 | ||
| V2023 | I3742 | U7932 | 124301.2 | 133624 | 5 | A | 31.69 | 31.90 | 31.37 | 31.73 | 32.25 | |||||
| V2058 | N4689 | U7965 | 124515.0 | 140206 | 5 | A | 30.75 | 30.64 | 30.64 | 31.06 | 31.74 | |||||
| V2070 | N4698 | U7970 | 124551.8 | 084537 | 1 | 32.80 | 31.28 | 31.77 | 31.73 | 32.03 | 31.53 | 32.35 | ||||
| N4701 | U7975 | 124639.0 | 033945 | 6 | 32.71 | |||||||||||
| N4713 | U7985 | 124725.6 | 053458 | 7 | 30.92 | 30.63 | 30.65 | |||||||||
| N4725 | U7989 | 124759.9 | 254620 | 2 | 30.78 | 30.46 | ||||||||||
| N4746 | U8007 | 124925.2 | 122118 | 3 | 32.43 | 32.34 | 32.59 | 33.15 | ||||||||
| N4758 | U8014 | 125014.8 | 160710 | 9 | 30.57 | 30.62 | 31.19 | 30.95 | 30.93 | |||||||
| N4771 | U8020 | 125048.5 | 013230 | 6 | 32.31 | |||||||||||
| N4772 | U8021 | 125055.9 | 022627 | 1 | 32.81 | |||||||||||
| I3881 | U8036 | 125220.2 | 192655 | 6 | 31.90 | 31.08 | 31.11 | |||||||||
| N4808 | U8054 | 125317.0 | 043428 | 6 | 31.49 | 30.80 | ||||||||||
| N4845 | U8078 | 125528.1 | 015042 | 2 | 31.81 | |||||||||||
| U8085 | 125547.8 | 144952 | 6 | 32.54 | ||||||||||||
| U8114 | 125754.4 | 135635 | 3 | 32.14 |
Note. — Col. (1)(3): Galaxy names according to VCC,
NGC or IC, and UGC or CGCG.
Col. (4) & (5): Galaxy coordinates. Units of right ascension are
hours, minutes, and seconds. Units of declination are degrees,
arcminutes, and arcseconds.
Col. (6): Morphological type index defined in RC3.
Col. (7): Membership given in VCC and Binggeli et al. (1993). M:
member; A/B: clusters A/B; W/W’/M: clouds W/W’/M; S: southern
extension.
Col. (8)(15): Distance modulus to each galaxy given in each of the
data sets listed in Table 1.
Col. (16): Distance modulus from Cepheids given by Freedman et al. (2001).
Col. (17): Mean distance modulus and uncertainty resulting from the homogeneization of the data sets (see text).
aafootnotemark: All individual measures of the distance modulus rejected in the homogenization procedure.
bbfootnotemark: All but one individual measure of the distance modulus rejected in the homogenization procedure.
| Galaxy | d | ||||||
|---|---|---|---|---|---|---|---|
| Name | ( km s-1) | (Mpc) | DEF | ( km s-1) | Flag | ||
| (1) | (2) | (3) | (4) | (5) | (6) | (7) | (8) |
| Z69-10 | 1330 | 0.19 | 0.35 | 107 | w | 15.83 | |
| I0755 | 1388 | 0.21 | 0.09 | 231 | H | 17.69 | |
| N4037 | 814 | 0.88 | 0.67 | 190 | i | 17.96 | |
| N4064 | 837 | 1.39 | 1.19 | 226 | 18.15 | ||
| N4067 | 2281 | 0.08 | 0.19 | 422 | 20.56 | ||
| U7133 | 2486 | 0.05 | 0.07 | 260 | o,W | 19.26 | |
| V0015 | 2406 | 0.77 | 0.88 | 227 | o | 19.45 | |
| V0025 | 2062 | 0.45 | 0.47 | 379 | i,s | 19.91 | |
| V0034 | 145 | 0.04 | 0.00 | 159 | 17.46 | ||
| V0047 | 1742 | 0.40 | 0.38 | 342 | o | 19.74 | |
| V0058 | 2110 | 0.19 | 0.04 | 323 | s | 20.00 | |
| V0066 | 242 | 0.02 | 0.08 | 296 | 19.54 | ||
| V0067 | 299 | 0.23 | 0.20 | 171 | 17.41 | ||
| V0073 | 1933 | 0.05 | 0.06 | 460 | s | 20.43 | |
| V0081 | 1963 | 0.01 | 0.10 | 209 | i,s | 17.80 | |
| V0087 | 242 | 0.36 | 0.36 | 151 | 16.86 | ||
| V0089 | 2004 | 0.20 | 0.28 | 438 | 20.32 | ||
| V0092 | 246 | 0.26 | 0.45 | 479 | 20.61 | ||
| V0097 | 2356 | 0.20 | 0.32 | 388 | 20.35 | ||
| V0120 | 1910 | 0.01 | 0.07 | 295 | 19.52 | ||
| V0131 | 2201 | 0.05 | 0.06 | 315 | 19.86 | ||
| V0143 | 264 | 0.54 | 0.30 | 177 | H,s | 17.74 | |
| V0145 | 584 | 0.16 | 0.34 | 295 | 19.76 | ||
| V0152 | 456 | 0.00 | 0.02 | 267 | 18.71 | ||
| V0157 | 200 | 0.17 | 0.12 | 368 | 19.98 | ||
| V0162 | 1847 | 0.22 | 0.16 | 238 | 18.17 | ||
| V0167 | 16 | 0.53 | 0.71 | 533 | 21.02 | ||
| V0187 | 114 | 0.02 | 0.09 | 248 | 19.46 | ||
| V0199 | 2448 | 0.25 | 0.33 | 575 | o | 20.74 | |
| V0213 | 278 | 0.12 | 0.25 | 308 | i,s | 18.98 | |
| V0222 | 2453 | 0.35 | 0.34 | 343 | H | 19.23 | |
| V0224 | 2011 | 0.22 | 0.28 | 227 | 18.89 | ||
| V0226 | 756 | 0.54 | 0.47 | 330 | 19.81 | ||
| V0267 | 584 | 0.01 | 0.00 | 644 | 18.50 | ||
| V0289 | 709 | 0.37 | 0.04 | 180 | 17.37 | ||
| V0297 | 1847 | 0.54 | 0.43 | 170 | o,W | 17.04 | |
| V0307 | 2303 | 0.04 | 0.04 | 452 | i | 20.90 | |
| V0318 | 2328 | 0.09 | 0.05 | 236 | 18.28 | ||
| V0341 | 1649 | 0.03 | 0.04 | 536 | H | 20.63 | |
| V0382 | 2219 | 0.32 | 0.29 | 365 | 20.29 | ||
| V0393 | 2473 | 0.13 | 0.14 | 273 | i,o | 18.54 | |
| V0404 | 1574 | 0.32 | 0.38 | 268 | o,W | 19.24 | |
| V0415 | 2413 | 0.49 | 0.41 | 200 | s | 17.08 | |
| V0449 | 2377 | 0.06 | 0.23 | 371 | W | 20.47 | |
| V0453 | 785 | 0.56 | 0.51 | 127 | s,w | 16.14 | |
| V0465 | 239 | 0.08 | 0.08 | 244 | 19.04 | ||
| V0483 | 1016 | 0.08 | 0.03 | 318 | 19.92 | ||
| V0491 | 112 | 0.40 | 0.36 | 349 | i,o,W | 19.91 | |
| V0497 | 1034 | 0.27 | 0.28 | 383 | 20.39 | ||
| V0509 | 1109 | 0.03 | 0.04 | 181 | 17.53 | ||
| V0522 | 1814 | 0.92 | 0.95 | 457 | H,o,W | 20.13 | |
| V0524 | 913 | 1.16 | 1.24 | 490 | W | 20.33 | |
| V0559 | 47 | 1.19 | 1.02 | 232 | 18.39 | ||
| V0566 | 1267 | 0.14 | 0.20 | 117 | w | 16.79 | |
| V0567 | 2215 | 0.11 | 0.13 | 233 | 18.12 | ||
| V0570 | 1319 | 1.04 | 0.90 | 280 | 18.94 | ||
| V0576 | 1117 | 0.19 | 0.26 | 334 | 19.84 | ||
| V0593 | 1392 | 0.47 | 0.17 | 159 | H | 17.31 | |
| V0596 | 1468 | 0.32 | 0.49 | 482 | i | 21.12 | |
| V0620 | 622 | 0.13 | 0.28 | 130 | s,w | 16.40 | |
| V0630 | 1438 | 0.65 | 0.73 | 279 | 19.35 | ||
| V0656 | 868 | 0.40 | 0.40 | 401 | 19.92 | ||
| V0667 | 1279 | 0.53 | 0.54 | 212 | 18.39 | ||
| V0692 | 2203 | 0.60 | 0.17 | 164 | i | 17.47 | |
| V0697 | 1085 | 0.30 | 0.29 | 280 | i,o | 18.68 | |
| V0699 | 579 | 0.31 | 0.46 | 295 | i | 18.44 | |
| V0713 | 998 | 1.28 | 1.35 | 302 | 19.42 | ||
| V0737 | 1566 | 0.02 | 0.00 | 164 | o,W | 17.95 | |
| V0768 | 2354 | 0.61 | 0.49 | 212 | H | 18.71 | |
| V0785 | 2395 | 0.17 | 0.11 | 624 | i,o | 21.00 | |
| V0792 | 840 | 0.60 | 0.62 | 346 | 19.51 | ||
| V0801 | 1608 | 0.42 | 0.73 | 302 | 18.84 | ||
| V0809 | 262 | 0.62 | 0.61 | 178 | 17.89 | ||
| V0827 | 847 | 0.07 | 0.15 | 306 | 19.53 | ||
| V0836 | 2420 | 1.14 | 1.24 | 401 | 20.17 | ||
| V0849 | 972 | 0.06 | 0.02 | 236 | i | 18.73 | |
| V0851 | 1061 | 0.46 | 0.48 | 216 | 18.59 | ||
| V0857 | 823 | 0.27 | 0.33 | 432 | i | 20.41 | |
| V0859 | 1265 | 0.33 | 0.43 | 321 | W | 19.94 | |
| V0865 | 228 | 0.22 | 0.22 | 202 | 18.54 | ||
| V0873 | 121 | 0.57 | 0.50 | 298 | 19.27 | ||
| V0905 | 1146 | 0.52 | 0.41 | 147 | i,w | 17.43 | |
| V0938 | 1244 | 0.15 | 0.20 | 417 | i | 19.80 | |
| V0939 | 1135 | 0.53 | 0.63 | 328 | i | 19.16 | |
| V0957 | 1530 | 0.07 | 0.04 | 232 | W | 18.76 | |
| V0958 | 380 | 0.92 | 0.74 | 307 | 19.19 | ||
| V0971 | 942 | 0.08 | 0.10 | 191 | 18.45 | ||
| V0979 | 314 | 1.32 | 0.76 | 108 | w | 15.99 | |
| V0989 | 1704 | 0.12 | 0.13 | 195 | i,o | 18.52 | |
| V0995 | 797 | 0.06 | 0.06 | 172 | 17.57 | ||
| V1002 | 1301 | 0.27 | 0.29 | 420 | i,s | 19.48 | |
| V1043 | 45 | 0.73 | 0.84 | 398 | W | 19.56 | |
| V1048 | 2102 | 0.23 | 0.27 | 251 | 19.14 | ||
| V1086 | 230 | 1.11 | 0.98 | 240 | 18.61 | ||
| V1091 | 983 | 0.16 | 0.39 | 203 | 18.06 | ||
| V1110 | 1861 | 1.06 | 1.08 | 405 | 20.14 | ||
| I3391 | 1618 | 0.29 | 0.22 | 183 | i,s | 18.03 | |
| V1118 | 725 | 0.43 | 0.25 | 308 | 19.35 | ||
| V1126 | 1571 | 1.08 | 0.79 | 228 | 18.44 | ||
| N4455 | 576 | 0.12 | 0.20 | 160 | 16.77 | ||
| V1189 | 381 | 0.24 | 0.18 | 170 | 17.31 | ||
| V1193 | 616 | 0.15 | 0.12 | 237 | 18.24 | ||
| V1205 | 2200 | 0.07 | 0.34 | 206 | 18.34 | ||
| V1290 | 2281 | 0.04 | 0.03 | 366 | W | 20.28 | |
| V1330 | 1638 | 0.85 | 0.78 | 297 | i,s | 19.19 | |
| V1356 | 1129 | 0.27 | 0.32 | 228 | s | 17.94 | |
| V1375 | 1581 | aafootnotemark: | 0.11 | 0.09 | 303 | W | 19.09 |
| V1379 | 1411 | 0.22 | 0.23 | 234 | 18.58 | ||
| V1393 | 1995 | 0.06 | 0.01 | 219 | 18.37 | ||
| V1401 | 2167 | 0.40 | 0.55 | 603 | 21.55 | ||
| V1410 | 1531 | 0.04 | 0.04 | 225 | 18.58 | ||
| V1442 | 1572 | 0.06 | 0.09 | 154 | H,o,W | 17.71 | |
| U7697 | 2454 | 0.09 | 0.13 | 215 | o,W | 17.10 | |
| V1486 | 6 | 0.65 | 0.65 | 180 | H | 18.82 | |
| V1508 | 1093 | 0.21 | 0.14 | 287 | i | 19.37 | |
| V1516 | 2199 | 0.65 | 0.69 | 257 | 18.82 | ||
| V1524 | 158 | 0.13 | 0.04 | 299 | i,s | 18.98 | |
| V1532 | 2237 | 0.72 | 0.57 | 151 | i | 17.29 | |
| V1540 | 1571 | 0.14 | 0.04 | 410 | W | 19.99 | |
| V1555 | 1825 | aafootnotemark: | 0.16 | 0.19 | 397 | i | 20.64 |
| V1557 | 1596 | 0.34 | 0.35 | 187 | o,W | 18.18 | |
| V1562 | 1641 | aafootnotemark: | 0.08 | 0.25 | 394 | W | 20.43 |
| V1566 | 295 | 0.61 | 0.58 | 133 | w | 17.04 | |
| V1569 | 687 | 0.90 | 0.85 | 215 | 16.50 | ||
| V1588 | 1184 | 0.39 | 0.36 | 338 | i | 18.82 | |
| V1615 | 383 | aafootnotemark: | 0.77 | 0.83 | 410 | i | 20.38 |
| V1624 | 992 | 0.57 | 0.43 | 212 | W | 18.01 | |
| V1644 | 646 | 0.23 | 0.26 | 114 | w | 16.26 | |
| N4561 | 1324 | 0.67 | 0.70 | 293 | 19.23 | ||
| V1676 | 2125 | 0.35 | 0.49 | 248 | W | 20.43 | |
| V1690 | 328 | 1.13 | 1.26 | 401 | 20.28 | ||
| V1696 | 235 | 0.48 | 0.55 | 311 | i | 19.58 | |
| V1727 | 1397 | 0.75 | 0.89 | 594 | i | 21.18 | |
| V1730 | 893 | 1.17 | 1.05 | 283 | i | 18.84 | |
| V1758 | 1651 | 0.37 | 0.37 | 185 | 18.03 | ||
| V1760 | 639 | 1.15 | 1.06 | 292 | W | 18.72 | |
| V1780 | 2279 | 0.17 | 0.23 | 399 | s | 19.88 | |
| V1811 | 530 | 0.34 | 0.02 | 204 | 18.37 | ||
| V1859 | 1528 | 1.25 | 1.00 | 224 | 18.27 | ||
| V1868 | 2138 | 0.73 | 0.69 | 245 | 18.89 | ||
| V1929 | 185 | 0.06 | 0.07 | 228 | 18.83 | ||
| V1932 | 11 | 0.28 | 0.30 | 291 | 19.51 | ||
| V1943 | 873 | aafootnotemark: | 0.09 | 0.12 | 375 | 19.90 | |
| V1972 | 1297 | 0.42 | 0.36 | 345 | i,W | 19.58 | |
| N4651 | 705 | 0.29 | 0.29 | 472 | 20.81 | ||
| V1987 | 926 | 0.06 | 0.12 | 365 | 20.13 | ||
| V2023 | 856 | 0.17 | 0.26 | 205 | 18.44 | ||
| V2058 | 1493 | 0.65 | 0.61 | 320 | i | 19.55 | |
| V2070 | 882 | 0.20 | 0.14 | 663 | s | 20.79 | |
| N4701 | 574 | 0.30 | 0.21 | 272 | i,o,W | 19.55 | |
| N4713 | 511 | 0.35 | 0.35 | 280 | i | 18.66 | |
| N4725 | 1163 | 0.21 | 0.45 | 510 | W | 20.68 | |
| N4746 | 1669 | 0.18 | 0.19 | 365 | 20.08 | ||
| N4758 | 1150 | 0.21 | 0.21 | 207 | 18.60 | ||
| N4771 | 959 | 0.31 | 0.39 | 293 | o,W | 19.88 | |
| N4772 | 883 | 0.07 | 0.03 | 510 | o,W | 20.56 | |
| I3881 | 849 | 0.08 | 0.14 | 249 | 18.77 | ||
| N4808 | 616 | 0.68 | 0.69 | 265 | W | 19.60 | |
| N4845 | 940 | 1.20 | 1.26 | 596 | o,W | 19.90 | |
| U8085 | 1943 | 0.14 | 0.06 | 246 | o,W | 19.16 | |
| U8114 | 1887 | 0.11 | 0.06 | 157 | o,W | 16.90 |
Note. — Col. (2): Radial velocities from H I measurements referred to the kinematic frame of the Local Group.
Col. (3): Distance and -errors.
aafootnotemark: Distance from Cepheids. Errors
are those quoted by Freedman et al. (2001).
Col. (4) & (5): H I deficiency parameters defined in the text.
Col. (6): Edge-on H I line width.
Col. (7): H: non-AGC flux or non-detection corrected only for
internal H I self-absorption; i: (from LEDA); o: distance
based on a single non-Cepheid measurement; s: uncertainties
in the distance larger than 5 Mpc; W: corrected H I line width not from
YFO97; w: 100 km s-1 (see text for further
details).
Col. (8): Total absolute corrected -magnitude calculated from the absorption-free brightness given in LEDA.