Testing intermediate-age stellar evolution models with VLT photometry of LMC clusters. II. Analysis with the Yale models111Based on observations collected at the European Southern Observatory, Chile (ESO No 64.L-0385).
Abstract
We present an analysis, using Yale stellar evolution models, of the color-magnitude diagrams (CMDs) of three intermediate-age LMC clusters, namely NGC 2173, SL 556 and NGC 2155, obtained with the VLT. The main goal of our project is to investigate the amount of convective core overshoot necessary to reproduce the CMDs of relatively metal-poor, intermediate age stellar populations, to check whether the extrapolation that is usually made from solar metallicity is valid. In the process, we obtained values for the binary fraction of each cluster, together with refined age estimates. Our method involved the comparison of the observed CMDs with synthetic CMDs computed using various values of the overshoot parameter and binary fraction. We conclude that a moderate amount of overshoot and some fraction of binary stars are essential for reproducing the observed shapes around the turnoff in the CMD’s of all three clusters: unresolved binary stars fill in the expected core contraction gap, and make a unique sequence near the gap, which cannot be reproduced by single stars alone, even with a larger amount of overshoot. We utilize ratios of the number of stars in different areas around the core contraction gap to constrain the binary fraction, which is around 10-20% (for primary-to-secondary mass ratio 0.7) in all three clusters. Even if binary stars contaminate the core contraction gap, it is shown that the overshoot parameter can be inferred from the color dispersion of the stars around the contraction gap, regardless of the assumed binary fraction. From our overall analysis such as, shape of isochrones, star counts, color distribution, and synthetic CMD comparisons, we conclude that overshoot of the local pressure scale height best reproduces the CMD properties of all three clusters. The best age estimates are 1.5, 2.1 and 2.9 Gyr for NGC 2173, SL 556 and NGC 2155, respectively.
1 Introduction
Stellar evolution theory is routinely tested using Galactic clusters, either globular (in general old, and both metal-poor and metal-rich) or open (intermediate-age or young, and generally more metal-rich than globular clusters). These clusters reflect the particular star formation and chemical enrichment history of the Milky Way, and certainly do not represent all possible stellar populations. For example, intermediate-age, metal-poor populations, which are not well represented in the Galaxy, are conspicuous in the Magellanic Clouds. This is an important part of the parameter space, which is relevant, for example, to the study of stellar populations of dwarf galaxies in the Local Group, or to that of galaxies at high redshifts, and therefore, in early evolutionary stages.
There are uncertainties that are critical to modeling intermediate-mass stellar models. Most notable of them are the treatments of convection (e.g., convective core overshoot) and mass loss. In this paper, we will address them, using intermediate-age Magellanic Cloud clusters as comparison templates.
Convective core overshoot (OS) is one of the physical parameters which must be taken into account during the core hydrogen burning phase of the evolution of intermediate-mass stars. Stellar evolution theory predicts that the CMD of young and intermediate-age star clusters is greatly affected by the amount of OS. In the early days of stellar structure theory, the convective core size was determined by the classic Schwarzschild (1906) criterion, ignoring the so-called OS, which is due to the inertial motion of materials beyond the formal core edge. Initially, the extent of core OS was thought to be negligible (Saslaw & Schwarzschild 1965). Subsequent theoretical studies, however, have emphasized the importance of convective core OS in stellar evolutionary models (Shaviv & Salpeter 1973).
Since then, many observational and theoretical studies have been devoted to investigating the effects of core OS (Prather & Demarque 1974; Bressan, Chiosi & Bertelli 1981; Bertelli, Bressan & Chiosi 1985; Stothers 1991; Meynet, Mermilliod & Maeder 1993). It is now generally believed that a moderate amount of core OS is necessary in order to reproduce the shape of the core contraction gap observed in CMDs of galactic open clusters (Maeder & Mermilliod 1981; Stothers & Chin 1991; Carraro et al. 1993; Daniel et al. 1994; Demarque, Sarajedini, & Guo 1994; Kozhurina-Platais et al. 1997; Rosvick & VandenBerg 1998), but the dependence of core OS on stellar mass is still poorly understood and the subject of on-going investigations (e.g. Ribas, Jordi, & Gimenez 2000).
The extent of OS is not currently derivable through direct theoretical calculations but can be determined empirically by comparing synthetic CMDs to observed ones, with OS in the models often being parameterized as a fraction of the pressure scale height at the formal edge of the convective core. In the CMDs of intermediate-age star clusters ( Age Gyr), which have a distinctive gap near the turnoff (TO) caused by the rapid contraction of a hydrogen-exhausted convective core, the TO topology can be used to evaluate the extent of core OS (Demarque et al. 1994; Kozhurina-Platais et al. 1997). In the case of younger clusters, the importance of core OS can be estimated from the observed luminosity function of main sequence (MS) stars (Chiosi et al. 1989; Barmina, Girardi & Chiosi 2002) and from the ratio of main sequence to post-main sequence stars. Studies of detached eclipsing binaries can also provide empirical estimates of OS by direct comparison with stellar tracks in the log - log plane (Schroder, Pols, & Eggleton 1997; Guinan et al. 2000; Ribas et al. 2000). However, the number of binary systems available for OS studies is very limited.
Many galactic open cluster studies have suggested a moderate amount of OS, i.e. of the local pressure scale height at the edge of a convective core. However, this has been tested only for near solar metallicity clusters in the Galaxy. So far, the presence of OS in metal-poor clusters in the Magellanic Clouds has only been tested in a limited sample of young (age 500 Myr) clusters (Lattanzio et al. 1991; Vallenari et al. 1991, 1994; Stothers & Chin 1992; Brocato, Castellani & Piersimoni 1994; Chiosi et al. 1995; Testa et al. 1999; Keller, Da Costa & Bessell 2001; Barmina et al. 2002). For Magellanic Clouds intermediate-age clusters, the necessary observations are more challenging due to the fainter magnitude of the TO, and HST or 8-m class telescopes under excellent seeing conditions are required.
The characteristics of mass loss during the RGB phase are still unclear in many aspects. Among the early papers on the subject, that of Reimers (1975) was most influential and his mass loss formula has been widely used to date:
| (1) |
where L, g, and R are luminosity, gravity and radius, respectively. The mass loss efficiency parameter , which was later introduced, has been reported to vary from 0.25 to 2 – 3 for metal-rich stars Dupree (1986); Kudritzki & Reimers (1978); Renzini (1981). In contrast, the estimated range of for metal-poor stars appeared to be narrow, as most studies on metal-poor stars suggest = 0.3 – 0.7 Aaronson & Mould (1982); Mould & Aaronson (1982); Renzini (1981); Lee et al. (1994), and these values successfully reproduce the horizontal branch morphology of the old Galactic globular clusters Yi et al. (1999). While the application of Reimers’ formula for low mass stars predicts that the total amount of mass loss gets smaller as mass increases, it is not clearly demonstrated how the amount of mass loss depends on the mass of the stars in intermediate-age clusters (Tripicco, Dorman & Bell 1993; Liebert, Saffer & Green 1994; Carraro et al. 1996).
In this context, we started a project to investigate several aspects in the evolution of intermediate-age, metal-poor stellar populations, in particular, the amount of OS and the mass loss characteristics. To reach this goal, we observed three intermediate-age clusters using the Very Large Telescope (VLT) under excellent seeing conditions. The project and the observations are presented in Gallart et al. (2002; Paper I). In the current paper, we will compare the observations with the recent set of Yonsei-Yale () stellar evolutionary models, and with models specifically calculated for this project using the same main input physics (but differing in the OS parameter), to constrain the amount of OS and the mass loss.
The three clusters under the study seem to present the signature of a core contraction gap in their TO region, which is predicted by the models as well for this age range. A possible obstacle in studies of OS using the shape of the core contraction gap is binary contamination. Castellani, Degl’Innocenti & Marconi (1999) pointed out that the contraction gap enhanced by core OS can be filled in by unresolved binary stars. In fact, some intermediate-age clusters, which are expected to have a core contraction gap, show a continuous sequence rather than a distinctive gap (Carraro et al. 1994; Paper I). Although this could be considered as a limiting factor for the topology method, we will show that it is possible, using synthetic CMDs, to put some constraints on the binary star population. It may be also expected that an increase of binary fraction in synthetic CMD simulations tends to decrease the value of OS required for a good fit. Testa et al. (1999) have claimed that a no-OS model with of unresolved binaries allows a fair fit to the observed MS luminosity function of NGC 1866 in the LMC, while Barmina et al. (2002), using a revised analysis of the same data, have concluded that the inclusion of unresolved binaries would not alter the need for OS (see also for other clusters, Vallenari et al. 1992; Carraro et al. 1994)
In this paper, we present a short description of the observational data (§ 2). Stellar models including OS treatment and synthetic CMD simulations are described in section 3. Detailed analysis on the steps of deriving ages, binary fraction, the amount of OS and mass loss is described in section 4, followed by a short discussion (§ 5) and conclusions (§ 6).
2 THE DATA
The three LMC clusters NGC 2173, SL 556 and NGC 2155 were observed with FORS1 at VLT-UT1, in service mode, through the filters and , under excellent seeing conditions. PSF fitting photometry was obtained with the suite of programs DAOPHOTII/ALLSTAR/ALLFRAME (Stetson 1987, 1994), and calibrated using data of the same clusters obtained under photometric conditions using the MOSAIC camera at the CTIO-4m telescope. We estimate an accuracy of the zero points of the photometric transformation of 0.005. An assessment of the completeness and error characteristics of the data was performed through artificial star tests. Finally, we carefully subtracted the LMC field stars in the cluster field in a statistical fashion. All these aspects of the data treatment are discussed in detail in Paper I. In the following sections we will just use the photometrically calibrated, field-subtracted CMDs, and the results of the artificial star tests for completeness and errors.
3 MODELS
3.1 Stellar tracks & isochrones
We have constructed stellar tracks of metallicity and with the Yale stellar evolution code YREC (Guenther et al. 1992), ignoring the effects of rotation. All input physics and model construction assumptions are the same as in the Isochrones (Yi et al. 2001) except for the OS treatment. Three sets of tracks have been generated depending on the amount of core OS. The OS parameter is defined as a fraction of the pressure scale height at the edge of a convective core and prescribes the radial size of the OS region beyond the classical core convection boundary. We used 10, 20 and 30% of the local pressure scale height as the amount of OS, corresponding to “OS parameter” values of 0.1, 0.2 and 0.3, respectively.
From these tracks, we have constructed isochrones between 1 and 3 Gyr, with an interval in age of 0.1 Gyr. Color transformations are based on Lejeune, Cuisinier & Buser (1998), following the scheme. It is generally found that a convective core develops when the stellar mass is larger than , a result known to depend on chemical composition. For isochrones, Yi et al. (2001) have adopted OS = 0.2 for young isochrones ( 3 Gyr) and OS = 0.0 for old ones ( Gyr) based on the observational studies of approximately solar abundance populations. Their isochrones have a 1 Gyr age grid for ages greater than 1 Gyr and do not provide the isochrones of ages greater than 2 Gyr but smaller than 3 Gyr. This is inconvenient to our study because our sample clusters appear to be in this age range. Besides, the Isochrones group does not recommend any simplistic isochrone interpolation for the age range of 2 to 3 Gyr because it is in this age range that the transition between convective core and radiative core in the MS TO stars occurs (see also Woo & Demarque 2001). For this reason, we have computed a new Isochrones in which the OS parameter has been kept constant for ages between 1 and 3 Gyr. Figure 1 illustrates the isochrones of two different OS parameters. Models with larger OS show brighter TOs and subgiant branches for each given age, implying that an age estimate for an observed CMD would be larger when using isochrones with larger OS.
3.2 Synthetic CMD code
Stellar mass is the fundamental parameter that determines the evolutionary path of each star in the CMD. By randomly distributing stellar mass with an initial mass function (IMF), and tracing each star’s evolutionary stage at a given time, one can construct synthetic CMDs for stellar systems with single age and metallicity. These simple stellar populations are relatively easy to model due to the simplifying assumption of instantaneous star formation rate and homogeneous chemical composition.
Several kinds of uncertainties still remain in computing synthetic CMDs for simple stellar populations. The first kind, which affects each star’s location on the CMD, comes from uncertainties in stellar evolutionary theory and stellar atmosphere models. Secondly, uncertainties in the number of stars in each location on the CMD come from the combinations of uncertainties in the evolutionary time scale of each stage, the slope of the IMF, and stochastic effects caused by small number statistics. Many CMD studies have aimed at testing physical parameters in stellar evolutionary theory by comparing theoretical shape and star counts with the observations while minimizing uncertainties from other sources. Depending on the nature of the targets and on the methods used in the analysis, these uncertainties can be minimized with rigorous effort. For example, plausible stochastic effects in number ratio analysis can be avoided by repeating the simulations and using large enough areas in the CMD to count stars in observed and synthetic CMDs.
A new CMD synthesis code has been created, including binary simulation, based on previous works (Woo 1998; Yi et al. 1999). For MS to RGB stars, Salpeter’s IMF with x = 1.35 has been used. For synthetic horizontal-branch construction, we have used the core helium-burning stellar models of Yi, Demarque & Kim (1997) with Lee, Demarque & Zinn (1990)’s prescription for mass distribution. Mass loss along the RGB is formally calculated with Reimers’ (1975) formula, and subtracted at the RGB tip to derive the mass of core helium burning stars. However, for this particular study, the amount of mass loss is empirically determined to reproduce the observed luminosity of the red clump.
Unresolved binary stars make a distinct sequence in the observed CMDs. It is critical to include binary stars for a detailed study of the CMD. We define the binary fraction (BF) as the number ratio of unresolved binary stars to the total number of stars in the CMD. The binary stars in the CMD are simulated in the following way. Once stellar mass is distributed according to the stellar IMF, some stars are randomly selected to be given a secondary star. The mass of the secondary star is assigned using the critical mass ratio, that sets the minimum mass ratio between secondary and primary:
| (2) |
where is the primary star mass, and RAN is a random number with a flat distribution between 0 and 1. Such a flat distribution for the mass function of the secondary stars and a typical value of =0.7 is adopted following Elson et al. (1998; see also Hurley & Tout 1999). Secondary stars with masses would form a sequence indistinguishable from that of single stars. The BF that we will quote throughout the paper will be, therefore, the fraction of binary stars with , and a larger total BF should be expected.
Once the mass of the secondary star is determined, then the magnitudes (pr) and (se) of the primary and secondary, respectively, are combined to calculate the magnitude (BI) for the unresolved binary system:
| (3) |
3.3 Error & completeness simulation
The simulation of the observational errors (photometric shifts and completeness) in the synthetic CMDs has been performed on a star-by-star basis, using an empirical approach without any assumption on the nature of the errors or their propagation. The whole process has been performed in a way similar to that described in Aparicio & Gallart (1995) and Gallart et al. (1996a,b), and it is based on the results of the artificial star tests discussed in Paper I.
We have derived two tables from the artificial star tests. In the first one, the completeness information for each V, R magnitude interval is recorded. In the second table, for each artificial star that was recovered under the same quality criteria as the cluster data, the input and output magnitudes are listed. From this information, the simulation process for photometric errors and completeness in the synthetic CMD is the following: for each star in the synthetic CMD, with magnitudes , , we first use the completeness information in the corresponding magnitude interval to determine the probability of the star having been lost in the photometry, and keep it or remove it from the list of synthetic stars according to that probability. In a second step, for each synthetic star that has been kept, we select all artificial stars within a given distance in color and magnitude from the synthetic star. One of these stars is then picked up at random, and its and , calculated as the differences between the recovered and injected magnitudes for that star, are added to the magnitudes , in order to simulate the observational errors.
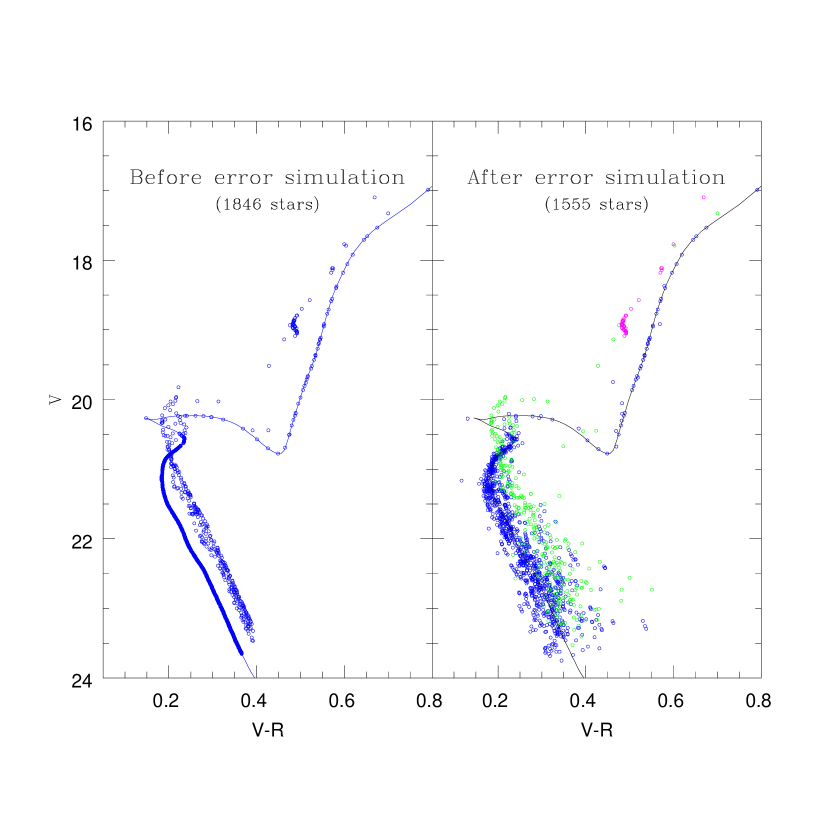
In Figure 2, synthetic CMDs before and after error simulations are compared as an example. In the left panel, single stars are placed on top of a given isochrone while the binary sequence has a dispersion according to the range of the mass ratio q (). The error simulated CMD in the right panel shows many scattered stars in the CMD due to the photometric errors especially at faint magnitude levels. The result of the completeness simulation is that, globally, 10 to 15% of the total input stars are lost in the error simulated CMD.
4 Analysis: overshoot and mass loss
In this section, we compare the CMDs of the three LMC clusters, NGC 2173, SL 556 and NGC 2155, with isochrones and synthetic CMDs, in order to test the predictions of stellar evolution theory under different sets of assumed parameters regarding OS and mass loss. This will allow us not only to derive the cluster parameters (ages, metallicity, distance, and reddening) but also to constrain the input parameters in stellar model calculations (e.g., OS and mass loss).
4.1 The amount of overshoot in low-metallicity, intermediate-age populations
Cluster CMDs provide a powerful tool for deriving the OS parameter empirically. We have applied the following strategy on our sample clusters. First, we used the color difference (V-R) between the base of the RGB and the TO to constrain the age range for each cluster under each OS assumption (Sarajedini & Demarque 1990). This has been complemented with visual isochrone fitting within that age range, to obtain a single best fitting age for each OS parameter. Second, since the presence of unresolved binary stars substantially affects the morphology of the TO and core contraction gap in the CMD, we attempt to find the BF using the ratio of the number of stars in two boxes around and below the core contraction gap. The last step takes advantage of the different spread in color near the core contraction gap depending on the assumed OS, to single out the best OS, and consequently, the best age for the cluster. Binary stars have substantial effects on the morphology of the TO and the core contraction gap, however, we will show that they do not greatly affect the color distribution of the stars, and therefore, the final conclusion on the best fitting OS parameter is almost independent of the assumed BF. These steps are explained in detail in the following three sections.
4.1.1 Isochrone solutions
The major effect of core OS to stellar evolution is to supply hydrogen fuel from the OS-induced mixing region to the core, which lengthens the hydrogen core burning phase. This results in a brighter TO and subgiant branch since for a given age, more massive stars are going through the core contraction phase. Consequently, if the amount of OS assumed in the models is larger, an older age will be derived for a given observed CMD. Therefore, the OS parameter cannot be uniquely determined without an accurate age constraint and vice versa. Due to this degeneracy, we determined the best age for each OS parameter in the following steps.
As the TO gets redder with increasing age, the color difference, (V-R) between the base of the RGB and the TO decreases. For a given age, a larger OS implies an increase of (V-R) since more massive stars are located near the TO (Figure 3). Thus, for each OS parameter, an age can be estimated from the observed (V-R) value. However, due to the uncertainties in determining the locations of the base of RGB and the TO in the observed CMD, this step only gives a plausible range of age for each OS. A typical error, 0.02 in (V-R) gives age uncertainty 0.3 Gyr.
Within the age range, we have performed isochrone fitting to find the best fitting age. In this step, two further parameters are required: distance modulus and interstellar reddening. The distance modulus of the LMC is usually taken to be 18.5 0.1, which is consistent with the recent compilation of Benedict et al. (2002). However, there is still some disagreement on the LMC distance modulus among experts in the field, and values ranging from 18.3 to 18.7 have been advanced. In addition, the LMC has a large angular distribution of clusters in the sky, among which the distance modulus may differ. For example, if we consider that the line of sight depth of the LMC is of the order of the LMC bar size, 3 degree ( 2.6 kpc), the distance modulus can easily differ by up to 0.1 magnitude. Currently, the distance to individual clusters is unknown.
A mean reddening of E(B-V)0.1 [E(V-R)= 0.08] or larger is tipically found for the LMC (Harris, Zaritsky, & Thompson 1997, and references therein). Most of these studies, however, focus on the central part of the LMC, or on regions containing young stars. Therefore, presumably, a larger amount of dust is present in these regions than in more external LMC regions, as is the case of the clusters in our study. Schlegel, Finkbeiner, & Davis (1998) calculate typical reddenings toward the LMC from the median dust emission in surrounding anuli, and find E(B-V)=0.075 (E(V-R)=0.06)), which should be close to the reddening found in the outer part of the LMC where internal extiction may be very low. No estimates of individual reddenings toward the clusters in our study are available.
Given these uncertainties, we performed isochrone fitting with limited freedom of distance modulus and reddening. We did not use a fiducial line obtained from the CMD in the fitting process since a fiducial line is difficult to determine around the convective core contraction gap, and binary stars can influence the fiducial line position. Since field star subtraction is not perfect, we rather put more weight on the isochrone shape near the TO and upper MS, which are relatively well populated.
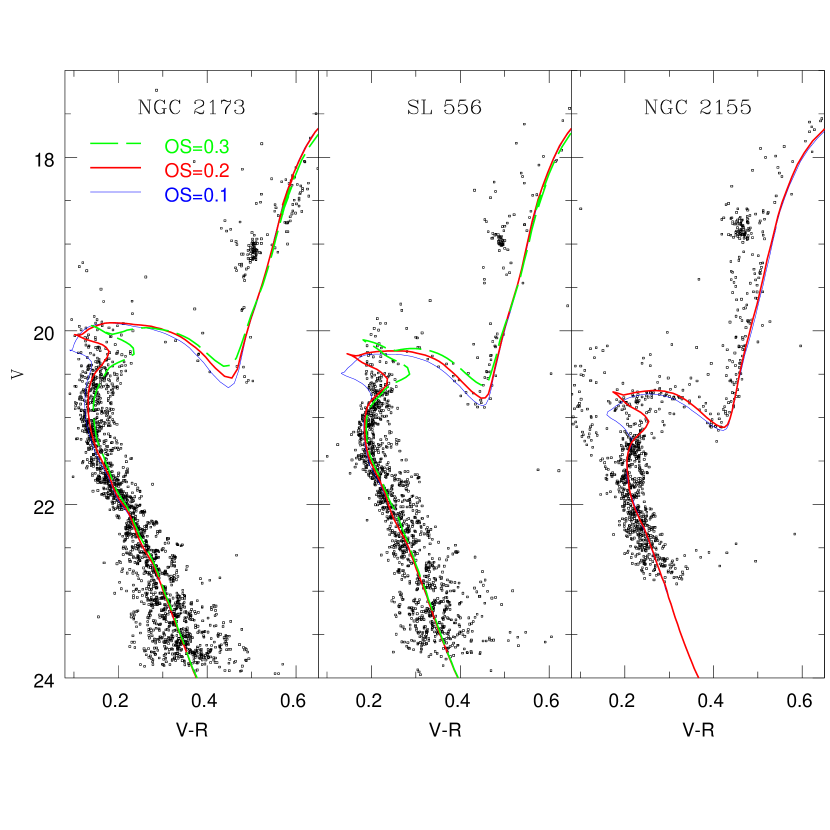
With isochrone fitting, we single out the cluster age for each OS parameter, which is also complemented by comparing the observed CMD with the synthetic CMD simulated with each set of age and OS (Table 1). The true metallicities of our sample clusters are still poorly known but often suggested to be in the range Z=0.004 – 0.007 (Paper 1). We prefer to use a single value of metallicity for all three clusters in order to investigate systematic effects. Metallicity Z=0.007 seems to be inadequate as a representative value because the Z=0.007 isochrones do not yield reasonable matches (MS and RGB location, TO shape, and core contraction gap) to all three cluster CMDs due to the redder RGB. Therefore, we exclude the Z=0.007 solutions and only use Z=0.004 solutions for further analysis. However, it should be noted that NGC 2173 might be more metal-poor than Z=0.004 (Paper 1). For NGC 2155, OS=0.3 isochrones produce very poor matches to the observed CMDs and thus are excluded in the further analysis of this study. The final isochrone solutions are plotted with the observed CMD of each cluster (Figure 4). Note that the shapes of all three isochrones for each cluster are very similar except for the core contraction gap.
4.1.2 Unresolved binary stars
i) The effect of binaries and overshoot on the shape of the gap
The effects of unresolved binary stars require special attention in cluster CMD studies since the binary sequence modifies the distribution of stars from the expected single star sequence. This contamination effect on the TO topology is more profound to intermediate-age clusters than to much younger or much older clusters since the core contraction gap is prominent only in intermediate-age clusters. We have performed CMD synthesis including binary stars in order to investigate how they affect the distribution of stars around the convective core contraction gap. For this test, we selected isochrone solutions of SL 556 with various BFs (0 to 30%).
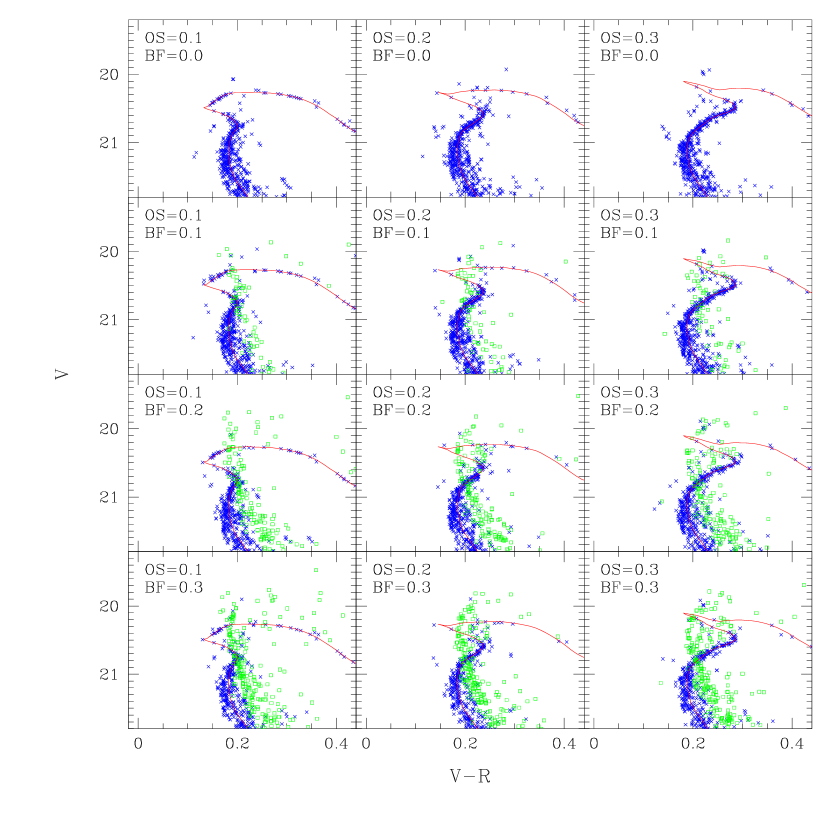
Figure 5 shows how the shape of the CMD around the gap is affected by binaries and OS. For a given BF, larger OS results in a longer MS extending further toward the red due to the delayed core contraction phase. Consequently, the color distribution becomes much broader around the gap. Also, since the evolutionary time scale after core contraction phase is much faster with larger OS, the subgiant branch is less populous with increasing OS. For a given OS parameter, more stars are located around the gap with increasing BF. Binary stars make a rounded sequence, which resembles the shape of the single star sequence near the TO, which is 0.75 magnitude fainter. The stars above the gap are most likely binaries since single stars cannot be located above the gap even with much larger OS.
Binaries fill in the core contraction gap, which causes visual confusion near the TO and makes the derivations of age and OS parameter difficult. However, their sequence can still be differentiated from that of single stars using a detailed TO topology comparison. Furthermore, the number of stars above the core contraction gap, which are most likely unresolved binaries according to our analysis, can constrain the BF.
ii) Constraining the binary fraction
The binary frequency in a cluster CMD can be determined by artificial star tests using a binary sequence parallel to the MS (Rubenstein & Bailyn 1997). However, this method is time-consuming and still has a large uncertainty in estimating the BF. For our clusters, which are of intermediate-age and expected to display a core contraction gap, the distribution of stars around the core contraction gap can be utilized for estimating the BF.
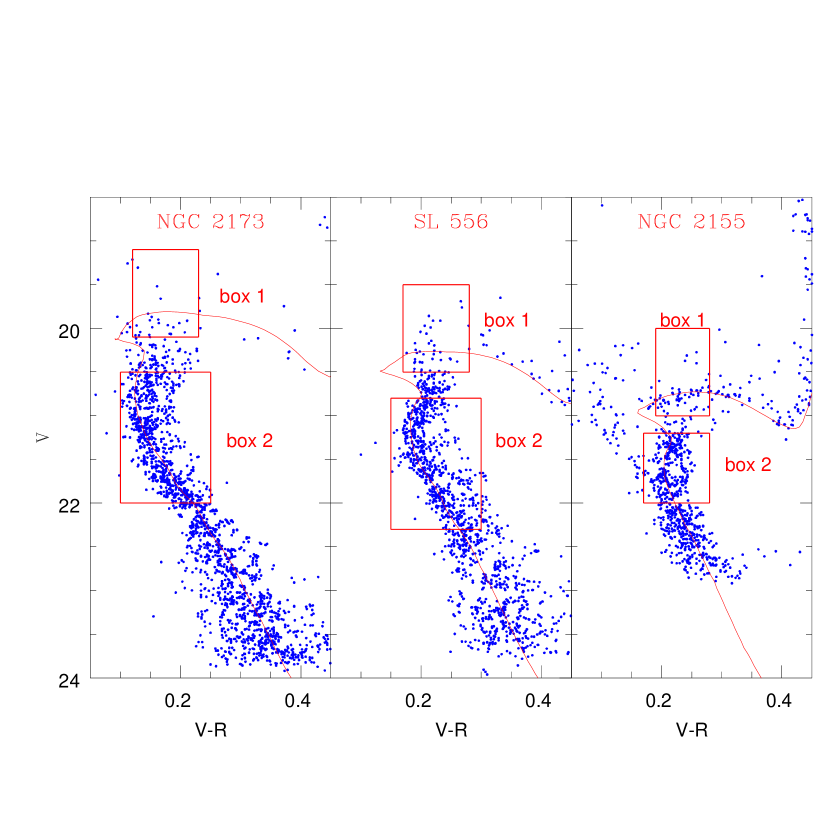
We estimate the BF using the number ratio of the stars above the core contraction gap to the stars in the upper MS, respectively counted in two boxes in the CMD (Figure 6). The location of Box 1 is carefully selected to contain mostly binary stars and some subgiant stars (although for the oldest cluster NGC 2155 the number of subgiant stars increases). As mentioned in the previous section, we have compared a synthetic CMD without binaries to a CMD with 30% binaries, and determined the best location for the binary star box (Box 1). The location of Box 2 is selected to cover the TO region including a large fraction of MS stars and some binaries. If the total number of stars is fixed, a larger value of BF naturally results in an increase in number of stars in Box 1, while the number of stars in Box 2 is not significantly affected by the BF. Therefore, the number ratio of Box 1 to Box 2 can be a good indicator of the BF in the observed CMD.
The number ratio of stars in these two boxes for each cluster is shown in Figure 7 with a solid line. The uncertainties of the number ratios in the observed CMDs are estimated from the field star decontamination process and shown with dashed lines. In spite of the same box size, the observed number ratio of SL 556 is much greater than that of NGC 2173, which indicates a larger BF in SL 556. This result is consistent with the presence of a clear binary sequence parallel to the MS in the CMD of SL 556. In case of NGC 2155, a direct comparison with the other clusters is not possible since a Box 2 of much smaller size has been used due to the brighter limiting magnitude.
We have performed 10 Monte Carlo simulations for each given BF and averaged the number of stars in each box. Dots in Figure 7 show the mean number ratio of the two boxes in the synthetic CMDs, with error bars indicating 1 dispersion. Simulations show a general trend of the binary effect on the number ratio, which increases with increasing BF as expected. According to our simulations, the number ratio varies slightly with different box locations and sizes, however, the trend appears to remain the same if we keep the same boxes in the observed CMD and the synthetic CMD. A comparison between the number ratios from the empirical data and from the simulations suggests 10-20% of unresolved binaries (with , the BF could be larger for any ) are required for all three clusters. These estimates are similar to those of Elson et al. (1998) for the LMC cluster NGC 1818 and of Rubenstein & Bailyn (1997) for the Galactic globular cluster NGC 6752.
4.1.3 Overshoot from the color distribution around the core contraction gap
As mentioned in § 3.1, the empirical TO morphology may constrain the amount of OS and find the most probable isochrone solution in Table 1 and Figure 4. For a quantitative analysis, we have drawn Box 3 around the core contraction gap and analyzed the color distribution of stars in the box. The location of the box for each cluster, which contains most stars in core contraction phase, is shown in Figure 8.
For all synthetic CMD models with each isochrone solution (OS and age), the color distributions of stars in Box 3 are plotted in Figure 9. Each panel contains the distribution of stars from the observed CMD (histogram) and from simulations with various values of BF (10%-30%), which are suggested in the previous section. Note that once scaled to the total number of stars in Box 3, the color distribution is almost independent of BF, while OS affects the color distribution significantly. In general, the distribution is broadened and shifted to the red with increasing OS.
The best fits for NGC 2173 and SL 556 are models with OS=0.2, as clearly indicated by the median of the distribution. The various BF does not significantly affect the color distribution and, thus, OS estimation. The best OS value for NGC 2155, which is older than the other clusters, seems to lie between 0.1 and 0.2. We conclude that for all 3 LMC clusters the OS parameter is around 0.2. The fact that OS seems to be between 0.1 and 0.2 for NGC 2155 may indicate that OS slightly decreases with cluster age. A larger number of clusters in this age range would be necessary to confirm the trend.
4.2 Mass loss and the location of the red clump
The distinct feature of the red clump (RC) stars in the CMDs of intermediate-age clusters deserves considerable attention for its potential use as a distance indicator. However, it can be useful only when its characteristics (i.e., luminosity dependence on age and metallicity) are properly understood (Girardi & Salaris 2001; Grocholski & Sarajedini 2002).
An age dependence of the RC luminosity is naturally expected for the younger clusters with TO mass , for which helium ignites in a non-degenerate core, since the core mass of helium burning stars increases as the age of a cluster is decreasing. In contrast, in the case of stars undergoing the He-flash, the degenerate core mass is nearly constant and independent of age, but the envelope mass can play a role in controlling the RC luminosity since the energy output from the hydrogen burning shell is decreasing with a smaller envelope mass. Thus, if mass loss during the RGB phase depends on age, there can be an age dependence in the RC luminosity of intermediate-age clusters.
In this section, we derive and discuss mass loss for each cluster using an empirically obtained relation between RC luminosity and RC mass. First, we have performed synthetic CMD simulations, using He-burning tracks (Yi et al. 1997), and measured the RC luminosity, , as a function of the mean RC mass (Figure 10 top panel). It is shown that the median RC magnitude increases with larger RC mass, which is a generic feature of He-burning stellar tracks at this mass range (Vandenberg 1985; Seidel, Demarque & Weinberg 1987). Second, RC mass for each observed CMD is empirically derived from this luminosity–mass relation (points in Figure 10 top panel). The observed RC magnitude is converted to with the distance modulus, and a typical error (0.1 mag.) is assumed considering the uncertainties in distance modulus. It is interesting to note that NGC 2173 and SL 556 have a fainter RC magnitude than the older cluster NGC 2155, which is also shown in Figure 4, and consequently a smaller mean RC mass is inferred. Third, the amount of mass loss along the RGB has been estimated by subtracting the mean RC mass from the RGB tip mass of each isochrone. The mass loss errors are calculated from the assumed uncertainties in the RC magnitude.
We note that the estimated mass loss value for NGC 2155 is similar to that obtained using mass loss efficiency, = 0.5 - 0.7 in Reimers’ formula, which successfully reproduces the horizontal branch morphology in old globular clusters Yi et al. (1999). However, the mass loss derived for SL 556 is too large to be compatible with = 0.5 - 0.7 and may indicate a much higher mass loss efficiency in the context of Reimers’ formula. To illustrate this, we derived RC luminosity, , for clusters with various age assuming a fixed mass loss value, 0.2 and 0.6 , respectively (Figure 10 bottom panel).
The origin of such a large estimate of mass loss in SSL 556 and disagreement with =0.5-0.7 remains unclear to us and may have an important implication on the uncertainty/variability of the mass loss efficiency even in similar environments. The validity of mass loss estimates are subject to the uncertainties in distance modulus, age and metallicity although the color difference between the TO and the RGB is clear enough to indicate a reasonably accurate age estimate and the assumed metallicity provides a good match on the RGB slope. Further investigations are essential to draw more confident conclusions, especially with a better distance modulus constraint.
In the case of NGC 2173, it is unclear whether the RC stars experienced He-flash since the RGB tip mass of this cluster lies near the critical mass at which stars develop a degenerate core, although it is known that the critical mass becomes smaller with increasing OS (Chiosi et al. 1989). If not, then the lower RC luminosity of NGC 2173 may result from the fact that RC luminosity decreases as RGB tip mass becomes much larger than 1.5 (see Girardi, Mermilliod & Carraro 2000). However, this cannot be the case for SL 556 and NGC 2155 since their RGB tip mass is similar or less than .
5 Discussion: Age gap among LMC clusters
Jensen, Mould & Reid (1988) first noticed a gap in the age distribution of LMC clusters, with none of them with ages between 4 and 10 Gyr. This age gap would be present also in metallicity, with younger LMC clusters having [Fe/H] and older ones having [Fe/H] (Olszewski et al. 1991). Geisler et al. (1997) performed a survey of candidate old clusters and confirm the existence of a gap in the LMC cluster formation, which they situate similarly between 3 and 8 Gyr ago. Shortly after, Sarajedini (1998) claimed to have found three 4 Gyr old LMC clusters, namely NGC 2155, SL 556 and NGC 2121, which would be in the age gap. With deeper observations, Rich, Shara & Zurek (2001) have estimated the age of these clusters to be 3.2 Gyr old, and claimed that they are probably the first clusters to have formed in the younger group of the LMC clusters. Our age estimate of NGC 2155 is slightly younger (by Gyr) but consistent with that of Rich et al. (2001), supporting the extension of the LMC age gap up to 3 Gyr on its intermediate-age side.
6 Conclusion
In this paper, we have performed detailed synthetic CMD simulations on the effect of OS and binary stars, compared with observed CMDs of three LMC clusters, NGC 2173, SL 556, and NGC 2155. Unresolved binary stars fill in the core contraction gap and make a unique sequence near the gap, which cannot be reproduced by single stars alone, even with a larger OS amount. We utilize the number ratios of stars around the core contraction gap to derive a first order estimate of the BF. Based on our star count analysis, all three clusters have a BF of 10% to 20% (with ).
Using the color distribution of stars around the core contraction gap, which does not significantly depend on the BF, we find that the best OS parameter for each cluster is close to 20% of the local pressure scale height.
With the best solutions of the BF and OS from star count and color distribution analysis, we present synthetic CMDs for each cluster with the observed CMD in Figure 11, 12, and 13, respectively.
From the overall analysis, such as isochrone fitting, star counts, color distributions, and synthetic CMD comparison, we conclude that a moderate amount of OS, of the local pressure scale height, is essential to reproduce the observed shape around the core contraction gap in the CMDs of all three clusters, which are more metal-poor than the intermediate-age open clusters observed in the Galaxy, implying OS does not depend on metallicity at least for this metallicity range. With OS=0.2, our best age estimates are 1.5, 2.1 and 2.9 Gyr for NGC 2173, SL 556 and NGC 2155, respectively.
We constrainted mass loss along the RGB phase from the observed RC luminosity of each cluster, utilizing the RC luminosity – mass relation derived from synthetic CMDs. We found that the mas loss estimate for NGC 2155 is consistent with the typical mass loss parameterization that works for the Galactic globular clusters. However, the SL 556 data, and perhaps the data for the other young cluster NGC 2173 as well, indicate a substantially larger amount of mass loss than suggested by Reimers’ formula. This may indicate once again the complexity of mass loss processes.
References
- Aaronson & Mould (1982) Aaronson, M., & Mould, J. 1982, ApJS, 48, 161
- Aparicio (1995) Aparicio, A. & Gallart, C. 1995, AJ, 110, 212
- (3) Barmina, R., Girardi, L., & Chiosi, C. 2002, A&A, 385, 847
- benedict (2002) Benedict, G. F. et al. 2002, AJ, 123, 473
- Bertelli (1985) Bertelli, G., Bressan, A.G. & Chiosi, C. 1985, A&A, 150, 33
- bressan (1981) Bressan, A.G., Chiosi, C. & Bertelli, G. 1981, A&A, 102, 25
- Bcp (1994) Brocato, E., Castellani, V. & Piersimoni A.M. 1994, A&A, 290, 59
- Carraro et al. (1993) Carraro, G., Bertelli, G, Bressan & Chiosi, C. 1993, A&AS, 101, 381
- Carraro et al. (1994) Carraro, G., Chiosi, C., Bressan & Bertelli, G. 1994, A&AS, 103, 375
- Carraro et al. (1996) Carraro, G., Girardi, L., Bressan, A., & Chiosi, C. 1996, A&A, 305, 849
- (11) Castellani, V., Degl’Innocenti, S. & Marconi, M. 1999, MNRAS, 303, 265
- Chiosi et al. (1989) Chiosi, C., Bertelli, G., Meylan, G & Ortolani, S. 1989, A&A 219, 167
- Chiosi et al. (1995) Chiosi, C., Vallenari, A., Bressan, A., Deng, L. & Ortolani, S. 1995, A&A, 293, 710
- Daniel et al. (1994) Daniel, S. A., Latham, D. W., Mathieu, R. D., & Twarog, B. A. 1994, PASP, 106, 281
- Demarque et al. (1994) Demarque, P., Sarajedini, A., & Guo, X.-J. 1994, ApJ, 426, 165
- Dupree (1986) Dupree, A. K. 1986, ARA&A, 24, 377
- (17) Elson, R.A.W., Sigurdsson, S., Davies, M., Hurley, J. & Gilmore, G. 1998, MNRAS, 300, 857
- Gallart (1996a) Gallart, C., Aparicio, A., Vilchez, J.M. 1996a, AJ, 112, 1928
- Gallart (1996b) Gallart, C., Aparicio, A., Bertelli, G., Chiosi, C. 1996b, AJ, 112, 1950
- Gallart (2002) Gallart, C. et al. 2002, AJ, submitted (Paper I)
- Geisler et al. (1997) Geisler, D., Bica, E., Dottori, H., Claria, J.J., Piatti, A.E. & Santos, J.F.C. Jr. 1997, AJ, 114, 1920
- Girardi (1999) Girardi, L. 1999, MNRAS, 308, 818
- Girardi et al. (2000) Girardi, L., Mermilliod, J.-C. & Carraro, G. 2000, A&A, 354, 892
- Girardi et al. (2001) Girardi, L. & Salaris, M. 2001, MNRAS, 323, 109
- (25) Grocholski, A. J., & Sarajedini, A. 2002, AJ, 123, 1603
- (26) Guenther, D. B., Demarque, P., Kim, Y.-C. & Pinsonneault, M. H. 1992, ApJ, 387, 372
- (27) Guinan, E. F., Ribas, I., Fitzpatrick, E. L., Giménez, Á., Jordi, C., McCook G., & Popper, D. M. 2000, AJ, 544, 409
- (28) Harris, J., Zaritsky, D. & Thompson, I. 1997, AJ, 114, 1933
- (29) Hurley, J. & Tout, C. A., MNRAS, 1999, 300, 977
- Jensen et al. (1988) Jensen, J., Mould, N. & Reid, N. 1988, ApJS, 67, 77
- Keller et al. (2001) Keller, S. C., Da Costa, G. S., & Bessell, M. S. 2001, AJ, 121, 905
- Kozhurina-Platais et al. (1997) Kozhurina-Platais, V., Demarque, P., Platais, I., Orosz, J. A. & Barnes, S. 1997, AJ, 113, 1045
- Kudritzki & Reimers (1978) Kudritzki, R. P., & Reimers, D. 1978, A&A, 70, 227
- Lattanzio (1991) Lattanzio, J.C., Vallenari, A., Bertelli, G., & Chiosi, C. 1991, A&A, 250, 340
- Lejeune (1998) Lejeune, Th., Cuisinier, F., & Buser, R. 1998, A&A, 130, 65
- Lee (1990) Lee, Y.-W., Demarque, P., & Zinn, R. 1990, ApJ, 350, 155
- Lee et al. (1994) Lee, Y.-W., Demarque, P., & Zinn, R. 1994, ApJ, 423, 248
- Liebert et al. (1994) Liebert, J., Saffer, R.A. & Green, E.M. 1994, AJ, 107, 1408
- Maeder & Mermilliod (1981) Maeder, A. & Mermilliod, J.-C. 1981, A&A, 93, 136
- Meynet et al. (1993) Meynet, G., Mermilliod, J.-C. & Maeder, A. 1993, A&AS, 98, 477
- Mould & Aaronson (1982) Mould, J., & Aaronson, M. 1982, ApJ, 263, 629
- (42) Olszewski, E.O., Schommer, R.A., Suntzeff, N.B. & Harris, H.C. 1991, AJ, 101, 515
- Prather & Demarque (1974) Prather, M.J. & Demarque, P. 1974, ApJ, 193, 109
- Reimers (1975) Reimers, D. 1975, Mém. Soc. Roy. Sci. Liège, 6th Ser., 8, 369
- Renzini (1981) Renzini, A. 1981, in Physical Processes in Red Giants, ed. I. Iben & A. Renzini (Dordrecht: Reidel), 431
- Ribas et al. (2000) Ribas, I., Jordi, C. & Giménez, Á. 2000, MNRAS, 318, L55
- Rich et al. (2001) Rich, R.M., Shara, M. & Zurek, D. 2001, AJ, 122, 842
- Rosvick & VandenBerg (1998) Rosvick, J.M. & VandenBerg, D.A. 1998, AJ, 115, 1516
- Rubenstein & Bailyn (1997) Rubenstein, E.P. & Bailyn, C.D. 1997, ApJ, 474, 701
- Sarajedini (1990) Sarajedini, A. & Demarque, P. 1990, ApJ, 365, 219
- Sarajedini (1998) Sarajedini, A. 1998, AJ, 116, 738
- Saslaw and Schwarzschild (1965) Saslaw, W.C. & Schwarzschild, M. 1965, ApJ, 142, 1468
- (53) Schroder, K.-P., Pols, O. R. & Eggleton, P. P. 1997, MNRAS, 285, 696
- Schwarzschild (1906) Schwarzschild, K. 1906, Göttingen Nach., 195, 41
- Seidel et al. (1987) Seidel, E., Demarque, P. & Weinberg, D. 1987, ApJS, 63, 917
- Shaviv (1973) Shaviv, G. & Salpeter, E. E. 1973, ApJ 184, 191
- Shlegel (1998) Schlegel, D.J., Finkbeiner, D.P. & Davis, M. ApJ, 1998, 500, 525
- Stetson (1987) Stetson, P. B. 1987, PASP, 99, 191
- Stetson (1994) Stetson, P. B. 1994, PASP, 106, 250
- Stothers (1991) Stothers, R. B. 1991, ApJ, 383, 820
- StothersChin (1992) Stothers, R.B. & Chin, C.-W. 1992, ApJ, 390, 136
- (62) Sweigart, A. V. & Gross, P. G. 1976, ApJS, 32, 367
- Testaetal (1999) Testa, V., Ferraro, F.R., Chieffi, A., Straniero, O., Limongi, M. & Fusi-Pecci, F. 1999, AJ, 118, 2839
- Tripicco et al. (1993) Tripicco, M.J., Dorman, B. & Bell, R.A. 1993, AJ, 106, 618
- Vallenari (1991) Vallenari, A., Chiosi, C., Bertelli, G., Meylan, G., & Ortolani, S. 1991, A&AS, 87, 517
- Vallenari (1992) Vallenari, A., et al. 1992, AJ, 104, 1100
- Vallenari (1994) Vallenari, A., Aparicio, A., Fagotto, F., & Chiosi, C. 1994, A&A, 284, 424
- van (1985) VandenBerg, D. A. 1985, ApJS, 58, 711
- Woo (1998) Woo, J.-H. 1998, M. Sc. thesis, Yonsei Univ.
- Woo, Demarque (2001) Woo, J.-H. & Demarque, P. 2001, AJ, 122, 1602
- Yi et al. (1997) Yi, S., Demarque, P., & Kim, Y.-C. 1997, ApJ, 482, 677
- Yi et al. (1999) Yi, S., Lee, Y.-W., Woo, J.-H., Park, J.-H., Demarque, P., & Oemler, Jr. A. 1999, ApJ, 513, 128
- Yi et al. (2001) Yi, S., Demarque, P., Kim, Y.-C., Lee, Y.-W., Ree, C. H., Lejeune, T., & Barnes, S. 2001, ApJS, 136, 417


| Object | Z | Overshoot | Age (Gyr) | E(V-R) | ||
|---|---|---|---|---|---|---|
| NGC 2173 | 0.004 | 0.1 | 1.3 | 1.751 | 0.06 | 18.5 |
| 0.2 | 1.5 | 1.695 | 0.06 | 18.5 | ||
| 0.3 | 1.8 | 1.630 | 0.06 | 18.5 | ||
| SL 556 | 0.004 | 0.1 | 1.9 | 1.556 | 0.06 | 18.4 |
| 0.2 | 2.1 | 1.520 | 0.06 | 18.4 | ||
| 0.3 | 2.4 | 1.485 | 0.06 | 18.4 | ||
| NGC 2155 | 0.004 | 0.1 | 2.7 | 1.396 | 0.03 | 18.5 |
| 0.2 | 2.9 | 1.377 | 0.03 | 18.5 |
| Object | RGB( | RC( | ML() | ML (=0.5-0.7) | |
|---|---|---|---|---|---|
| NGC 2155 | 0.2 | 1.377 | 1.262 | 0.115 0.152 | 0.13-0.18 |
| SL 556 | 0.4 | 1.520 | 0.937 | 0.583 0.167 | 0.11-0.16 |