Gas Kinematics and the Black Hole Mass at the Center of the Radio Galaxy NGC 433511affiliation: Based on observations with the NASA/ESA Hubble Space Telescope obtained at the Space Telescope Science Institute, which is operated by the Association of Universities for Research in Astronomy, Incorporated, under NASA contract NAS5-26555.
Abstract
We investigate the kinematics of the central gas disk of the radio-loud elliptical galaxy NGC 4335, derived from HST/STIS long-slit spectroscopic observations of H+[N II] along 3 parallel slit positions. The observed mean velocities are consistent with a rotating thin disk. We model the gas disk in the customary way, taking into account the combined potential of the galaxy and a putative black hole with mass , as well as the influence on the observed kinematics of the point spread function and finite slit width. This sets a 3 upper limit of on . The velocity dispersion at is in excess of that predicted by the thin rotating disk model. This does not invalidate the model, if the excess dispersion is caused by localized turbulent motion in addition to bulk circular rotation. However, if instead the dispersion is caused by the BH potential then the thin disk model provides an underestimate of . A BH mass is inferred by modeling the central gas dispersion as due to an isotropic spherical distribution of collisionless gas cloudlets. The stellar kinematics for NGC 4335 are derived from a ground-based (WHT/ISIS) long-slit observation along the galaxy major axis. A two-integral model of the stellar dynamics yields . However, there is reason to believe that this model overestimates .
Reported correlations between black hole mass and inner stellar velocity dispersion predict to be in NGC 4335. If our standard thin disk modeling of the gas kinematics is valid, then NGC 4335 has an unusually low for its velocity dispersion. If, on the other hand, this approach is flawed, and provides an underestimate of , then black hole masses for other galaxies derived from HST gas kinematics with the same assumptions should be treated with caution.
In general, a precise determination of the relation and its scatter will benefit from (i) joint measurements of from gas and stellar kinematics in the same galaxies and (ii) a better understanding of the physical origin of the excess velocity dispersion commonly observed in nuclear gas disks of elliptical galaxies.
1 Introduction
The Hubble Space Telescope has made it possible to measure the masses of black holes (BHs) in the centers of many nearby active and quiescent galaxies using stellar and/or gaseous kinematics (for reviews, see e.g., Richstone et al. 1998; van der Marel 1999; Ho 1999; de Zeeuw 2001; Kormendy & Gebhardt 2001). To date, BH masses have been measured in about 40 galaxies, both spirals and ellipticals, and this number continues to increase. The BH masses correlate loosely with host spheroid luminosity (Kormendy & Richstone 1995) and more tightly with inner stellar velocity dispersion (Gebhardt et al. 2000; Ferrarese & Merritt 2000).
Central emission-line gas is detected in virtually all nearby radio galaxies, defined here as galaxies which harbor kpc-scale radio-jets. The equivalent widths of the gas emission lines are generally much larger than those of the absorption lines in the integrated stellar light, so that measurement of the kinematics of nuclear emission-line gas is an efficient way to determine the central gravitational potential and BH mass (e.g., Harms et al. 1994; Ferrarese, Ford & Jaffe 1996; Macchetto et al. 1997; van der Marel & van den Bosch 1998; Ferrarese & Ford 1999; Verdoes Kleijn et al. 2000, hereafter VK00; Sarzi et al. 2001; Barth et al. 2001). A drawback of this approach is that the gas kinematics might be affected by non-gravitational motions. Nevertheless, using the gas kinematics to determine accurate BH masses is particularly interesting for radio galaxies because determining the BH mass and the properties of the gas disk can advance our understanding of radio-jet formation and evolution. In turn, the radio-jet offers an extra diagnostic of the BH accretion and immediate BH surroundings. Current questions include: what is the lower-limit to BH masses that can form kpc-scale jets? Is this lower-limit higher or lower than typical BH masses in spirals which (almost) never show kpc-scale jets? Is there a correlation between BH mass and jet properties, such as total power or jet velocity? For these and other reasons we are performing a systematic study of a complete sample of nearby radio galaxies with Fanaroff & Riley (1974) Type I radio jets, the ‘UGC FR-I sample’ (Verdoes Kleijn et al. 1999, hereafter VK99; Xu et al. 2000) using observations at multiple wavelengths. In particular, we have performed a STIS spectroscopic survey of the inner gas distributions to measure the kinematics and the physical state of the gas (Noel-Storr et al. 2002).
Here we concentrate on one galaxy from our sample, NGC 4335, which is a relatively unknown isolated giant elliptical (; Paturel et al. 1997) at 66 Mpc. The gas appears embedded in a well-defined dust disk (diameter ) and gas kinematics can be traced sufficiently far out along the three slits to allow detailed gas dynamical modeling. In addition we perform stellar dynamical modeling for NGC 4335 using the stellar kinematics derived from a WHT/ISIS long-slit observation.
The paper layout is as follows. Sections 2 and 3 present HST/WFPC2 broad- and narrowband imaging, HST/STIS gas emission-line spectroscopy and ground-based WHT/ISIS stellar absorption-line spectroscopy, including the basic data reduction and derivation of the gaseous and stellar kinematics. Section 4 describes the modeling of the gas disk flux distribution, the derivation of the stellar mass distribution and the fits to the observed gaseous kinematics to estimate the BH mass. Section 5 describes two-integral modeling of the WHT stellar kinematics to determine the stellar mass-to-light ratio and to constrain the BH mass independently. Section 6 discusses the implications of the BH mass measurements in NGC 4335 for our understanding of BH demography, and for the techniques used to measure black hole masses.
We adopt throughout this paper. This does not directly influence the data-model comparison for any of our models, but does set the length, mass and luminosity scales of the models in physical units. Specifically, distances, lengths and masses scale as , while mass-to-light ratios scale as .
2 Imaging
2.1 WFPC2 Setup and Data Reduction
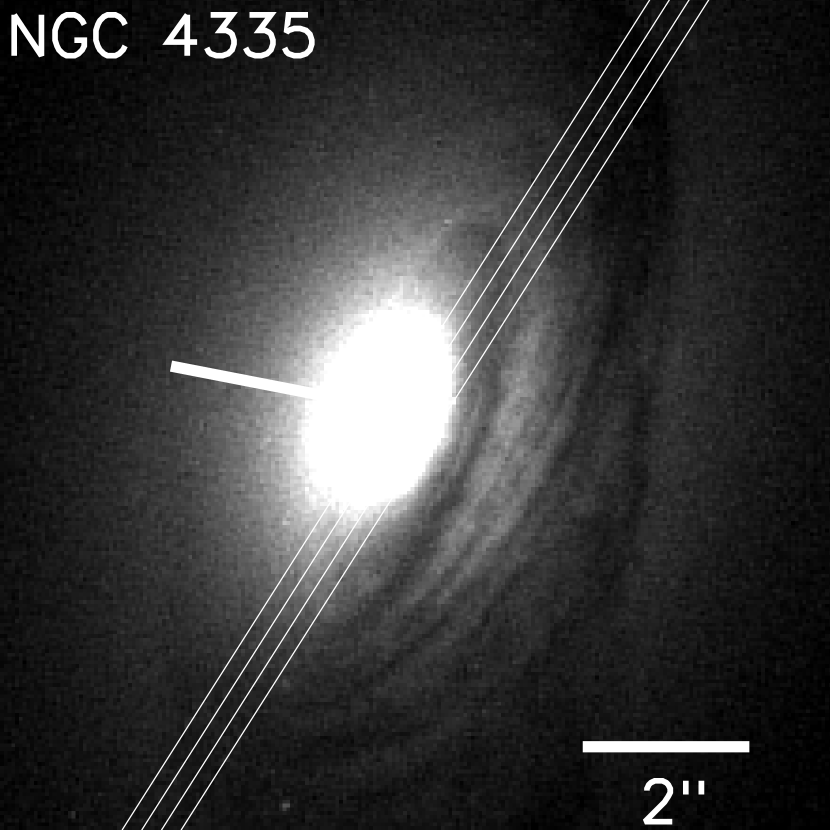
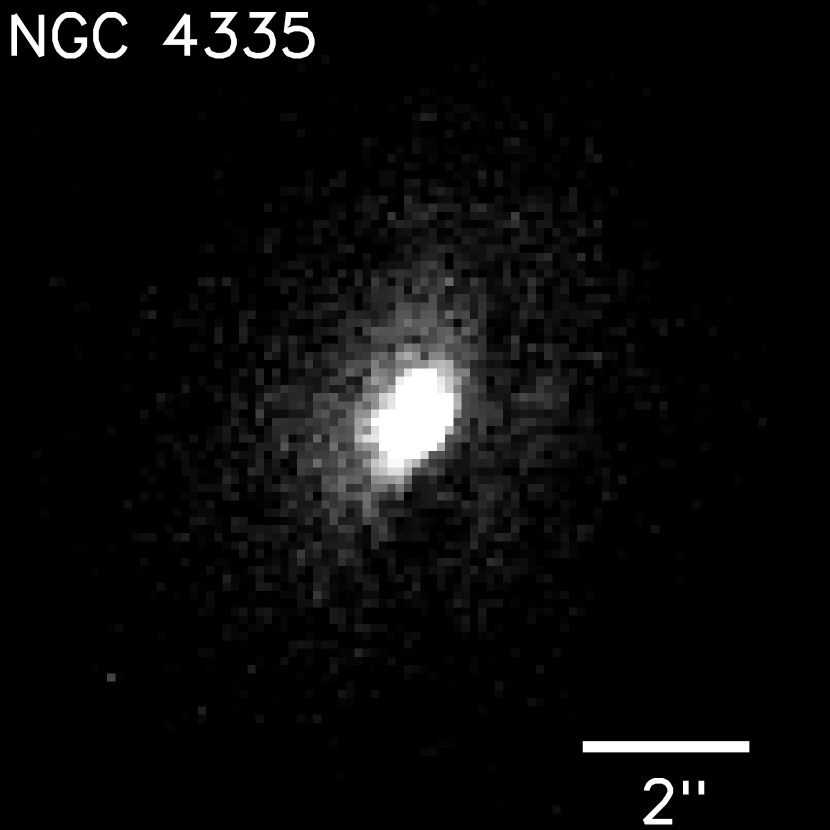
We imaged NGC 4335 in the context of HST program GO-6673. We used the WFPC2 instrument (described in, e.g., Trauger et al. 1994; Biretta et al. 1996) on March 15, 1997 to obtain images of NGC 4335 in the F555W () and F814W () filters and linear ramp filter FR680N which includes H+[N II]. The observing log is presented in Table 1. The ‘Linear Ramp Filters’ (LRFs) of the WFPC2 have a central wavelength that varies as a function of position on the detector. The LRF FR680N image (WF CCD) was used as ‘on-band’ image, with the galaxy position chosen so as to center the filter transmission on the H+[N II] emission lines. A combination of the broad-band images F555W and F814W (PC CCDs) was chosen as ‘off-band’ image and covers primarily stellar continuum. This combination of filters ensures that the effect of dust extinction is the same in the on- and off-band image. The final H+[N II] emission image was obtained by subtracting the stellar continuum, as determined by the off-band image, from the on-band image. The quality of the H+[N II] image is set by the Poisson noise of input images and the uncertainty in the alignment and scaling of the on-band image and off-band image. The stellar surface brightness is steeply rising at the center of NGC 4335. The resulting emission image depends quite sensitively on precise sub-pixel alignment and scaling. This introduces a flux error which is estimated by varying the alignment and scaling within a reasonable range. The -band and H+[N II] images are shown in Figure 1. Extended H+[N II] emission is present with a roughly elliptical morphology, elongated in the same direction as the dust disk. As described in Section 4.1, the emission-line gas is consistent with being in a thin disk, but the uncertainties involved in constructing the image are too large to prove this conclusively. We cannot rule out a more spheroidal distribution, especially towards the nucleus.
These data were presented previously in VK99, who also give a more detailed description of the data reduction.
2.2 The Dust Disk
The central dust detected in NGC 4335 extends to more than 2 kpc from the nucleus. In the outer regions ‘arms’ of dust gradually align with the well-defined central dust disk which appears as roughly half an ellipse on the west side of the nucleus (see Fig. 1). This is commonly seen in galaxies with inclined nuclear dust disks (e.g., NGC 7052, van der Marel & van den Bosch 1998; NGC 6251, Ferrarese & Ford 1999; 3C 449, Martel et al. 1999). On the east side no dust obscuration is evident in either the - or -band image and its color is typical for dust-free giant elliptical galaxies. We conclude that the eastern half of the dust disk produces negligible obscuration in the optical.
We fitted by eye an elliptical contour to the outline of the dust disk in the -band image, and measured the position angle of the major axis of the dust disk to be PA=. This is well-aligned with the galaxy major axis just outside the dust disk (cf. Fig. 1 and VK99). If we assume that the dust disk is thin and intrinsically circular, then the inclination is (VK99).
The total mass of the kpc-scale dust distribution estimated using the observed color excess is if the dust resides in the mid-plane of the galaxy (VK99). Following the prescription by Goudfrooij & de Jong (1994), the IRAS and flux measurements for NGC 4335 from Knapp et al. (1989) indicate a dust mass . This is not inconsistent with the aforementioned result, given that the IRAS measurements cover a much larger area than that occupied by the nuclear dust disk studied with HST. Furthermore, dust mass estimates using color excess are not sensitive to a smoothly distributed dust component, if present (cf. e.g., Tran et al. 2001).
3 Spectroscopy
3.1 HST/STIS Gas Emission-line Spectroscopy
In the context of GO-program 8236, we used STIS (see Kimble et al. 1998) on September 22, 1999 to obtain long slit spectra of NGC 4335 during two orbits of the HST telescope. We obtained spectra along three adjacent slit positions using a wide slit (52X0.2). The lay-out of the slits is shown in Figure 1. The G750M grating was used in combination with two pixel spatial and spectral on-chip rebinning (in order to obtain enough signal to noise while retaining sufficient spatial and spectral resolution) yielding spectra covering the wavelength range from 6436 Å to 7100 Å over 511 pixels. Wavelength calibration spectra of the internal arc lamp were obtained at the beginning of the first orbit and at the conclusion of the second orbit.
The slits were aligned along PA=. This is almost parallel (PA=) to the galaxy major axis (PA=). We denote the central slit by C, and the adjacent slits on the east- and west-side by E and W, respectively. A log of the observations is provided in Table 2. Target acquisition uncertainties and other possible systematic effects could cause the slit positions on the galaxy to differ slightly from those commanded to the telescope. We determined the actual slit positions from the data themselves, using the STIS continuum and emission-line fluxes and the WFPC2 images. We compared the continuum counts as function of position along the slit for the three STIS slits with the counts in the WFPC2 and images at these positions. The STIS continuum was determined blue-ward of H+[N II] and red-ward of [S II] respectively. This analysis indicates that the positioning errors for the STIS slits with respect to the WFPC2 image are less than in both the direction along and perpendicular to the slit. Another estimate of the positioning of the slits with respect to the galaxy nucleus was obtained by interpolation of the central few H+[N II] fluxes assuming the maximum flux occurs at the galaxy nucleus. This analysis implies that the central slit was properly centered on the nucleus to an accuracy of . The small slews performed by the telescope between observations to dither the slits and observe the adjacent slits have a nominal positioning error of .
Most of the necessary data reduction steps were performed by the HST/STIS calibration pipeline (CALSTIS version 2.3), including flat-fielding, hot pixel and cosmic-ray removal, absolute sensitivity calibration and wavelength calibration which takes into account the Earth’s motion. To facilitate hot pixel and cosmic-ray removal two exposures were taken at each slit position dithered by 2 pixels in the direction along the slit. The uncertainty in the relative wavelength accuracy is Å or (Diaz-Miller 2001).
3.2 Gas Kinematics and Fluxes
The spectra show several emission lines, of which the H+[N II] complex at 6548, 6563, 6583 Å has sufficiently high signal-to-noise ratio for a kinematical analysis. The [S II] doublet at 6716 and 6731 Å can be fitted only in the central in the central slit and at a lower signal-to-noise ratio. The results for these few points are consistent with the H+[N II] kinematics described below. To quantify the H+[N II] gas kinematics we fitted the spectra assuming that each emission line is a Gaussian on top of a flat continuum. This yields for each line the total flux, the mean velocity and the velocity dispersion . We fitted the [N II] doublet under the assumption that the individual lines have the same and and that the ratio of their fluxes equals the ratio of their transition probabilities (i.e., 3; see references in Mendoza 1983). The H+[N II] complex is influenced by blending of the lines, and we made the additional assumptions that H and the [N II] doublet have the same kinematics.
We did the Gaussian fitting using software described in van der Marel & van den Bosch (1998). Prior to the emission-line fit the spectra were rebinned along the slit where necessary to obtain sufficient , and hence sufficiently small errors on the gas kinematics (Table 3), to discriminate between the black hole masses in dynamical models discussed in Section 4.3 and later. The same gaussian fitting was performed on modeled emission-line spectra which resulted from the dynamical models. Differences between the velocity profiles (VP) and the single Gaussian fits are discussed in Section 4.3.
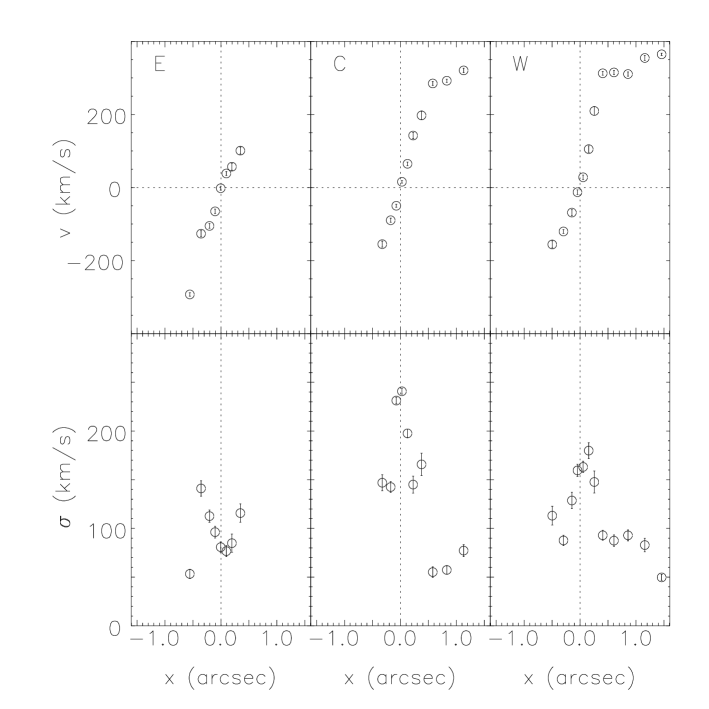
The Gaussian fits to the emission lines are shown in Figure 2. The resulting kinematics are shown in Figure 3 and tabulated in Table 3. The systemic velocity used in Figure 3 and Table 3 was estimated from the HST data themselves, by including it as a free parameter in the dynamical models described below (see Section 4.3). This yields . This result is consistent with by Huchra et al. (1983) and from the RC3 catalog (de Vaucouleurs et al. 1991).
The mean-velocity profiles are smooth functions of position and are indicative of a rotating circular disk of emission gas. The rotating disk picture is further supported by the fact that the mean velocities on the minor axis are close to in all three slits. The velocity dispersion profiles in all three slits show irregularities. We verified that this result does not depend sensitively on chosen region to fit the continuum and masked deviant pixels during the fit. The velocity dispersion peaks at at the nucleus in the central slit C. In slit W the dispersion peaks near the nucleus. However, in slit E the dispersion actually dips at the position closest to the nucleus. It seems therefore that the kinematics of NGC 4335 are consistent with a rotating gas disk, but with additional turbulent motion.
We also performed single Gaussian fits to H and the [N II] doublet independently. The two resulting flux profiles have very similar shapes. The mean velocities for the two sets of emission lines are very similar as well. The median difference between the mean velocities of the two components is . This is slightly larger than the typical formal errors given in Table 3. These formal errors are derived by propagating the spectral flux errors. We will assume as a more realistic error estimate for the H+[N II] mean velocities. The H and [N II] velocity dispersion profiles show very similar behavior, but H has systematically lower velocity dispersions by about . The differences in dispersion could be caused by the fact that (i) the H and [N II] have intrinsically different kinematics or (ii) the H kinematic measurements are affected by stellar H absorption. A similar effect and of the same magnitude is seen for the gas disk in the S0 galaxy NGC 3245 (Barth et al. 2001).
3.3 WHT/ISIS Stellar Absorption-line Spectroscopy
A long-slit stellar absorption spectrum at PA (i.e., within from the major axis of NGC 4335) was obtained in service mode with the ISIS (blue arm) spectrograph on the 4.2m William Herschel Telescope on La Palma on June 13, 2001. A slit-width of was used with the R300B grating and the EEV12 CCD detector. The dispersion is 0.86 Å/pix and the spatial scale is /pix. The observed wavelength range was 3430–6900 Å. The observations included two 1800s exposures of NGC 4335, a 60s exposure of the B2IVp star BD+33 2642 to facilitate flux calibration, and standard calibration exposures. The instrumental velocity dispersion was determined from sky lines and the emission-line widths in the calibration lamp spectra. Both the star and galaxy spectra were observed with a seeing of FWHM .
The data reduction was performed in IRAF using the CCDPROC (Version Dec93) and TWODSPEC packages. The basic data reduction steps include bias subtraction, flat-fielding with dome-flats and cosmic-ray removal. The contribution from dark current is negligible. The wavelength calibration was done with contemporary CuAr lamp spectra taken directly before and after the observations of NGC 4335. Either 31 or 32 arc-lamp emission lines were used to map the wavelength as a function of CCD coordinate. The final residuals per fitted emission line are Å (or at 5000 Å). We subsequently performed the wavelength calibration and spatial rectification to align the wavelength direction with the CCD columns in one step. The flux calibration took into account telescope throughput and atmospheric extinction. The Galactic extinction towards NGC 4335 is (Schlegel et al. 1998) and hence negligible. As a cross-check for the flux calibration we verified that the broad-band flux observed through a central aperture in the WHT/ISIS spectrum and our previously observed HST -band image (VK99) agreed to within , correcting for differences in filter passbands and point spread function (PSF). This level of agreement is satisfactory given the uncertainties in WHT/ISIS seeing conditions and extinction corrections. Finally, after verifying that the final calibrated spectra of stars and galaxies did not have any remaining large-scale patterns, we logarithmically rebinned in the wavelength direction to perform the kinematical analysis.
3.4 Stellar Kinematics
We used the wavelength range –5700Å in the NGC 4335 absorption spectrum to derive the stellar kinematics. This range includes the red-shifted Mg , Fe1 and Fe2 absorption features. To obtain the stellar kinematics we used the pixel space fitting method of van der Marel (1994), which compares the NGC 4335 spectrum to a stellar ‘template’ spectrum. A suitable template star (spectral type K0V) was obtained during a different observing run with WHT/ISIS in identical setup. To check for template mismatch we also used stellar templates (spectral types K1III and K2) described in van der Marel & Franx (1993). These data have an instrumental velocity dispersion , i.e., very similar to the of the NGC 4335 spectrum. The inferred stellar kinematics agree within the errors. The observed stellar kinematics as a function of radius are listed in Table 4 (and also shown in Figure 12 which is discussed in Section 5). Stars and gas rotate in the same direction in the core of NGC 4335. The galaxy spectrum integrated along the slit over the central yields an aperture velocity dispersion . The length corresponds to two effective radii as determined by fitting the surface brightness distribution shown in Figure 6. The listed formal errors include photon noise, uncertainties in the continuum fitting and the variation in derived observed by using different stellar templates. We are not aware of previous determinations of the central velocity dispersion for NGC 4335, but note that the central value inferred from the Faber & Jackson (1976) relation agrees well with the observations.
4 Modeling and Interpretation of the H+[N II] kinematics
4.1 Flux Distribution
To model the H+[N II] gas kinematics we need a description of the intrinsic (i.e., deconvolved and de-inclined) emission-line flux distribution. We use fluxes from both the WFPC2 H+[N II] image and STIS spectra to constrain the intrinsic distribution. Figure 4 compares the actual flux distribution observed through the STIS slits with the expected flux distribution through the STIS slits as inferred from the WFPC2 image. The agreement for slits C and W is good considering the uncertainties in the absolute flux calibrations (especially of the LRF filter). For slit E there is a clear discrepancy, but this does not affect the inferred BH mass (see Section 4.4). We model the (face-on) intrinsic flux profile as a double exponential,
| (1) |
and assume that the disk is infinitesimally thin and viewed at an inclination , (cf. Section 2.2). The total flux contributed by each of the two exponential components is (), and the overall total flux is .
The best-fitting parameters of the model flux distribution were determined by a simultaneous fit to the WFPC2 and STIS H+[N II] fluxes. We use a square region of the H+[N II] image centered on the nucleus. The flux errors take into account both Poissonian errors and a error due to uncertainties in the alignment and subtraction of the on- and off-band image (see Section 2.1). From the STIS observations we use the H+[N II] flux of the Gaussian emission-line fits (Section 3.2). The fluxes from Gaussian fits agree within the errors with fluxes estimated by directly measuring the spectral lines. The STIS flux errors take into account readnoise and Poissonian errors. Typically, the STIS fluxes have much smaller relative errors than the WFPC2 fluxes. We perform an iterative fit of the double exponential to the H+[N II] flux data, taking into account flux errors and the necessary convolutions with the appropriate PSF, pixel size and aperture size for each setup. The diamonds in Figure 5 show the predictions of the model that best fits all available data simultaneously. This model has parameters , and . The absolute calibration gives for H+[N II]. The lowest panel in Figure 5 shows the intrinsic (i.e., deconvolved) flux distribution as a function of radius.
The thin disk flux model provides a decent fit to the observed STIS fluxes, apart from a slight under-prediction of the central fluxes in slit W. The WFPC2 measurements are also reasonably well-fitted, although the observed flux profile on the major axis suggests a narrower central flux peak. A second fit was made as well in which we included only the WFPC2 data. This resulted in a considerably narrower intrinsic profile (Figure 5). However, the two model emission-flux distributions result in BH masses which agree to within as discussed in Section 4.4.
4.2 The Stellar Luminosity Density
For the purpose of dynamical modeling we parameterize the three-dimensional stellar luminosity density . We assume that is oblate axisymmetric, that the isoluminosity spheroids have constant flattening as a function of radius, and that can be parameterized as
| (2) |
Here are the usual cylindrical coordinates, and , , and are free parameters. When viewed at inclination angle , the projected intensity contours are aligned concentric ellipses with axial ratio , with . The projected intensity for the luminosity density is evaluated numerically.
We assume as discussed in Section 2.2. We take within a radius of based on the isophotal analysis of VK99 (their Figure 2). They determined that the isophotes are very close to elliptical and that varies from to between major-axis radius and . The isophotal major-axis PA= is nearly constant, varying by less than over the same radius range. A model with constant and PA is expected to be adequate in view of the main uncertainties for the BH mass from our dynamical modeling as discussed in Section 6. For example, we verified that the variation in ellipticity changes the derived circular velocities by , which is small compared to our velocity errors.
We determine the mean flux profile over three rows (corresponding to a width ) along the unobscured eastern galaxy semi-minor axis (cf. Section 2.2). We use the -band fluxes as opposed to -band fluxes because the flux contribution of emission-lines is negligible in this wavelength region. The observed surface brightness profile is shown in Figure 6. The projected intensity profile of the best-fit model using the fluxes on the semi-minor axis between and is shown by the solid curve. This model has , , and .
The surface mass density of the dust disk, which is proportional to the optical extinction (cf. VK99; and references therein), does not show a strong increase towards the center but varies by just about a factor of two over the disk (cf. Figure 2 in VK00). Taking a Galactic value of the gas-to-dust ratio of 100 (e.g., Bohlin, Savage & Drake 1978), the total mass of the disk, which extends over a region is . The ratio of enclosed disk mass to stellar mass is at most in the range (i.e., . Hence we can neglect the gravitational potential exerted by the gas and dust disk.
There is one complication in estimating the stellar mass profile. The central of the galaxy has a color on both the eastern and western side of the galaxy nucleus. This color is typical of dust-free giant ellipticals. It implies that the dust either does not extend all the way to the center (i.e., has a ring structure) or becomes optically thick towards the center. In the latter case it would hide approximately half of the stellar mass in this region as the dust is very close to the center. We discuss this scenario in Section 4.4 and find that it requires an unusually low stellar mass-to-light ratio to explain the observed gas kinematics.
4.3 Dynamical Models for a Thin Rotating Gas Disk
Our thin-disk models for the gas kinematics are similar to those employed in van der Marel & van den Bosch (1998) and VK00. The galaxy model is axisymmetric, with the stellar luminosity density chosen as in Section 4.2 to fit the available surface photometry. The stellar mass density follows from the luminosity density upon the assumption of a constant mass-to-light ratio . is included as a free parameter in the dynamical model. We assume that the gas is in circular motion in an infinitesimally thin disk in the equatorial plane of the galaxy, and has the circularly symmetric flux distribution given in Section 4.1. Thus the position angle of the gas disk is set by the position angle of the galaxy which is known to an accuracy of . The inclination of the gas disk is assumed to be identical to the dust disk inclination. Below, we will verify PA and also from the two-dimensional gas kinematics independently. The circular velocity is calculated from the combined gravitational potential of the stars and a central BH of mass . The line-of-sight velocity profile of the gas at position on the sky is a Gaussian with mean and dispersion , where is the radius in the disk. The velocity dispersion of the gas is assumed to be isotropic, with contributions from thermal and non-thermal motions: . For practical reasons, we refer to the non-thermal contribution as ‘turbulent’, although its origin is not certain (see Section 4.5). We parameterize through:
| (3) |
This functional form is meant merely to provide a fit to the observed dispersion and is not based on an underlying physical mechanism for the turbulence. The temperature of the gas is not an important parameter: the thermal dispersion for is , and is negligible with respect to for all plausible models.
The predicted VP for any given observation is obtained through flux-weighted convolution of the intrinsic VPs with the PSF of the observation and the size of the aperture. The STIS PSF is represented as a sum of 5 Gaussians (see Table 5). We ignore the effect of ‘pixel-bleeding’ for the STIS PSF, since this changes the kinematics predicted by the model only by a few (Barth et al. 2001). The convolutions are described by the semi-analytical kernels given in Appendix A of van der Marel (1997), and were performed numerically using Gauss-Legendre integration. A Gaussian is fit to each predicted VP for comparison to the observed and . We define a quantity that measures the quality of the fit to the kinematical data, and the best-fitting model was found by minimizing using a ‘downhill simplex’ minimization routine (Press et al. 1992).
As mentioned, the observed VP and the VP predicted by the dynamical modeling are fitted with a single Gaussian. Thus we have to verify that the deviations from a Gaussian are the same in observations and model. Figure 2 shows that in some spectra, especially near the galaxy nucleus, the emission lines tend to have smaller peaks and broader wings than the Gaussian fit. The same trend is indeed seen in the modeled spectra. We verified that, apart from this difference, there are no systematic differences as a function of radius between the VP and the Gaussian fit. Furthermore, the modeled spectra allow us to determine the difference between the moments of the full VP and the Gaussian fit qualitatively, also for blended H+[N II] emission lines, as is the case in many spectra. The representation by single Gaussian fits turns out to be also quantitatively adequate in the sense that the differences between true and gaussian and of the VPs are typically within the quoted errors for the observed Gaussian moments.
4.4 A Thin Disk Fit to the Gas Mean Velocities
We first analyze the H+[N II] gas disk mean velocities and defer discussion of the velocity dispersions to Section 4.5. We start out with models with no BH in which the gas disk has the orientation as determined from the photometry. Thus the gas disk is assumed to have the same inclination and position angle PA= as the dust disk and galaxy (see Section 2.2). This corresponds to an intrinsic axial ratio of for our spheroid model. The STIS long-slit observations were performed at a small angle to the major axis (cf. Section 3.1).
First we vary the -band mass-to-light ratio and find that a model with in solar units fits the observed gas kinematics best (see Figure 7). We will refer to this model as the ‘standard model’. There are some differences between the model and observations. For slit E, the model predicts a steeper mean velocity gradient than observed. For slit W, the observed mean velocities around are systematically larger than predicted by the model. The total and reduced of this model with one free parameter are and , respectively. However, almost of the total is contributed by just the two points at in slit W and at in slit E. These two large deviations might be caused by local deviations from the model, for instance local turbulence. In fact, at the latter location the velocity dispersion shows an off-nuclear peak. Discarding these two points, the reduced . Thus given the idealization of the model, a rotating disk model with localized turbulence is not too unlikely.
We can estimate independently from existing empirical correlations between and galaxy optical luminosity. For NGC 4335, (Paturel et al. 1997) and we assume , and , which is typical for bright ellipticals and consistent with our WFPC2 observations (cf. VK99). We derive using the relation between and absolute magnitude determined by van der Marel (1991). The value is found using the correlation between and absolute magnitude as determined by Magorrian et al. (1998). The two values are consistent because both correlations show scatter of a factor in the observed mass-to-light values at given host luminosity. The value derived from the gas kinematics falls nicely in the expected range .
The inclination of the galaxy and its embedded gas disk are assumed to be similar to the larger scale dust disk. Which is preferred by the gas disk kinematics alone? To address this question, we derive the stellar mass model and intrinsic emission-line flux model assuming () and (). The profile shape of our stellar mass model (Section 4.2) does not depend on inclination but the central stellar mass density changes, i.e., it increases for decreasing inclination. The changes in the intrinsic emission-line flux profile are negligible. For a given , the increase in central stellar density increases the predicted velocities, while the decrease in inclination decreases the line-of-sight component of the predicted velocities. Thus these two effects compete. As Figure 8 shows, compared to the fit for the fits are poorer for and and the best fit is higher than expected from the empirical correlations with host luminosity.
The PA of the gas disk is fixed in the model to be identical to that of the galaxy major axis, which is determined to within by the WFPC2 isophotal analysis. We have varied the PAd of the gas disk major axis by , and find that the circular disk model fits best for PA, i.e. smaller than the PA of the galaxy major axis. The increases by for PAd which are away from PA. Thus the PA of the gas disk as preferred by the gas kinematics agrees well with the PA derived from the WFPC2 stellar isophotes.
In summary, we see that the kinematics of the gas disk support the disk inclination and PA and the mass-to-light ratio implied by independent methods. The slope of the central velocity measurements for each slit are well fitted by this model with no BH. This a posteriori validates our inclusion of the central velocity gradient to determine because this gradient is evidently not affected significantly by the central BH mass. It also implies that the data provide an upper limit to the BH mass.
We now determine this BH mass upper limit. The models indicate that only the gradient between the central three points closest in absolute radial distance from the nucleus (i.e., at in slit C) are significantly affected by a BH with mass . We will therefore use these mean velocities to compute the . Since the model parameters other than are optimized to fit the whole velocity profile, the from the central three mean velocities is expected to follow approximately a probability distribution with degrees of freedom (3 velocity measurements and 1 free parameter, ) and hence an expectation value . In agreement with this the standard model has . Figure 9 shows the increase in as a function of increasing BH mass. From the for the one-parameter model, a is formally ruled out at the 3 level.
A more conservative upper-limit can be obtained by assuming the gas disk is maximally face-on. This will decrease the inferred intrinsic axis ratio of the galaxy (see Section 4.2). Since no giant ellipticals flatter than E6 are observed, we take as the minimum acceptable axis ratio for NGC 4335. This implies a galaxy inclination . Figure 9 shows that a is ruled out at more than the level for . Such a model cannot fit the complete velocity curves as well as the standard model for any (Figure 8). Moreover, the best fit is provided by for which is at least larger than expected, as discussed above.
Section 4.1 shows that the WFPC2 flux profile suggests a narrower flux profile than the STIS data. We performed the gas dynamical modeling also with the double exponential fit to the WFPC2 data only. This results in a higher upper-limit to the inferred BH mass. The other notable discrepancy between the WFPC2 and STIS fluxes in slit E does not influence the BH mass measurement directly.
In Section 4.2 we discussed the possibility that there might be a central dust distribution inside which is completely opaque. This will alter the assumed stellar mass density, because inside approximately half of the galaxy light will be obscured. We determine the stellar mass density assuming the intrinsic stellar flux inside is two times the observed flux and assume that the obscuration by dust is negligible outside . The fitted model has , , and . In this case a mass-to-light ratio is needed to obtain a good fit to the galaxy-dominated kinematics. This is an unusually low and lies well outside the observed scatter of observed absolute magnitude vs. correlations (cf. Section 4.4). Moreover, the emission-line flux is strongly peaked towards the center which suggests we have a direct view of the nucleus without significant obscuration by dust. We conclude that NGC 4335 probably does not have an opaque central dust distribution. If however it is present, then our upper limit on the BH mass is an overestimate.
In conclusion, there is good agreement between the disk inclination and PA as determined from gas kinematics and dust morphology and between the mass-to-light ratio from gas kinematics and from independent methods. These agreements form support for the thin disk model, which indicates . The quantities , and PA are mainly constrained by the gas kinematics at , which is outside the BH radius of influence (with , and the central stellar velocity dispersion). The upper limit to the BH mass is determined from the velocity gradient at . The inferred BH mass is thus based on the assumption that the thin disk model holds for . The next Section considers if this assumption is supported by the gas velocity dispersions.
4.5 The Gas Velocity Dispersions
The velocity dispersion is only roughly fitted by a model of the form (3) with , and (Figure 10). The observed velocity dispersion varies between and (Figure 10). The value of corresponds to the instrumental and thermal line broadening. In the absence of a BH, the induced line broadening due to differential rotation over the apertures increases the predicted dispersion to at most . The presence of a BH with mass would only affect the central aperture in each slit, increasing the predicted dispersions to . Thus for many apertures, the gas shows a larger velocity dispersion than predicted by the dynamical model of a thin rotating disk. Also a double Gaussian fit to each emission-line, to fit a broad and a narrow component of the emission-line, yields a narrow-line component with a velocity dispersion in excess of that expected from the dynamical model (e.g., at the nucleus). Thus, the ‘excess’ velocity dispersion cannot be ascribed easily to the presence of a second kinematic component in addition to the thin rotating disk. An excess velocity dispersion increasing towards the nucleus, i.e., similar to seen here, is often observed in other gas disks (e.g., van der Marel & van den Bosch 1998; VK00; Barth et al. 2001), with M 87 being a notable exception (Macchetto et al. 1997). Significant excess dispersion is only absent at . These points are well-fitted by our model which is strong evidence that (i) the model of a thin disk in rotation applies at these radii and (ii) the model parameters that depend sensitively on these points, i.e., , PA, and , are trustworthy regardless of the effects of excess velocity dispersion observed closer to the nucleus. What causes the excess velocity dispersion? Is it gravitational or non- gravitational in origin?
A gravitational origin would imply that the gas rotates at speeds lower than the circular velocity. Only if the excess in velocity dispersion is modest, , do approximate formulae for this effect of ‘asymmetric drift’ (e.g., Binney & Tremaine 1987) allow the circular velocity to be derived from the observed mean velocity (e.g., Barth et al. 2001). This regime does not apply to the observed kinematics in the central regions if interpreted as asymmetric drift. Unfortunately, the BH mass depends exclusively on these nuclear apertures. It is therefore useful to determine the BH mass in the most extreme case that all dispersion in the central spectrum is gravitational. One option is that the gas forms a spheroidal distribution of collisionless cloudlets. To first approximation we can model the gas assuming a spherical isotropic model and solve the Jeans equations in similar fashion as done in VK00. A black hole mass is then required to produce the observed . The model is simplistic and deviations from axisymmetry and isotropy can change the result by factors of a few (de Bruijne, van der Marel, & de Zeeuw 1996). Moreover the model assumes a constant number density to flux density ratio for the emission-line flux. Different ionization mechanisms (e.g., central point source or shocks) quite likely produce quite different relations between number density and emission-line emissivity as a function of radius. A second option is to assume that asymmetric drift is present except at the very center. The central velocity dispersion is then due entirely to differential rotation over the aperture. Also in this case, a is required to produce the central for and . Thus if the thin disk model breaks down within the central pixel we might have significantly under-predicted the BH mass.
The thin disk model could be a good approximation if the excess velocity dispersion is caused by localized turbulence, which leaves the gas on average in circular rotation. The highly irregular behavior of the velocity dispersion points indeed to a non-gravitational origin. The velocity dispersion of the gas peaks towards the nucleus in slit C and W, but dips towards the nucleus for slit E. Interestingly, the location of irregular peaks in the velocity dispersion profile seems to coincide with deviations of the observed mean velocities compared to the model, especially in slit E. The relative flux of [N II]6583 and H can shed light on the excitation mechanism. Figure 11 shows that the flux ratio [N II]6583 / H roughly peaks towards the nucleus in all slits. This is qualitatively in agreement with the excess dispersion being due to turbulent shocks as they tend to enhance the emission-line ratio (Dopita et al. 1997). Interestingly, the maximum line ratio ([N II]6583 / H ) in fact occurs at the location of the dip in the velocity dispersion in slit E (and a possible dip in slit W). No special feature is detected in the WFPC2 image (Figure 1) at these locations. However, the spine of the straight radio-jet observed at arcsecond-scale resolution with the VLA (PA=; Wrobel, Machalski & Condon 2002; Xu et al. 2000) passes right through the most conspicuous dip in slit E (between and ) if it continues straight down to the sub-arcsecond scales of interest here. Unfortunately, no radio jet emission is detected at VLBA scales (Xu et al. 2000). Surprisingly, the velocity gradient in slit E is regular and only slightly shallower than predicted by our standard model. Thus it seems that the irregular excess in dispersion does not significantly alter the mean rotational velocity.
The irregularity of the velocity dispersion profile and its correspondence to changes in the [N II]6583 / H flux ratio favor a non-gravitational origin for the excess velocity dispersion. The irregularities do not correspond to irregularities in the gas mean velocities. Instead, the mean velocities suggest normal rotation. These observations are consistent with a gas disk for which the bulk of the gas orbits at the circular velocity but locally posesses additional kinetic energy in the form of turbulent motions. Testing the viability of such a hydrodynamical model is very interesting but beyond the scope of this paper. This leaves room for an alternative scenario, in which the excess velocity dispersion is predominantly gravitational (despite its irregular behavior) implying . The WFPC2 imaging and kinematics cannot rule out such a spherical gas distribution at the very center (Section 2.1).
5 Stellar Dynamical Models
The WHT/ISIS stellar kinematics can place constraints on the mass-to-light ratio and the BH mass independently from the gas kinematics. We in turn discuss the constraint on and BH mass. A fully general stellar dynamical modeling of an axisymmetric galaxy requires ‘three-integral’ models in which the phase-space distribution function depends on the orbital energy , the angular momentum component parallel to the symmetry axis, , and a third, non-classical integral (e.g., Binney & Tremaine 1987). However, the inferred mass-to-light ratio from ground-based observations is generally insensitive to assumptions about the structure and dynamics of the galaxy. Models with different inclination (van der Marel 1991) or anisotropy (van der Marel 1994; 1999) yield the same value of to within %.
Thus, to derive , we constructed axisymmetric two-integral models for NGC 4335 in which the phase-space distribution function depends only on the two classical integrals of motion. We use the same galaxy mass model as for the gas kinematics (i.e., with as derived in Section 4.2) and we also include a BH mass. The modeling procedure is the same as used (and described in more detail) by VK00 and similar to applications of models to large samples by, e.g., van der Marel (1991) and Magorrian et al. (1998). Figure 12 shows the observed and predicted kinematics as a function of major axis distance. A value of in solar units provides a good fit to the stellar mean velocity and velocity dispersion profiles at . This is higher than inferred from the gas. Given the uncertainty for , the stellar kinematics out to a radius of are consistent with the mass-to-light ratio inferred by the gas velocity profile in the inner .
The two-integral models can only reproduce the observed peak in the stellar velocity dispersion in the inner by invoking a BH of mass . If this BH mass is correct, the HST gas kinematics are resolving the radius of influence . HOwever, these same gas kinematics firmly rule out such a massive BH. Instead the gas models predict a BH mass which is at least between 5 and 30 times smaller. This is very surprising, because the two gas modeling variants discussed in Section 4.5 ascribe all nuclear gas kinetic energy to gravitation. The gas is assumed to be in either a disk or a spherical cloudlet distribution. These two models are expected to bracket the true nuclear gas distribution. However, there are reasons to mistrust the high BH mass from stellar dynamical modeling. If radial anisotropy in the stellar motions is present, the BH mass is overestimated. As an example, Magorrian et al. (1998) determined the BH masses in a sample of 36 galaxies with similar modeling as performed here (i.e., two-integral modeling with ground-based kinematics and HST-based photometry). They found that for the 15 most spherical galaxies, a spherical model with radial anisotropy remove the need for a BH in all cases (see also van der Marel 1999). It turns out that this degeneracy can be lifted if stellar kinematics at HST resolution is available (i.e., resolving the sphere of influence of the BH) and the complete parameter-space for axisymmetric models is considered with three-integral modeling. Early-type galaxies do indeed harbor BHs but the masses inferred from two-integral and three-integral axisymmetric modeling differ systematically. We compare nine E/S0 galaxies in Magorrian et al (1998) which also have three-integral modeling (as listed in Kormendy & Gebhardt 2001). The average ratio of two-integral BH mass over three-integral BH mass is 3.7 with a minimum of 0.41 and a maximum of 10. Thus it is not too unexpected that, if we were to have stellar kinematics at HST resolution as well, three-integral modeling would indicate a BH mass in better agreement with the value as derived from the gravitational modeling of the gas velocity dispersion. By contrast, the factor difference in BH mass between the resolved thin disk modeling and the stellar dynamical modeling seems a far stretch. Unfortunately, we cannot expect to obtain a stronger constraint on BH mass with more general axisymmetric three integral modeling with the current data because we (i) lack stellar kinematics at HST resolution and hence do not resolve the of a and (ii) have ground-based stellar kinematics only along the major axis and with reliable measurements of only first and second order moments.
6 Discussion and Conclusions
Before analyzing the implications of the inferred black hole mass we first discuss the two main differences between our gas disk dynamical modeling and the modeling used for NGC 3245 presented by Barth et al. (2001) which constitutes the current state-of-the-art. First, instead of the observed emission-line flux distribution, we have used a double exponential fit to the flux distribution. For NGC 3245 the use of an exponential fit changes the inferred by . Moreover, it accounted less well for the wiggles in the velocity profile. In our case the deviations of the exponential model from the observed photometric and spectroscopic emission-line fluxes are estimated to have a effect on BH mass (see Section 4.4). Second, we do not incorporate the velocity shifts due to asymmetric illumination of the slit by the gas disk in the dispersion direction. In other galaxies this could be important to derive the BH mass as they produce surface brightness ’caustics’ (Maciejewski & Binney 2001). These caustics are not observed in NGC 4335. STIS observations of stars by one of us show that the velocity shift amounts to at most for a wide slit in the extreme case of a star at the edge of the slit. Only the (central) apertures in the adjacent slits have an asymmetric flux gradient in the dispersion direction. The kinematics from these apertures are not taken into account in deriving the upper limit to . Hence we conclude that the velocity shift has negligible effect on the derived .
Black hole mass correlates in general rather tightly with observed velocity dispersion in the inner region of galaxies (Gebhardt et al. 2000; Ferrarese & Merritt 2000). Recently, Tremaine et al. (2002) completed a detailed analysis of the correlation and we will use their results in what follows. They find a best fit correlation of the form with and for . The observed spread in the correlation indicates that the intrinsic dispersion in is 0.3 dex (perhaps smaller if observational errors are underestimated). Measuring the central in similar fashion as in Tremaine et al. (2002) gives for NGC 4335 (cf. Section 3.4) which corresponds to a predicted . The upper-limit from the thin disk modeling of the gas mean velocities (Section 4.4) falls well below the relation, even when including the reported intrinsic dispersion in . The residuals are dex and dex for the upper-limit of (best-fit model) and (for a maximally face-on gas disk), respectively (see Figure 13). The residuals are even larger if we use the best-fit relation as determined by Ferrarese (2002) who infers a larger . The derived from stellar dynamics corresponds to an equally large, but positive residual of dex. Finally, the gravitational modeling of the gas velocity dispersions yields corresponding to a residual of dex, well within the reported intrinsic dispersion of the correlation.
Which BH mass are we to trust? The analysis strongly supports a thin rotating gas disk model at . The model provides a reasonable fit to the gas mean velocities and dispersions, the dust disk morphology and gas disk kinematics indicate the same inclination and PA, and the from stellar and gas kinematics is consistent. However, there are doubts for the validity of the model at . The WFPC2 and STIS fluxes are consistent with a thin disk surface brightness profile but the signal-to-noise of the WFPC2 image is too low to rule out a more spherical distribution. An excess velocity dispersion with an irregular profile is observed at . Only an ad hoc explanation of localized random motion exists for this excess. It is not clear if such quasi-stationary turbulence in a thin disk is physically viable (e.g., Wada , Meurer & Norman 2002; and references therein). If the excess velocity dispersion is (partly) due to gravitational motion around the BH, then the thin disk model underestimates the true BH mass. Ascribing all gas kinetic energy, including the excess velocity dispersion, as counterbalancing the gravitational potential in a simple manner of isotropically moving collisionless cloudlets yields a BH mass which agrees well with the correlation (Tremaine et al. 2002). Ascribing the nuclear velocity dispersion to rotational motion from a spatially unresolved disk yields an equally good agreement (Section 4.5). As discussed in more detail in Section 5, it is not too unreasonable to assume that the stellar dynamical modeling overestimates the BH mass by a factor of . This would be due to radial anisotropy (often observed in bright ellitpicals such as NGC 4335) which the two-integral modeling does not take into account. In conclusion, the gas spheroidal model infers a BH mass in accordance with the empirical relation, but remains very simplistic. If doubts about the validity of the thin disk modeling for were proven true, its inferred BH mass is expected to be an underestimate, driving the expected true BH mass to higher values in better agreement with the relation. Similarly, the expected corrections for the stellar dynamical model bring its predicted BH mass in better agreement with the relation.
What are the implications if in reality NGC 4335 indeed harbors a BH with ? Our results then suggest that gas dynamical modeling assuming thin rotating disks cannot be used to derive accurate black hole masses, even when all of the following are true: (i) the gas mean velocities very clearly suggest rotation; (ii) the surrounding dust disk appears regular; (iii) the inclination and position angle of the inner gas disk are well-constrained due to the use of three adjacent slits and these angles are both indicated by the gas disk kinematics and independent methods; and (iv) the derived from gas and stars agree, ruling out asymmetric drift at . This then would cast doubt on other values determined from gas kinematics using similar models. Figure 13 shows that these measurements have a large influence on the upper-end of the detections and hence on the slope of the correlation. Moreover, to date all measurements of in nearby radio galaxies are based on gas kinematics. However, the fact that the inferred BH masses using this method follow the best-fit relation more closely than the stellar dynamical measurements argues against this worry of the validity of the gas dynamical modeling in general. The per degree of freedom as used in deriving the best-fit relation (cf. Equation 3 in Tremaine et al. 2002) is 0.27 for the gas dynamical measurements while for the stellar dynamical measurements it is 1.30 (1.17 if one excludes the Milky Way BH mass measurement which is obtained from a stellar dynamical model which is completely different from those used for external galaxies). Moreover, the average residual of the gas dynamical BH mass measurements is positive, counter to what is expected if the gas mean velocities systematically underestimate the circular velocity and hence the inferred BH mass.
Independent determinations of in galaxies from gaseous and stellar kinematics observed at high spatial resolution are crucial to address the worries about the gas dynamical modeling. This has been performed for IC 1459 (Verdoes Kleijn et al. 2000; Cappellari et al. 2002). Verdoes Kleijn et al. derive from the gaseous kinematics at 6 FOS pointings a black hole mass ranging from (thin disk model) to (isotropic spheroidal model). However, Cappellari et al. (2002) infer based on three-integral modeling of combined ground-based and HST/STIS stellar kinematics. Unfortunately, the HST stellar kinematics cannot be measured accurately inside the sphere of influence for this BH mass. Cappellari et al. also present a more complete view of the gas kinematics from a recent STIS long-slit observation. This indicates that while the data are consistent with the earlier FOS measurements, and the inferred BH mass is similar (modeled with independently developed software), the gas mean velocities are rather perturbed in this particular case. Moreover, IC1459 has an irregular dust distribution. Thus, the gas and dust properties in IC 1459 are quite different from the photometrically and kinematically well-behaved central disk in NGC 4335. An independent measurement based on the stellar kinematics for NGC 4335 at HST resolution, and for other galaxies with similar gas disk kinematics, would test the validity of the gas dynamical modeling in well-behaved gas disks as opposed to irregular gas disks.
It is similarly crucial to understand the origin of the excess velocity dispersion commonly seen in nuclear gas disks. Presently, it is not clear under which circumstances the thin gas disks become locally turbulent (for example, gravitational or MHD instabilities) and if they remain globally stable (e.g., Wada, Meurer & Norman 2002; and references therein). A better idea for the origin of the excess is needed to improve on the highly idealized collisionless spherical model discussed in this paper. In this respect, it is also useful to determine the ionization mechanism of the emission-line gas in nuclear disks. If it is shocks we should be wary about the modeling with unperturbed, infinitely thin rotating disks. Furthermore, the disks of gas and dust might perhaps interact with ambient hot X-ray gas which is often present in the centers of bright ellipticals (e.g., Gunn 1979). The ultimate goal for gas dynamical modeling is thus to explain self-consistently the density, ionization state and dynamical state of the central gas distributions. This requires high S/N two-dimensional photometry, kinematics and line ratios to determine the dynamics, ionization state, density and temperature as a function of disk radius. This will provide not only accurate BH masses but also a vast improvement in our understanding of the fueling of BHs.
Kiloparsec-scale radio jets are only seen in early-type galaxies but never in spirals (with one possible exception known to the authors; Ledlow et al. 2001). For instance, the UGC FR-I galaxies all have Hubble types E-S0 (cf. VK99). Prior to this study, only BH masses have been reported in nearby radio galaxies (i.e., NGC 4261, NGC 4374, M87, NGC 5128, NGC 6251 and NGC 7052, see Tremaine et al. 2002 for references). Interestingly, none of the seven galaxies with a Hubble type later than S0 in the the sample compiled by Tremaine et al. (2002) have . We are aware of only one galaxy with a Hubble type later than S0 and a , which is the Sombrero galaxy (M104, Hubble type Sa) with , but this measurement is based on models less general than three-integral stellar dynamical models. By contrast, all BH mass upper limits and detections in a sample of 16 mostly early-type disk galaxies (Hubble type S0-Sb; Sarzi et al. 2001) are below . These results suggest that the differences in BH mass might be the underlying factor for this host preference of radio-jets. However, if our determination of a upper limit of on the BH mass of NGC 4335 is correct, then NGC 4335 would illustrate that BHs with are also capable of producing FR-I radio jets. This would argue against BH mass being the (only) parameter underlying the host morphology preference of radio galaxies.
References
- (1) Barth A.J., Sarzi M.R., Rix H.-W., Ho L.C., Filippenko A.V., Sargent W.L.W., 2001, ApJ, 555, 685
- (2) Binney J.J., Tremaine S.D., 1987, Galactic Dynamics, Princeton University Press
- (3) Biretta J., et al., 1996, Wide Field and Planetary Camera 2 Instrument Handbook, Version 4.0 (Baltimore: Space Telescope Science Institute)
- (4) Bohlin R.C., Savage B.D., Drake F.J., 1978, ApJ, 224, 132
- (5) Cappellari M., et al. , 2002, ApJ, in press [astro-ph/0202155]
- (6) de Bruijne J.H.J., van der Marel R.P., de Zeeuw P.T., 1996, MNRAS, 282, 909
- (7) de Zeeuw P.T., 2001, in ESO Conference on Black Holes in Binaries and Galactic Nuclei, eds. L. Kaper, E.P.J. van den Heuvel, 78
- (8) de Vaucouleurs G., de Vaucouleurs A., Corwin H.G. Jr., Buta R.J., Paturel G., Fouqué P., 1991, Third Reference Catalogue of Bright Galaxies, Springer-Verlag (RC3)
- (9) Diaz-Miller R.I., Goudfrooij P., 2001, STIS Instrument Science Report 2000-04
- (10) Dopita M.A., Koratkar A.P., Allen M.G., Tsvetanov Z.I., Ford H.C., Bicknell G.V., Sutherland R.S., 1997, ApJ, 490, 202
- (11) Faber S.M., Jackson R.E., 1976, ApJ, 204, 668
- (12) Fanaroff B.L., Riley F.M., 1974, MNRAS, 167, 31
- (13) Ferrarese L.C., in Current High-Energy Emission around Black Holes, ed. C.-H. Lee (Singapore: World Scientific), in press [astro-ph/0203047]
- (14) Ferrarese L.C., Ford H.C., Jaffe W., 1996, ApJ, 470, 444
- (15) Ferrarese L.C., Ford H.C., 1999, ApJ, 515, 583
- (16) Ferrarese L.C., Merritt D., 2000, ApJ, 539, L9
- (17) Franceschini A., Vercellone S., Fabian A.C., 1998, MNRAS, 297, 817
- (18) Gebhardt K., et al., 2000, ApJ, 539, L13
- (19) Gebhardt K., et al., 2002, in preparation
- (20) Goudfrooij P., de Jong T., 1994, A&A, 298, 784
- (21) Gunn J.E., 1979, in Active galactic nuclei (Cambridge: Cambridge University Press), 213
- (22) Harms R.J., et al., 1994, ApJ, 435, L35
- (23) Ho L.C., 1999, in Observational Evidence for Black Holes in the Universe, ed. S.K. Chakrabarti (Dordrecht: Kluwer), 157
- (24) Huchra J., Davis M., Latham D., Tonry J., 1983, ApJS, 52, 89
- (25) Kimble R., et al., 1998, ApJl, 492, 83
- (26) Knapp G.R., Guhathakurta P., Kim D.-W., Jura M.A., 1989, ApJS, 70, 329
- (27) Kormendy J., Richstone D., 1995, ARA&A, 33, 581
- (28) Kormendy J., Gebhardt K., 2002, in The 20th Texas Symposium on Relativistic Astrophysics, eds. H. Martel, J.C. Wheeler, AIP, in press, [astro-ph/0105230]
- (29) Krist J., Hook R., 2001, http://www.stsci.edu/software/tinytim/
- (30) Ledlow M.J., Owen F.N., Yun M.S., Hill J.M., 2001, ApJ, 552, 120
- (31) Macchetto F.D., Marconi A., Axon D.J., Capetti A., Sparks W., Crane P., 1997, ApJ 489, 579
- (32) Maciejewski W., Binney J., 2001, MNRAS, 323, 831
- (33) Magorrian J., et al., AJ, 1998, 115, 2285
- (34) Martel A.R., et al., 1999, ApJS, 122, 81
- (35) Mendoza C., 1983, Planetary Nebualae (IAU Symposium No. 103) ed. D.R. Flower (Dordrecht:Reidel), 143
- (36) Noel-Storr, et al., 2002, in The central kpc of starbursts and AGN: the La Palma connection, eds. J.H. Knapen, J.E. Beckman, I. Shlosman, T.J. Mahoney (San Francisco: ASP), 249, 375
- (37) Paturel G., et al., 1997, A&AS, 124, 109
- (38) Press W.H., Teukolsky S.A., Vetterling W.T., Flannery B.P., 1992, Numerical Recipes (Cambridge: Cambridge University Press)
- (39) Richstone D., et al., 1998, Nature, 395A, 14
- (40) Sarzi M., et al., 2001, ApJ, 550, 65
- (41) Schlegel D.J., Finkbeiner D.P., Davis M., 1998, ApJ, 500, 525
- (42) Trauger J.T., 1994, ApJL, 435, 3L
- (43) Tran H.D., Tsvetanov Z., Ford H.C., Davies J., Jaffe W., van den Bosch F.C., Rest A., 2001, AJ, 121, 2928
- (44) Tremaine S., et al. , 2002, ApJ in press, [astro-ph/0203468]
- (45) van der Marel R.P., 1991, MNRAS, 253, 710
- (46) van der Marel R.P., Franx M., 1993, ApJ, 407, 525
- (47) van der Marel R.P., 1994, MNRAS, 270, 271
- (48) van der Marel R.P., Evans N.W., Rix H.-W., White S.D.M., de Zeeuw P.T., 1994, MNRAS, 271, 99
- (49) van der Marel R.P., 1997, in The 1997 HST Calibration Workshop, eds. S. Casertano et al. (Baltimore: Space Telescope Science Institute), 443
- (50) van der Marel R.P., van den Bosch F.C., 1998, AJ, 116, 2220
- (51) van der Marel R.P., 1999, in Galaxy Interactions at Low and High Redshift, eds. J.E. Barnes, D.B. Sanders (Dordrecht:Kluwer Academic Publishers), 333
- (52) Verdoes Kleijn G.A., Baum S.A., de Zeeuw P.T., O’Dea C.P., 1999, AJ, 118, 2592
- (53) Verdoes Kleijn G.A., van der Marel R.P., Carollo C.M., de Zeeuw P.T., 2000, AJ, 120, 1221
- (54) Wada K., Meurer G., Norman C.A., 2002, ApJ, in press.
- (55) Wrobel J.M., Machalski J., Condon J.J., 2002, in preparation
- (56) Xu C., Baum S.A., O’Dea C.P., Wrobel J.M., Condon J.J., 2000, AJ, 120, 2950


| filter | |||
|---|---|---|---|
| (Å) | (Å) | (s) | |
| (1) | (2) | (3) | (4) |
| F555W | 5473 | 1225 | 460 |
| F814W | 8000 | 1459 | 460 |
| LRF | 6664 | 83 | 3600 |
Note. — The filter name is listed in column (1). Columns (2) and (3) list the central wavelength of the filter and the FWHM. Column (4) lists the total exposure time, which for the broad-band filters and the LRF was divided into two and three back to back exposures, respectively.
| ID | ||
|---|---|---|
| (arcsec) | (s) | |
| (1) | (2) | (3) |
| E | 1560 | |
| C | 1300 | |
| W | 2154 |
Note. — STIS spectra of NGC 4335 were obtained through three parallel slits of width. Column (1) gives the ID for the slit. Column (2) lists the slit-center position perpendicular to the major axis for each slit. Column (3) lists the exposure times.
| Slit | Rebin | ||||||
|---|---|---|---|---|---|---|---|
| arcsec | arcsec | ||||||
| (1) | (2) | (3) | (4) | (5) | (6) | (7) | (8) |
| E | 2 | 0.347 | -0.254 | 101.00 | 9.68 | 115.71 | 9.44 |
| 1 | 0.196 | -0.232 | 57.01 | 9.58 | 84.86 | 9.34 | |
| 1 | 0.096 | -0.217 | 38.39 | 5.65 | 76.64 | 5.62 | |
| 1 | -0.005 | -0.202 | -2.00 | 5.48 | 80.75 | 5.47 | |
| 1 | -0.105 | -0.187 | -65.27 | 5.88 | 96.18 | 6.03 | |
| 1 | -0.205 | -0.171 | -105.18 | 6.50 | 112.63 | 6.26 | |
| 2 | -0.356 | -0.149 | -126.46 | 8.49 | 141.02 | 7.98 | |
| 2 | -0.556 | -0.119 | -292.72 | 4.77 | 53.30 | 4.62 | |
| C | 3 | 1.128 | -0.169 | 320.72 | 6.12 | 77.20 | 6.19 |
| 3 | 0.828 | -0.124 | 292.35 | 4.25 | 57.35 | 4.17 | |
| 2 | 0.577 | -0.086 | 284.91 | 5.49 | 55.16 | 5.44 | |
| 2 | 0.376 | -0.056 | 197.42 | 12.06 | 165.72 | 11.49 | |
| 1 | 0.226 | -0.034 | 142.31 | 8.88 | 145.00 | 8.72 | |
| 1 | 0.125 | -0.019 | 64.90 | 4.78 | 197.58 | 4.39 | |
| 1 | 0.025 | -0.004 | 15.66 | 3.55 | 240.79 | 2.98 | |
| 1 | -0.075 | 0.011 | -49.96 | 4.06 | 231.24 | 3.32 | |
| 1 | -0.175 | 0.026 | -89.63 | 5.59 | 142.48 | 5.62 | |
| 2 | -0.326 | 0.049 | -155.09 | 8.40 | 146.89 | 8.24 | |
| W | 3 | 1.459 | -0.016 | 364.75 | 3.23 | 49.70 | 3.14 |
| 3 | 1.158 | 0.029 | 354.71 | 6.85 | 82.90 | 6.86 | |
| 3 | 0.857 | 0.074 | 310.68 | 5.85 | 92.86 | 5.61 | |
| 2 | 0.606 | 0.111 | 315.11 | 5.76 | 87.42 | 5.92 | |
| 2 | 0.406 | 0.141 | 312.75 | 5.11 | 92.93 | 5.06 | |
| 1 | 0.255 | 0.164 | 209.58 | 11.82 | 147.67 | 11.28 | |
| 1 | 0.155 | 0.179 | 105.15 | 8.92 | 179.87 | 8.15 | |
| 1 | 0.055 | 0.194 | 28.02 | 5.92 | 163.13 | 5.79 | |
| 1 | -0.046 | 0.209 | -12.79 | 6.30 | 159.55 | 6.17 | |
| 1 | -0.146 | 0.224 | -68.63 | 8.27 | 128.64 | 8.32 | |
| 2 | -0.296 | 0.247 | -120.31 | 5.39 | 87.64 | 5.36 | |
| 2 | -0.497 | 0.277 | -155.89 | 9.89 | 113.07 | 9.61 |
Note. — Kinematics of the H+[NII] emission lines inferred from STIS spectra of NGC 4335 through three parallel slits of width. The kinematics observed through each slit are separated by a horizontal line. Column (1) lists the slit label (see Section 3.1 for definition). Column (2) lists the number of rebinned pixels of size x . Columns (3)-(4) list the position of the aperture center with respect to the major axis (i.e., -axis) and minor axis (i.e., -axis). The uncertainties in these positions are . The zero-point is at the galaxy nucleus; positive values lie in the direction of . Columns (5)-(8) list the mean gas velocity and velocity dispersion and formal random errors as determined from single Gaussian fits to the emission lines.
| Rebin | ||||||
|---|---|---|---|---|---|---|
| arcsec | arcsec | |||||
| (1) | (2) | (3) | (4) | (5) | (6) | (7) |
| 36 | 7.39 | 1.04 | 51 | 10 | 210 | 11 |
| 12 | 3.18 | 0.45 | 95 | 8 | 245 | 9 |
| 5 | 1.65 | 0.23 | 91 | 8 | 297 | 9 |
| 3 | 0.92 | 0.13 | 49 | 7 | 296 | 7 |
| 2 | 0.47 | 0.07 | 34 | 7 | 295 | 7 |
| 2 | 0.09 | 0.01 | 17 | 8 | 314 | 6 |
| 2 | -0.28 | -0.04 | -22 | 7 | 291 | 6 |
| 3 | -0.73 | -0.10 | -46 | 8 | 287 | 7 |
| 6 | -1.54 | -0.22 | -101 | 7 | 258 | 7 |
| 16 | -3.52 | -0.50 | -119 | 8 | 232 | 8 |
Note. — Stellar kinematics inferred from a WHT/ISIS long-slit spectrum of NGC 4335 obtained with a slit approximately along the major axis ( slit width). Column (1) lists the number of rebinned pixels of size x . Columns (2)-(3) list the position of the aperture center with respect to the the major and minor axis (i.e., /-axis). The coordinate system is identical to that used for the STIS slits in Table 3. Columns (4)-(7) list the mean velocity and velocity dispersion of the stellar absorption lines with the corresponding formal random errors as determined from a fit to the absorption-line spectrum in pixel space (see Section 3.4).
| (arcsec) | ||
|---|---|---|
| (1) | (2) | (3) |
| 1 | 0.674510 | 0.026922 |
| 2 | -0.606168 | 0.045302 |
| 3 | 0.798732 | 0.066942 |
| 4 | 0.084999 | 0.272356 |
| 5 | 0.047927 | 0.860743 |
Note. — The parameters of the five Gaussians which together represent the STIS PSF as PSF()=. The parameters were obtained through a fit to the STIS PSF produced with the Tiny Tim software (Krist & Hook 2001). Differences between the actual PSF and the analytical fit cause differences in the modeled kinematics which are smaller than the errors in the data.