Exploring physics of rotation powered pulsars with sub-10 GeV imaging atmospheric Cherenkov telescopes
Abstract
We discuss the potential of future sub-10 GeV threshold imaging atmospheric Cherenkov telescope arrays for exploring the physics of rotation powered pulsars and their interactions with the ambient medium through relativistic winds and termination shocks. One such telescope is the high-altitude concept called “5@5” recently suggested by Aharonian et al. (2001). 5@5, with its enormous detection area exceeding at the threshold energy of about 5 GeV, combines two distinct features of the current satellite-borne (large photon fluxes at GeV energies) and ground-based (large detection areas at TeV energies) gamma-ray astronomies. Such an instrument would allow comprehensive studies of temporal and spectral characteristics of -ray pulsars in the crucial 5 to 30 GeV energy interval. An equally important topic in the program of pulsar studies by 5@5 would be the search for GeV -radiation from other radio pulsars at a few mVela level. And finally, the searches for pulsed radiation components in the spectra of a large fraction of unidentified EGRET sources (suspected to be pulsars) without invoking information from lower (radio, optical, X-ray) frequency domains, seems to be another important issue, because the periodic signals at lower energies could be significantly suppressed in many cases. The detection rate of -rays from “standard” EGRET sources by 5@5 is expected to exceed several events per one second. This should provide an adequate photon statistics for the search for periodic signals at the flux level of 3 mVela within the observation time of 3 h or so (a time resolution below which any change of a signal’s phase can be ignored). The spectral coverage by 5@5 and its flux sensitivity are nicely suited for studying other aspects of pulsar physics and astrophysics, in particular for detecting unshocked relativistic pulsar winds, as well as for quantifying characteristics of pulsar driven synchrotron nebulae through the inverse Compton radiation at energies between several GeV and several 100 GeV. The Vela pulsar, the brightest -ray source on the sky, is an ideal laboratory for practical realization of these unique observational possibilities.
keywords:
gamma-rays: theory;pulsars: general;instrumentation: detectorsPACS:
95.55.K; 97.60.G;98.70.R1 Introduction
The number of cataloged radio pulsars – single neutron stars powered by fast rotation – exceeds 1200 (Lorimer 2001). Only seven of them (with two other possible candidates) are reported by the EGRET team as GeV -ray sources (Thompson 1999, Kaspi et al. 2000) . Actually, this is not a big surprise, and can be explained by modest flux sensitivities of -ray instruments. For example, the minimum detectable flux by EGRET of about is 5 orders of magnitude larger than the sensitivity achieved by radio telescopes at GHz frequencies. This striking difference in sensitivities is compensated, to a certain extent, by much larger energy fluxes in -rays. While the pulsars emit in the radio band a tiny fraction of their rotational energy (Manchester & Taylor 1977), the -ray luminosities of some of the EGRET pulsars above exceed one per cent of their spin-down luminosities. It is expected that the Gamma-ray Large Area Space telescope (GLAST), the future major satellite-based high energy -ray detector with flux sensitivity as good as (Gehrels & Michelson 1999), will increase the number of radio pulsars seen also in -rays by at least an order of magnitude (Thompson 2001). Moreover, the radio pulsars, which are observable only when their radio beams cross the Earth orbit, are only a part of a larger source population called Rotation Powered Pulsars (RPPs, for short). The -ray beams are believed to be significantly wider than the radio beams and they should not necessarily overlap with each other (Yadigaroglu & Romani 1995). If so, the RPPs would have improved chances, in principle, to be detected, in high energy -rays rather than at radio wavelengths. This could be the case of some of the unidentified EGRET sources, a large fraction of which is believed to be radio-quiet pulsars (see e.g. Grenier 2000). The unambiguous and straightforward proof of this hypothesis would be the discovery of -ray pulsations from these objects. In this regard, it is crucial to search for the pulsed -ray components without relying on observations at other energy bands. Although GLAST will be able to perform effective searches for strong unidentified -ray sources (Thompson 2001), its potential in this regard will be still limited, at least for marginally detected weak sources which most likely will appear in the GLAST source catalog (future “unidentified GLAST sources”). An effective realization of this important approach which relies only on -ray astronomical observations requires large photon statistics, and therefore much larger detector areas. The current and forthcoming atmospheric imaging Cherenkov telescopes do provide huge (as large as ) detection areas. But most of these telescopes operate in the energy region which lies, most probably, well beyond the cutoffs expected in the pulsar spectra. In contrast, the recently suggested concept “5@5” by Aharonian et al. (2001) –5 GeV energy threshold array of imaging atmospheric Cherenkov telescopes at 5 km altitude– which combines the most important features of the current space-based (large fluxes at GeV energies) and ground-based (large detection areas at TeV energies) astronomies, could serve as an ideal tool for pulsar studies. Remarkably, the analysis of the EGRET pulsars shows that with age of pulsars the fraction of the spin-down luminosity converted into -rays increases, and the peak in the spectral energy distribution shifts towards 10 GeV (Nel et al. 1996). If this tendency extends to fainter pulsars, the chances for detection of many pulsars by 5@5 would be increased dramatically.
The potential of the 5@5 concept is not limited to the discovery of faint -ray pulsars. In addition, 5@5 can provide detailed spectroscopy in one of the key or, perhaps even the most informative, energy regions of above several GeV for pulsar physics. It is worth noting that the EGRET data indicate that some important changes might take place at multi-GeV energies. In particular, the light curves of all EGRET pulsars at energies above 5 GeV seem to be different than at lower energies (Thompson 2001). Detailed temporal and spectroscopic measurements in this transition region by 5@5 will hopefully remove many uncertainties we presently face in the physics of pulsar magnetospheres. Accurate measurements of the energy spectrum of strong EGRET pulsars in the cutoff region expected between 5 and 20 GeV would allow, in particular, to distinguish between two currently popular models of high energy -radiation — polar cap (Daugherty & Harding 1982, 1996; Usov & Melrose 1995) and outer gap (Cheng et al. 1986; Romani 1996; Hirotani & Shibata 1999) models. These models generally predict different fractions in the population of radio-quiet versus radio-loud -ray pulsars, as well as different spectral characteristics, especially at the multi-GeV energy range. These differences are quite significant, even with large uncertainties in model parameters (Harding 2001). Thus 5@5 should allow distinction among these models, or perhaps even to challenge most scenarios. Remarkably, this intermediate energy region can be effectively studied by both GLAST and 5@5— a combination of which would provide high reliability of results. On one hand GLAST will extend the studies to low energies, down to , while 5@5 can perfectly cover the energy region well above 10 GeV where GLAST most probably would run out of photons. Presently several ground-based telescopes such as MAGIC, CELESTE and STACEE are pushing their energy thresholds below 100 GeV (e.g. Buckley et al. 2001; Krennrich 2001), however none of these is optimized for energies in the crucial 10 GeV range.
The flux sensitivity, angular resolution, and the spectral coverage of 5@5 perfectly match other important aspects of the pulsar physics and astrophysics. In particular, the search for inverse Compton -radiation from unshocked ultrarelativistic winds caused by illumination of the wind by the IR to X-ray radiation emitted by the pulsar/neutron star itself (Bogovalov & Aharonian 2000) or, in the case of binary pulsar systems, with illumination provided by the companion star (Ball & Kirk 2000), would be an important topic in the program of pulsar studies by 5@5. Because this radiation is produced in deep Klein-Nishina regime, it has a rather specific shape - unusually narrow spectra peaked at , where is the wind Lorentz factor. The detection of this radiation would be the first observational test for existence of ultrarelativistic pulsar winds, and would give unique information about the Lorentz factor and the site of creation of the kinetic energy dominated (KED) wind. The large dynamical energy range of 5@5, extending from several GeV to several hundred GeV, would allow such a search for pulsar winds in the most relevant range of Lorentz factors between to .
Another, more traditional, objective for 5@5 would be the detection of inverse Compton -rays from synchrotron nebulae surrounding pulsars - the regions powered by the wind termination shocks (plerions). The TeV radiation detected from the Crab Nebula by many groups (for review see e.g. Catanese & Weekes 1999) agrees reasonably well with model calculations (De Jager & Harding 1992; De Jager et al. 1996; Atoyan & Aharonian 1996; Aharonian & Atoyan 1998; Hillas et al. 1998) performed within the MHD model of Kennel & Coroniti (1984). According to this model, the wind is terminated by a standing reverse shock at a distance of about r = 0.1 pc, the shock in turn accelerates electrons up to energies exceeding and randomizes their pitch angles. The inverse Compton -radiation at GeV/TeV energies, combined with synchrotron optical and X-ray emission, contains information about the relativistic electrons and the nebular magnetic fields in the downstream region of the shock. But the expected -ray fluxes from other pulsar-driven nebulae, based on the observed synchrotron X-ray fluxes as well as on the model assumptions concerning the nebular magnetic fields, contain significant uncertainties. Nevertheless, we believe that the future low-energy IACT arrays should be able to reveal and allow study of the spectral and spatial characteristics of this component of radiation from the synchrotron nebula surrounding the Vela pulsar, and hopefully also from some other pulsars with “spin-down fluxes” (provided that a noticeable part of the spin-down luminosity can be transformed eventually into the shock-accelerated TeV electrons).
2 Performance of 5@5
The concept of 5@5 is basically motivated by the necessity of sensitive “gamma-ray timing explorer” for detailed studies of the characteristics of transient GeV -ray phenomena (Aharonian et al. 2001). In this regard, 5@5 and GLAST present two complementary approaches. While GLAST with its almost steradian field of view will allow an effective monitoring of large number of persistent (quasi-stable) -ray sources, 5@5 can provide a deeper probe of individual highly variable or transient sources. For example, 5@5 can detect any multi-GeV -ray flare with an apparent luminosity111In the case of sources with strong beaming (like pulsars) within a solid angle , or sources moving relativistically towards the observer (like blazars) with Doppler factor , the intrinsic -ray luminosities are smaller than the apparent luminosities by factors and , respectively. of about at ( is the distance to the source normalized to 1 Gpc), lasting only a few hours. Therefore the prime objective of instruments like 5@5 will be studies of high energy transient phenomena like GeV/TeV flares of blazars (and perhaps also microquasars) as well as solitary gamma-ray events like GRBs (Aharonian et al. 2001). The second important objective of 5@5 concerns the detailed -ray spectroscopy of persistent -ray sources in the energy region between 10 GeV and 100 GeV.
In the original paper on the concept “5@5” (Aharonian et al. 2001), the following configuration for the telescope array has been proposed. The system consisting of 5 IACTs is to be installed at the altitude a.s.l., close to the ALMA (the Atacama Large Millimeter Array) site in Northern Chile. Four telescopes are located at the corners, and one in the center of a square with a linear size ; each telescope has an approximately 20-30 m diameter optical reflector, and is equipped with a multi-channel conventional PMT based camera with a pixel size and an effective field of view FoV.
2.1 Detection area, angular and energy resolutions
To understand the potential of 5@5 we need two basic parameters – the effective detection area and the angular resolution as functions of photon energy, approximated in the range from GeV to 100 GeV in the following convenient analytical forms:
| (1) |
and
| (2) |
where E is the energy of the primary -ray photon or electron (Aharonian et al. 2001). The detection area has a strong energy-dependence below 10 GeV, , but at higher energies the detection area increases slowly with energy, . Close to 1 TeV the detection area actually becomes constant, in essence because of the limited field of the view of the camera. The parameter , which corresponds to the half-angle of the cone centered on the source and containing of events at energy , defines the energy dependence of the Point Spread Function (PSF) of the telescope.
The energy resolution of the instrument depends on the energy; at energies above 10 GeV it could be close to 15-20 per cent. In this paper for simplicity we assume an average estimate for the energy resolution, namely a constant value at the level of 20 per cent throughout the entire energy interval.
The above numbers characterizing the basic parameters of 5@5 are based on the preliminary Monte Carlo calculations (Aharonian et al. 2001) and need to be confirmed by independent simulations, especially in the sensitive energy region of primary -rays below 10-20 GeV where the atmospheric cascades consist of only a few generations of secondary particles. Further note that the assumed configuration of telescopes is based on our “best guess”. The optimal configuration of both the individual telescopes (the area of the dish and the field of view and pixel size of the imager) and the system (the number of units and average distance between the telescopes) is a subject for future comprehensive Monte Carlo studies. One cannot exclude that the new performance studies may result in some deviations from the parameters used in this paper. However, we believe that the possible uncertainties in the flux sensitivities should not exceed a factor of 2 or 3. Therefore, the main conclusions of this paper concerning the potential of the “5@5” concept for pulsar studies are rather independent of specific configurations of future sub-10 GeV IACT arrays.

2.2 Background conditions
At energies below 30 GeV the background detected by the system of IACTs operating in the stereoscopic mode is dominated by electromagnetic showers produced by cosmic ray electrons. The dominance of the electronic component is explained by the combination of several factors, in particular (i) by the large, up to a factor of 5 to 10 difference between the energies of electrons and protons producing the same amount of Cherenkov light, (ii) by the high altitude of observations, (iii) by compact (compared with hadronic showers) Cherenkov images of electromagnetic showers, (iv) by significant increase (approximately ) of the electron-to-proton ratio of cosmic rays down to . This offers a unique method for the continuous (on-line) calibration and control of the detector characteristics using the cosmic ray electrons (Aharonian et al. 2001). The differential spectrum of cosmic ray electrons in the region from several GeV to 1 TeV can be approximated as:
| (3) |
The experimental data used for this approximation contain large, up to factor of 2 uncertainties, not only at very high energies, but also in the most critical energy region around 10 GeV. Moreover, in this energy region the flux of electrons entering the Earth’s atmosphere depends on the geomagnetic field, and therefore on the detector location. For the ALMA site with coordinates S and W, the geomagnetic cutoff of the electrons in the vertical direction is about 13 GeV (Quenby & Wenk 1962). This value agrees with the analytical prediction for the dipole magnetic field with the equator shifted to the south to at this longitude (Adams et al. 1981). The estimates in the dipole approximation give geomagnetic cutoffs in the electron spectra close to the horizon in the eastern and western directions at 9.4 GeV and 33 GeV, respectively.
In Fig. 1 we show the detection rates of primary electrons by 5@5 (dotted curves) calculated for 3 different assumptions concerning the geomagnetic cutoff - 0, 10 GeV, and 20 GeV. For the ALMA site the geomagnetic cutoff always exceeds 10 GeV; for a broad range of optimal (for Cherenkov observations) zenith angles , the geomagnetic cutoff varies between 10 and 20 GeV. Since the electron spectrum below the cutoff has a very sharp (almost truncated) form, the cosmic ray background in this energy region is dominated by protons of energy above the geomagnetic cutoff. It should be noted, however, that the geomagnetic cutoff is relevant only to the primary electrons, but not to the secondary ones produced in the atmosphere by effects of high energy protons. Therefore we should expect electron fluxes extending well below the geomagnetic cutoff. The recent measurements of this component of electrons at energies below 10 GeV by the Alpha Magnetic Spectrometer (AMS) indeed revealed non-negligible fluxes comparable with the flux of primary electrons (Alcaraz et al. 2000). Thus this component cannot be a priori neglected in estimations of potential contributors to the background for space and ground based gamma-ray instruments. However, for 5@5 type of instruments the contribution of this component fortunately appears to be quite modest, namely less than the contribution from hadronic showers induced by high energy (above the geomagnetic cutoff) primary protons, but accepted by the telescopes at both the hardware (trigger) and software (image identification) levels as low (sub geomagnetic cutoff) energy electromagnetic showers. The reason is that the trapped electrons spend most of their time in the volume where the AMS did measurements (e.g. Lipari 2002), therefore the flux of secondary electrons close to the Earth’s atmosphere is estimated significantly (by an order of magnitude) lower than the fluxes observed at the height of the AMS orbit (Lipari, private communication).
At an observation altitude of 5 km a.s.l. the 30-100 GeV protons produce approximately the same amount of Cherenkov light than the -rays and electrons with energy . Therefore, the cosmic ray protons with energy above the geomagnetic cutoff initiate showers a non-negligible part of which could be accepted as low energy electromagnetic showers. The detailed study of such “small-proton” events requires detailed Monte Carlo simulations. Our preliminary study shows that the integral rate of such events does not exceed 10 per cent of the detection rate of cosmic ray electrons. Moreover, the further analysis of the shapes of these events should allow an additional (by a factor of 3 or so) suppression of the proton background. Therefore in Fig. 1 we assume that below the rigidity cutoff the cosmic ray background rate does not disappear but stays at the level of several per cent of the “nominal” (i.e. without rigidity cutoff) electron detection rate. Such an approximation should be confirmed by future detailed studies of the misidentified low-energy hadronic showers. Therefore, the detection rates shown in Fig. 1 by the curve without geomagnetic cutoff and by two curves with geomagnetic cutoff at 10 and 20 GeV should be considered as conservative upper and lower limits for the cosmic ray background.
The isotropic diffuse extragalactic background (EGB) measured by EGRET in the energy interval 5-300 GeV is approximated as (Sreekumar et al. 1998)
| (4) |
The fluxes of diffuse galactic -radiation, produced by interactions of cosmic rays with the interstellar medium, and partly contributed by unresolved galactic sources, strongly depend on the galactic coordinates. The largest flux of this component arrives from the direction of the galactic center. For example, the average flux from the region and can be approximated as (Hunter et al. 1997)
| (5) |
The diffuse background from the region , i.e. in the direction of the Anticenter, is approximated as (Hunter et al. 1997)
| (6) |
In the case of location of an weak -ray pulsar close to (or behind) a relatively young supernova remnant (potential sites of cosmic ray accelerators and, therefore, potential high energy -ray emitters), or giant molecular clouds (radiating -rays due to interactions with the “sea” of galactic cosmic rays) additional contamination from these extended sources (with angular radius up to or so) should be taken into account (see e.g. Aharonian 1995). For a “typical” -ray emitting SNR, we use the following approximations
| (7) |
where ; is the total energy of accelerated protons contained in the remnant, is the density of ambient gas, and is the distance to the source.
For a “typical” GMC we adopt the flux
| (8) |
where ; is the the mass of the molecular cloud.
The detection rates of cosmic ray electrons, as well as of the diffuse galactic and extragalactic -ray backgrounds within solid angle (opening angle ) are calculated with
| (9) |
where is the energy spread function for the Gaussian distribution with (energy resolution ).
For the SNR and GMC type of sources with “typical” values for the scaling parameters and , respectively (Aharonian 1995), and assuming angular radius (solid angle ),
| (10) |
In Fig. 1 we show the differential energy distributions of detected background events. The corresponding total number detected counts accumulated during the exposure time (typical observational time of a single source by Cherenkov telescopes during one night) in the energy range 3 to 300 GeV are: (i) from cosmic rays – and for geomagnetic cutoffs at 10 GeV and 20 GeV, respectively; (ii) and counts for the diffuse -ray galactic emission from directions to the Galactic Center and Anticenter, respectively; (iii) counts for the diffuse extragalactic background; (iv) and counts from “typical” SNRs and GMCs. These results show that except for the most “contaminated” directions towards the Galactic Center, the cosmic ray induced background always dominates over the contributions from the extragalactic and galactic -ray backgrounds.
3 High energy gamma-rays from RPPs
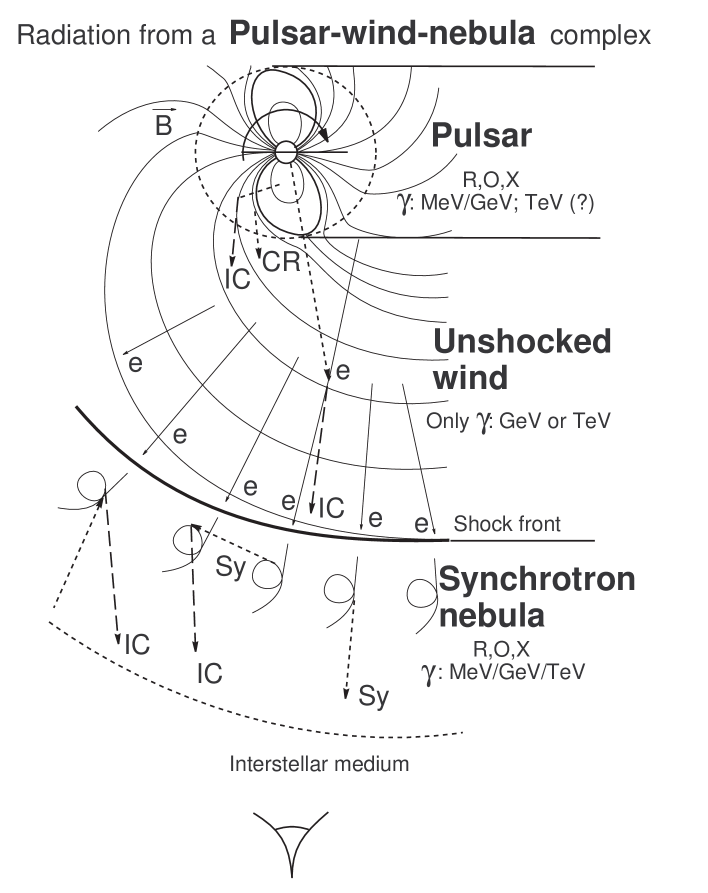
High energy -rays from RPPs are produced in 3 physically distinguished regions through several radiation mechanisms. These sites are schematically shown in Fig. 2. The pulsed -rays are generated in the pulsar magnetosphere limited by the light cylinder. The relativistic wind ejected by the pulsar can itself produce -rays as well as to excite the surrounding nebula which emit electromagnetic emission in a wide electromagnetic band. Gamma-rays from these regions carry crucial information about the pulsar and its interaction with the surrounding medium.
The brightness temperature of the pulsed radio emission is of the order of K (Manchester & Taylor 1977) implies that this emission is generated coherently by beams of relativistic electrons. In the IR/optical and X-ray bands the emission is not coherent; it may have thermal or nonthermal origin. The specific mechanism(s) responsible for the radio (e.g. Lyubarsky 1995) as well as IR/optical and X-ray (Pacini 1971, Becker & Trümper 1997, Yadigaroglu & Romani 1995, Harding & Zhang 2001) remain highly uncertain even for the most prominent objects – the Crab and Vela pulsars.
The situation is somewhat better in the -ray band. In general, three -ray production mechanisms – the curvature radiation, synchrotron radiation, and inverse Compton scattering – contribute to the magnetospheric -radiation from MeV to TeV energies. Also, it is recognized that the pair cascade processes in the magnetosphere, play an important role in the formation of broad-band -ray spectra (Daugherty & Harding 1982). One of the key questions in the theory of -ray pulsars remains the site(s) of -ray production. Presently two type of models are discussed in this regard - the polar cap (Arons 1981, Daugherty & Harding 1982, Usov & Melrose 1995) and outer gap (Cheng et al. 1986, Romani 1996, Hirotani & Shibata 1999) models. In both models the primary -rays are produced by high energy electrons due to the curvature radiation. Some fraction of the curvature photons are converted into the pairs which initiate electromagnetic cascade in the magnetosphere.
The winds of plasma ejected by RPP carry off the major fraction of their rotational energy. While initially the wind is dominated by the Poynting flux, at the termination shock almost all energy is believed to be in the form of kinetic energy of wind’s bulk motion (e.g. Kennel and Coroniti 1984). The mechanism which could provide such an efficient transformation of the rotational energy into the kinetic energy of the cold pair wind is unknown. The identification of this mechanism remains a challenge for the pulsar physics (Michel 1982, Coroniti 1990, Lyubarskii & Kirk 2000).
The bulk Lorentz factor of the unshocked wind is believed to be within . Although the wind is magnetized, it does not emit synchrotron radiation because the electrons of the wind move together with the frozen into the plasma magnetic field. At the same time such a wind could be directly observed through its Inverse Compton (IC) radiation. In fact, the inverse Compton emission of the wind is unavoidable because of bulk motion Comptonization by external low-energy photons of different origin. It has been shown that the illumination of the wind’s base by soft thermal photons from the surface of the neutron star and by nonthermal radiation from the magnetosphere should be accompanied by noticeable IC -ray emission (Bogovalov & Aharonian 2000). The IC photons are expected in the energy interval between 10 GeV and 10 TeV, depending on the wind’s Lorentz factor.
The pulsar winds terminated in the interstellar medium result in strong shocks which lead to the formation of synchrotron and IC nebulae around the pulsars. The broad-band nonthermal emission of the Crab Nebula (De Jager & Harding 1992, Atoyan & Aharonian 1996), calculated within the model of Kennel & Coroniti (1984), is in general agreement with observations. Not that while the spectrum of IC radiation of the unshocked wind is determined primarily by the wind’s Lorentz factor, the latter has less (direct) effect on the broad-band spectrum of the plerion. There are good reasons to believe that faint X-ray synchrotron and IC nebulae should surround many other pulsars as well (Aharonian et al, 1997).
Below we discuss the expected characteristics of -radiation from these three regions for the case of Vela pulsar, the brightest GeV -ray source on the sky which can serve as a standard candle for the low threshold ground-based instruments in the Southern Hemisphere.
3.1 Magnetospheric multi-GeV radiation from Vela
All pulsar models predict that the pulsed radiation above 5 GeV is dominated by the curvature radiation of ultrarelativistic electrons accelerated in the quasi-static electric fields. It is generally believed that the charge density in the pulsar magnetosphere is high enough to screen the electric field parallel to the magnetic field, thus the corotation condition is maintained everywhere except for a few locations. The regions where can exist quite close to the surface of the neutron star – in the polar caps (polar cap/inner gaps model), or at a distance comparable to the light cylinder along the null charge surface defined by the condition , where the corotation charge density changes sign (outer gap model) (see, however, Hirotani & Shibata 2001).

In the polar cap model (Arons 1981, Daugherty & Harding 1982) acceleration of primary electrons occurs at distances of an order of the neutron star radius. These electrons are accelerated up to eV and produce curvature radiation (CR) with energy of about . Although this radiation initially is emitted along the magnetic field lines, during the motion of -rays in nonuniform magnetic field the angle between the wave vector of the curvature photons and the magnetic filed line becomes quite large, so the -rays interacted with the B-field to produce electron-positron pairs. The optical depth of the pulsar magnetosphere drastically increases with -ray energy. In the polar cap model this leads to a very sharp cutoff around 10 GeV.

In the outer gap model (Cheng et al. 1986, Romani 1996) the electrons are accelerated at larger distances from the neutron star with essentially reduced magnetic field, therefore the pair production process becomes less significant. The high energy cutoff in the -ray spectrum is defined by the exponential cutoff of the curvature radiation and by the high energy tail of the electron spectrum. For the truncated electron spectrum, the resulting -ray spectrum has the following form
| (11) |
where is the cutoff energy of the curvature radiation.
The predicted spectra of pulsed -ray emission by the polar cap and outer gap models (e.g. Thompson 2001) are shown in Fig. 3. The absolute fluxes in both cases are normalized to the fluxes reported by EGRET below several GeV (Kanbach et al. 1994). The corresponding differential count rates are shown in Fig. 4. The -ray detection rates are calculated from
| (12) |
where is the energy spread function; the acceptance factor is due to the collection of photons within the angle equal to the 1 sigma angular resolution. The background count rates are defined as
| (13) |
where . The calculations of the integral count rates above GeV yield the following values: and for the polar cap and outer gap models, respectively, the background detection rates are and for the 10 GeV and 20 GeV geomagnetic cutoffs, respectively.
The minimum time for detection of a signal at 5 statistical significance level is defined from , where is the number of counts in the direction to the source, and is the counts in the “off direction”. According to this condition, a 5 DC-signal from the Vela would be detected by 5@5 after 0.9 sec and 1.8 sec observations of fluxes predicted by outer gap and polar cap models, respectively, assuming that the observations are performed at zenith angles corresponding to approximately 10 GeV geomagnetic cutoff. The difference in the total count rates in these two models can be measured on the level of 5 after approximately 3 sec of observation.
The 5@5 type instruments should detect GeV -rays from many other pulsars as well. To estimate qualitatively the minimum detectable fluxes we assume that the spectrum of Vela is more or less typical for other pulsars, and accept a conservative estimate for the detection rate calculated for Vela within the polar cap model, . Then, we arrive at a conclusion that 3 h observations time should be sufficient to detect unpulsed (DC) -ray signals from pulsars at the level of 3 to 10 mVela depending on the available observation angles and corresponding geomagnetic cutoffs. The pulsars with energy spectra steeper than the spectrum of Vela would require more time to achieve such a sensitivity. At the same time, for pulsars with spectra harder than Vela in the energy region above 5 GeV, a deeper probe can be performed for the same observation time.
3.2 Magnetospheric TeV gamma rays ?
The high energy -rays produced in the inner magnetosphere are heavily absorbed before they escape the pulsar, therefore we do not generally expect magnetospheric TeV -ray emission except for millisecond pulsars that have relatively modest surface magnetic field of about G (see e.g. Bulik, Rudak & Dyks 2000). Within the outer gap models, non-negligible TeV -ray fluxes from pulsars like Vela have been predicted by Romani (1996) and Hirotani (2001). The basic idea is the following. The electrons responsible for the GeV curvature radiation should have Lorentz factor of about or more, thus in the case of sufficient photon fields these electrons could radiate also through the inverse Compton scattering. At first glance, although the synchrotron radiation of secondary electrons may serve as a natural target to support this channel of -radiation, but it has been pointed out by Kwok et al (1991) that the TeV electrons have a small chance colliding with the synchrotron photons because they both move in the same direction. Thus, the production of TeV emission of inverse Compton origin requires other target photon field(s) which would cross the trajectory of primary electrons. Also, the magnetic field in the production region should be rather weak, G (Usov 1983) in order to avoid the -ray absorption. If these two conditions are somehow fulfilled in the GeV -ray production region, it is then easy to estimate the expected TeV -ray flux.
The outer gap model predicts that the bulk of -rays is produced through the curvature radiation. The spectrum of this radiation is characterized by a high energy cutoff at , defined by the electron Lorentz factor and the curvature radius of the magnetic field line (Ochelkov & Usov 1980). Therefore the Lorentz factor of electrons can be estimated from cutoff energy in the observed -ray spectrum, provided that the cutoff does not have other origin, i.e., it is the result of -ray absorption. The intensity of the curvature radiation, , depends on the Lorentz factor, the total number of accelerated electrons , and on the curvature radius. Some of the curvature photons can be converted into secondary pairs which in their turn would emit synchrotron photons and thus modify the initial CR spectrum. But the full energy flux of -rays, despite of possible spectral modifications, remains close to because the total energy of emission is conserved (we neglect here the energy left with the cooled secondary electrons). This implies , where is the distance to the source and is the radiation beaming solid angle. This condition allows us to find the parameter from the observed -ray luminosity of the pulsar with an uncertainty contained in the product . Although the combined uncertainty in this parameter could be as large as a factor of 10, it does not have any effect on the estimate of the magnetospheric TeV flux if we normalize the calculations to the observed MeV/GeV flux. Indeed, the same electrons responsible for the curvature radiation in the MeV/GeV range, emit also -rays through the IC channel boosting the soft ambient photons to TeV energies. The spectrum of this radiation is calculated with , where is the differential cross section of the inverse Compton scattering of an electron with Lorentz factor and velocity interacting with a photon with energy and velocity of motion ; is the density of seed photons.
While the parameter is derived from the observed MeV/GeV -ray energy flux, the electron Lorentz factor is estimated from the observed cutoff in the -ray spectrum. Thus, we can write a simple relation between the resulting time-averaged energy flux of magnetospheric TeV -rays of IC origin, , and the observed energy flux of -rays integrated from 100 MeV to 30 GeV,
| (14) |
where is the electron Compton wavelength. Apparently, the light curve of the TeV IC radiation follows exactly the light curve of the MeV/GeV CR radiation. Therefore, as mentioned above, this estimate of the IC TeV flux does not depend on the actual angular distribution of -ray emission and on the distance to the source if we normalize the calculations to the observed energy flux in MeV/GeV -rays.
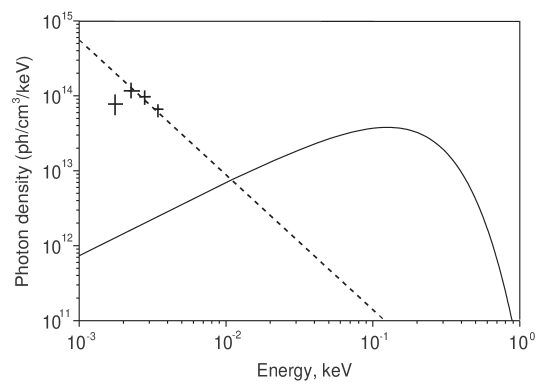
At the same time, the IC photon flux significantly depends on the density and the spectrum of soft seed photons. The densities of these photons at the light cylinder of Vela are shown in Fig. 5. It consists of two components. The thermal emission of the neutron star is described by a blackbody spectrum. Several fits were proposed for this component (Ögelman et al. 1993, Page et al. 1996, Seward et al. 2000). Here we use the following parameters , , assuming . In Fig. 5 we take into account the possibility for the thermal photon density to fall off with distance to the star faster than since the angular distribution of the photons tends to be mono-directional at the motion from the star. This effect decreases the photon density at the light cylinder by a factor of 2. At larger distances the photon density decreases as . The power-law (most likely, nonthermal) component of soft emission dominates over the thermal component at optical and longer wavelengths. Optical emission from Vela was measured by Manchester et al. (1978), Ögelman et al. (1989) and Nasuti et al. (1997). The densities of optical photons at the light cylinder of Vela based on the measurements of Nasuti et al. (1997) are shown in Fig. 5. The recent observations of Koptsevich et al. (2001) with VLT show that the optical emission seems to be smoothly continued into the near IR region down to 1 eV. Unfortunately, no data below 1 eV is available. The power-law approximation to the observed optical data is shown in Fig. 5 by the dashed line.
Fluxes of the magnetospheric TeV radiation, calculated for two different assumptions for the position of the low-energy IR cutoff, are shown in Fig. 3. While the cutoff at 0.01 eV gives -ray spectrum with a distinct line-type feature around 20 TeV, the infrared cutoff at 0.001 eV makes the spectrum broader with a maximum shifted to several TeV. Although the expected fluxes seem to be detectable by 5@5, the search for such a pulsed multi-TeV component of magnetospheric radiation could be done earlier (and perhaps more effectively) by the IACT arrays like CANGAROO-3 and H.E.S.S. that are better designed for detection of TeV -rays.
3.3 Radiation from the unshocked wind
The ultrarelativistic winds from the Crab and Vela pulsars are believed to be essentially cold, therefore the regions of the unshocked wind outflows should be under-luminous (no synchrotron radiation). This is well seen in the Chandra X-ray images of the nebulae surrounding the Crab (Weiskopff et al. 2000) and Vela (Helfand et al. 2001) pulsars. However these regions do not have to be similarly dark at higher frequencies. In fact, the unshocked ultrarelativistic winds can produce non-negligible high energy -radiation via IC radiation of ultrarelativistic (in the frame of observer) electrons moving through the ambient photon fields. Even in the case of isolated pulsars, an adequate photon density of target photons of both thermal and nonthermal origins (see Fig. 5) can be supplied by the pulsar itself.
The radiation features of the unshocked wind in the Crab has been discussed by Bogovalov & Aharonian (2000). A similar picture should occur in the wind from the Vela pulsar, although the structures of the winds in these pulsars need not be identical. The recent observations of the compact and rather weak nebula surrounding the Vela pulsar indicate that the ratio of the Poynting flux over the kinetic energy flux (the so called magnetization parameter) is close to 1 (Helfand et al. 2001), while in the Crab it should be of order (Kennel and Coroniti 1984). This parameter describes the ratio of the Poynting flux to the kinetic energy flux of the wind. The Poynting flux in the wind is equal to , where is the total kinetic energy flux of the wind, and correspondingly . The longitudinal distribution of the wind Lorentz factor, after the acceleration, follows directly from the energy conservation law. In the simplest case of a wind with isotropic density, the Lorentz factor of the wind can be presented as (Bogovalov 1999), where is the initial Lorentz factor of the plasma produced in the pulsar magnetosphere (Daugherty & Harding, 1982), is the longitude above the rotational equator of the pulsar. The recent Chandra observations of Vela give (Helfand et al. 2001). This implies that even for the wind with an (quasi) isotropic density the energy flux is concentrated at the equatorial plane which explains (Bogovalov & Khangoulian 2002) the observed toroidal structures in the inner parts of the Crab (Weiskopff et al. 2000) and Vela (Helfand et al. 2001) nebulae.
An important feature of the unshocked wind is that the electrons have, under certain conditions, nonzero toroidal velocity. The energy and angular momentum conservations result in the relation (Bogovalov & Tsinganos 1999)
| (15) |
Here is the angular velocity of the pulsar. It can be shown that this equation is valid also for the plasma flow in an arbitrary non-axisymmetric magnetic field. Therefore, if the plasma is somehow accelerated to a Lorentz factor , the azimuthal angle of the wind is equal to the ratio (Bogovalov & Aharonian 2000), whether the wind is kinetic energy dominated or not. Here is the light cylinder, and is the distance to the axis of rotation. From this equation follows that the acceleration of the wind in the equatorial plane to is possible at distances exceeding the radius of the light cylinder. Also, this equation implies that there is always nonzero angle between the velocity of electrons and the radial direction of photons. This angle is defined as . Therefore, the IC scattering of electrons on the soft thermal and nonthermal emissions of the neutron star/pulsar inevitably results in production of high energy -rays.
The spectral features of the wind emission depend on the particle flux in the wind and the Lorentz factor as
| (16) |
We may expect that of the wind from the Vela pulsar lies in the same range as in the Crab pulsar (). Here we treat as a free parameter, and determine through Eq. (16). For the Vela pulsar with , the magnetization parameter was assumed .
In Fig. 6 we show the spectra of the IC radiation of the wind for several values of . The IC emission of the wind consists of two “thermal” and “nonthermal” components produced via the inverse Compton scattering of the wind electrons on the thermal and nonthermal soft photons of the neutron star/pulsar, respectively. The spectra of these two components are rather different. Because of the scattering of the monoenergetic wind electrons on the hot thermal photons with narrow Planckian distribution, the spectrum of the “thermal” IC component has a specific shape with a pile-up (thin solid curves). The latter is especially pronounced for large Lorentz factors of the wind because the Compton scattering occurs in deep Klein-Nishina regime. The broad spectrum of the nonthermal soft radiation makes the resulting IC -ray spectrum also very broad (thin dashed curves). Although at low energies this component dominates over the “thermal” IC component, fortunately it cannot mask the pile-up of the “thermal” IC component that contains direct and unambiguous information about the wind Lorentz factor. This is explained by the dominance of the thermal radiation over the soft nonthermal emission above 10 eV (see Fig. 5). Both -ray components are generally expected to be modulated with the pulsar period. While in the case of axially uniform wind the periodic character of the “thermal” IC radiation could be significantly destroyed, but the “nonthermal” IC component should be always periodic. This constraint gives us an additional possibility to separate these two components. And finally, it should be noted that the “nonthermal” IC component can be formed only if the nonthermal soft emission has magnetospheric origin. Otherwise, i.e. if the production region of the soft nonthermal photons coincides with the wind acceleration region (which formally cannot be excluded), the “nonthermal” IC component would be strongly suppressed because both the electrons and photons move in the same direction.


The -ray fluxes of the unshocked wind shown in Fig. 6 are calculated assuming that the wind is accelerated at the minimum possible distance from the pulsar light cylinder, . We also show the flux sensitivities of 5@5 corresponding to two different assumptions on the geomagnetic cutoff (0 and 10 GeV). It is seen that in either case the sensitivity and the energy resolution of 5@5 should be sufficient to detect the distinct pile-up in the “thermal” IC radiation spectrum and to discriminate it from the broad-band emission components associated with the “nonthermal” IC radiation of the wind, as well as from the broad-band smooth IC radiation originating in the nebula (see Sec. 3.4), provided that the wind is formed not far from the light cylinder. Unfortunately, even at this most favorable condition, the detection of the radiation of unshocked wind of Vela seems not achievable for GLAST.
In Fig. 7 we show the detection rates of IC -rays from the unshocked wind of the Vela pulsar calculated for two sites of the wind acceleration (more specifically, in the sites of transition of the wind from the Poynting-flux-dominated to kinetic-energy-dominated regime) — (solid curves) and (dashed curves). Although the difference in these two values of is quite small, the difference in expected fluxes and corresponding detection rates is significant. From results presented in Figs. 6 and 7 we may conclude that the detection of the IC radiation from unshocked wind of the Vela pulsar is possible only if the wind acceleration takes rather close to the light cylinder, otherwise the IC -ray flux would be strongly suppressed. Are there special reasons to believe that the wind is accelerated so close to the light cylinder ? We obviously do not know the exact answer to this question. However, we may refer the reader to Chiueh, Li & Begelman (1998) who concluded, from general analysis of an ideal MHD flow, that the acceleration of the wind to a low state is possible only in the immediate neighborhood of the light cylinder. Bogovalov (2001) has argued that the wind could be accelerated to at the light cylinder due to the magneto-centrifugal mechanism. But these are theoretical arguments. What is most needed is the direct observational evidence. The results in Figs. 6 and 7 show that 5@5 should be able to give an answer to this important question.
3.4 IC gamma-radiation from the synchrotron nebula
The termination of pulsar winds leads to randomization of velocities of relativistic electrons and formation of bubbles of ultrarelativistic magnetized plasma called pulsar driven nebulae or plerions. The nebulae surrounding the Crab and Vela pulsars are the most prominent representatives of plerions in our Galaxy. The wind electrons injected into the Crab Nebula radiate almost of the pulsar’s rotational losses in the form of synchrotron X-rays. The size of the X-ray nebula is constrained by the short lifetime of multi-TeV electrons caused by their synchrotron cooling. The nebula in X-rays above 0.1 keV has a characteristic toroidal shape with two jet-like features along the axis of rotation. The linear size of the X-ray toroidal structure is about . The basic properties of the Crab nebula are well described by the hydrodynamical interaction of the cold supersonic pulsar wind with the interstellar medium (Kennel & Coriniti 1984).
The plerion in Vela consists of a relatively modest compact nebula of angular size of 1 arcminute. For the distance to the source of about 250 pc this corresponds to a linear size of . The recent Chandra observations revealed the structure of the compact nebula which appeared quite similar to the Crab with the same toroidal shape in the equatorial region and jet-like features along the pulsar’s rotation axis. At the same time, the luminosity of the Vela nebula in the 0.1 -10 keV band is only of the spin down luminosity of the pulsar. The small size and the low X-ray luminosity of the compact nebula was interpreted as indication of a large magnetization parameter of the wind in Vela, (Helfand et al. 2001), although alternative interpretations cannot be excluded.
The fluxes of unpulsed -ray emission reported by EGRET in the energy interval between 100 MeV and 10 GeV from Vela are shown in Fig. 3. The limited angular resolution of EGRET (of about at 1 GeV) does not allow any conclusion concerning the size of the -ray production region. Because of the low X-ray luminosity of the compact nebula, Fierro et al. (1998) have suggested that the unpulsed GeV emission is produced by the pulsar itself. However, this radiation could be produced in a larger region extended up to 1 degree or so. The Vela pulsar and the compact nebula are embedded in a hard X-ray (2.5 -10 keV) structure — the so-called Vela X. If Vela-X is energized by the pulsar wind, the pressure in this bubble with volume should be , yr being the age of the pulsar. For the pressure in the surrounding remnant of the supernova explosion , (Markwart and Ögelman 1997), the radius of the bubble is estimated to be which corresponds to angular radius, i.e. quite close to the angular size of Vela-X (Willmore et al. 1992). Can this interesting coincidence be interpreted as a hint that Vela-X is in fact a plerion harboring the energetic particles ejected by the pulsar? Interestingly, the power-law extrapolation of the spectrum of unpulsed GeV emission (Fierro et al. 1998) towards higher energies matches the tentative TeV flux reported by the CANGAROO collaboration (see Fig. 3). Given the large uncertainties both in the flux and position/size of the TeV signal, we perhaps should not overestimate the significance such a coincidence. Moreover, the TeV flux shown in Fig. 3 is too high to be explained by the most natural -radiation mechanism in the nebula, by the inverse Compton scattering on 2.7 K CMBR, unless we assume unusually low magnetic field in the production region. Also, the energy spectrum of -rays predicted by this mechanism is quite different from a simple power-law approximation in the broad energy region.

Nevertheless, in order to demonstrate the detection capability of 5@5 it is interesting to adopt, as a working hypothesis, that the radiation of the extended region in Vela is described by a power-law spectrum of -rays extending from GeV to TeV energies as shown in Fig. 3. The expected differential count rates corresponding to this extrapolation are shown in Fig. 8. The integral count rate of the unpulsed emission is estimated as . In Fig. 8 we also show the background rates caused by cosmic rays within the 0.5 ∘angular cone (the angular radius of Vela X) for three values of the geomagnetic cutoff in the electron spectrum. In particular, for 10 GeV geomagnetic cutoff the corresponding integral background count rate is which implies that the unpulsed emission from Vela-X can be detected at the statistical significance level for the observation time of about 6 min.
The large -ray photon statistics and good angular resolution should allow spectroscopic measurements and determination of the size of extended plerionic component of -radiation in a broad energy region extending from several GeV to TeV. Note, however, that such important spectrometric and morphological studies above 100 GeV can be performed already in the near future by the H.E.S.S. and CANGAROO-3 IACT arrays. At lower energies down to 1 GeV, GLAST will contribute key information.
4 Search of periodical signal from radio-quiet RPP
The nature of 170 unidentified point-like sources of MeV -rays detected by EGRET (Hartman et al. 1999) remains mostly unknown. It is likely that a significant fraction of these objects belongs to RPPs with radio beams which do not cross the Earth orbit (Grenier 2000). The beams of -ray emission are believed to be much wider than the radio beams (see e.g. Romani and Yadogaroglu, 1995; Harding and Zhang, 2001). Therefore, a chance to detect -rays from a pulsar can exceed the chance to detect radio emission. Obviously the most direct way to identify the unidentified EGRET sources with pulsars would be the detection of pulsed -radiation.
The search for periodic signals in the -ray data is not a simple issue (see e.g. Chandler et al. 2001). The pulsed components of all EGRET pulsars have been discovered only after applications of information about the period and phase obtained at other energy bands. However, in many cases the time structure at different wavelengths could be different. Therefore, it is crucial to search for periodic -ray signals without relying on observations at other energy bands. In turn, this search requires an adequate -ray photon statistics. The statistics of photons increases with observational time, and in principle could be very large, in particular for large-field-of-view instruments like GLAST. However, the valuable observation time can be increased infinitely only if the source of the periodic signal is a perfect clock. Pulsars are not perfect clocks. In fact, their periods increase with time due to the rotational losses. The phase of the signal varies with time as , where and is the period of rotation, is the time of observations. The variation of the phase due to the change of the period of rotation can be neglected while . Thus, the duration of the total time interval for the search of a periodical signal in absence of an a priory information about the period and period derivative should satisfy the condition . For example, the first derivative of the rotational frequency of the Crab pulsar requires observation time 10 h. On the other hand, the number of detected photons should be large enough to allow determination of the period. Let’s assume that the light curve of the source consists of a single narrow pulse. This assumption agrees with the observed pulse shapes above 5 GeV for Crab, Vela, PSR 1706-44 and Geminga pulsars (Thompson 2001). In this case the epoch folding method allows accumulation of pulsed photons. Let’s assume that the full phase consists of bins, and that the pulse is located within one of these bins. Then, the m-sigma detection of the -ray signal in one trial requires , where is the total background count rate, is the number of bins in the light curve. Below we adopt 5 condition for detection of the periodical signal. This implies that the probability to detect signal by chance multiplied to the number of the trial light curves should be less then . The number of the trial light curves , where is the maximum possible frequency (corresponding to a millisecond pulsar) and is the minimum possible frequency, is the frequency separation. Thus, for the accepted parameters and therefore the probability to detect the pulse by chance in one trial should be less then . This means that the -ray signal should be detected at the level of m=7.5.
It is believed that GLAST will be able to detect as many as 250 pulsars, half of which would be unknown at other wavelengths (McLaughlin & Cordes 2000). Also, GLAST can reveal the pulsed emission component from a number of unidentified EGRET sources if they have indeed pulsar origin. The same can be done by 5@5 type instruments. Moreover, 5@5 should be able to identify the future “unidentified GLAST” sources with pulsars if the spectra of these objects extend beyond 5 GeV. For the background count rate , and assuming (a standard time of observations of a source per night) and , for we obtain the -ray count rate . This corresponds to the flux level of approximately 3 mVela if we adopt the minimum possible count rate from Vela as predicted by the polar cap model.
5 Irregular Variability of the -ray radiation from radio pulsars
The 5@5 telescope could be quite effective for studies of -ray flux variability from radio pulsars. Presently at least two types of irregular time behavior of radio pulsars are established. One of them is the so-called “timing noise” in which the pulse phase and/or frequency of radio pulses drift stochastically (Helfand et al. 1980, Cordes & Helfand 1980). Another type of irregularity in the radio emission from radio pulsars are ”glitches” – sudden increase in the pulse frequency produced by apparent change in the momentum of inertia of neutron stars. These rather rare events occur mostly in young pulsars (Reichly & Downs 1971, Lyne 1996). Glitches were observed from 27 pulsars (Wang et al. 2000).
The Vela pulsar seems to be the best object to study the irregular variability of pulsars in -rays by 5@5. A dozen glitches have been recorded over the past three decades from this source. EGRET data show that the flux in the range above 100 MeV is variable. Remarkably, there is evidence of variation of the spectral index of the radiation, as well as of the relative intensity of two peaks of the light curve (Ramanamurthy et al. 1995). The variability of -ray emission from the Vela pulsar detected by EGRET has been derived for 14-day observations but the photon flux was too low to investigate the variability on smaller time scales. 5@5 is expected to allow detection and resolution of the -ray variability on sub-hourly timescales.
6 Summary
The high flux sensitivity of 5@5, supported with unprecedented photon statistics in one of the most informative windows of electromagnetic radiation for the pulsar physics, , should allow detailed studies of spectral and temporal characteristics of the -ray pulsars detected by EGRET, as well as very effective searches for pulsed components from unidentified EGRET sources. The energy and angular resolutions of 5@5 can provide unique studies of other radiation components of pulsars associated with the unshocked winds and the synchrotron nebulae (plerions) in a broad energy band extending from several GeV to 1 TeV. We believe that the new generation sub-10 GeV ground-based -ray instruments like 5@5 can provide crucial insight into the physics of pulsars and their interactions with surrounding interstellar medium.
7 Acknowledgments
We are grateful to P. Lipari for his comments concerning the interpretation of the secondary electron fluxes detected at energies below the geomagnetic cutoff by AMS. We thank D. Thompson and the second (anonymous) referee for their critical remarks which improve the paper significantly. SB thanks MPI für Kernphysik for hospitality and support during his work on this paper. The work was partially supported by collaborative INTAS-ESA grant N 99-120.
References
- \harvarditemAdams, Silberberg and Tsao 1981adams Adams J.H., Silberberg R., Tsao C.H. ”Cosmic Ray effects on microelectronics, Part I, The near-Earth Particle Envonmental”, NRL Memorandum Report 4506, Naval Research Laboratory, Washington DC 20375-5000, USA, 1981 \harvarditemAharonian1995ECRS Aharonian F.A., 1995, Nucl. Phys. B, 39A, 193 \harvarditemAharonian et al.1996ahatki Aharonian F.A., Atoyan A.M., Kifune T. 1997, MNRAS, 291, 162 \harvarditemAharonian & Atoyan1998aharon98 Aharonian F.A., Atoyan A.M. 1998, in Proc. ”Neutron stars and Pulsars”, (Eds. Shibazaki et al.) Universal Academy Press Inc. p. 439 \harvarditemAharonian et al.2001aharon01 Aharonian F.A., Konopelko A.K., Völk H.J., Quintana , 2001, Astropart. Phys., 5, 335. \harvarditemAlcaraz et al.2000AMS Alcaraz et al. 2000, Physics Letters B, 484, 10 \harvarditemArons1981arons81 Arons J., 1981, ApJ, 248, 1099 \harvarditemAtoyan & Aharonian1996atah Atoyan A.M., Aharonian F.A., 1996, MNRAS, 278, 525 \harvarditemBall & Kirk2000bkirk00 Ball L., Kirk J. 2000, Astropart. Phys., 12, 335 \harvarditemBecker & Trumper1997trbeck Becker W., Trümper J., 1997, A&A, 326, 682 \harvarditemBogovalov1999bog99 Bogovalov S.V., 1999, A&A, 349, 1017 \harvarditemBogovalov & Tsinganos1999bogtsin Bogovalov S.V., Tsinganos K. 1999, MNRAS, 305, 211 \harvarditemBogovalov & Aharonian2000bogah00 Bogovalov S.V., Aharonian F.A., 2000, MNRAS, 313, 504 \harvarditemBogovalov2001bog01 Bogovalov S.V. 2001, A&A, 367, 159 \harvarditemBogovalov & Khangoulian2002abog02a Bogovalov S.V., Khangoulian D.V., 2002, Pis’ma v AZh (Astron. Letters), 28, 373 \harvarditemBuckley et al.2001buckley Buckley J. et al., 2001, astro-ph/0201160 \harvarditemBulik, Rudak & Dyks2000bulik Bulik T., Rudak B. & Dyks J., 2000, MNRAS, 317, 97 \harvarditemCatanese & Weekes1999cweekes Catanese M., Weekes T.C. 1999, PASP, 111, 1193 \harvarditemChandleret al.2001chandler01 Chandler A.M. et al. 2001, ApJ, 556, 59 \harvarditemCheng et al.1986Chenghr Cheng K.S., Ho C., Ruderman M, 1986, ApJ, 300, 500 \harvarditemCordes & Helfand1980ch Cordes J.M., Helfand D.J. 1980, ApJ, 239, 640 \harvarditemChiueh, Li & Begelman1998chiueh Chiueh T., Li Z.Y., Begelman M.C. 1998, ApJ, 505, 835 \harvarditemCoroniti1990coroniti Coroniti F.V., 1990, ApJ, 349, 538 \harvarditemDaugherty & Harding1982dh Daugherty J.K, Harding A., 1982, ApJ, 252, 337 \harvarditemDe Jager & Harding1992djager De Jager O.C., Harding A., 1992, ApJ, 396, 161 \harvarditemde Jager et al.1996osse De Jager O.C., Harding A., Strickman M.S., 1996, ApJ, 460, 729 \harvarditemde Jager & Harding1998jagerharding98 De Jager O.C., Harding A. 1998, in Proc. ”Neutron stars and Pulsars”, (Eds. Shibazaki et al.) Universal Academy Press Inc. p. 487 \harvarditemFierro et al.1998fierro Fierro J.M., Michelson P.F., Nolan P.L., Thompson D.J., 1998, ApJ, 494, 734 \harvarditemGehrels & Michelson1999gehrels Gehrels N. & Michelson P., 1999, Astropart. Phys., 11, 277 \harvarditemGrenier2000grenier00 Grenier I.A. 2000, A&A, 364L, 93 \harvarditemHarding1996harding96 Harding A. 1996, Space Science rev. 75, 257 \harvarditemHarding2001harding01 Harding A. 2001, in: Proc. “High energy gamma-ray astronomy” (Eds. F.A. Aharonian & H.J. Völk), AIP Conf. Proc. 558, Melville, New York, p.115 \harvarditemHarding & Zhang2000zharding Harding A., Zhang B., 2001, ApJ, 548, 37 \harvarditemHartman et al.1999hartman Hartman et al. 1999, ApJS, 123, 79 \harvarditemHelfand et al.1980ht Helfand D.J., Taylor J.H., Backus P.R., 1980, ApJ, 237, 206 \harvarditemHelfand et al.2001helfand Helfand D.J., Gotthelf E.V., Halpern J.P., 2001, ApJ, 556, 380 \harvarditemHibschman & Arons2001harons Hibschman J.A., Arons J., 2001, ApJ, 554, 624 \harvarditemHillas et al.1998hillas Hillas A.M. et al., 1998, ApJ, 503, 744 \harvarditemHirotani & Shibata1999hshibata Hirotani K., Shibata S. 1999, MNRAS, 308, 54 \harvarditemHirotani & Shibata2001hshibata Hirotani K., Shibata S. 2001, ApJ, 558, 216 \harvarditemHirotani2001hirotani Hirotani K., 2001, ApJ, 549, 495 \harvarditemHunter et al.1997hunter Hunter, S. D., Bertsch, D. L.; Catelli, et al. 1997, ApJ, 481, 205 \harvarditemKanbach ey al.1994kanbach Kanbach G. et al. 1994, A&A, 289, 855 \harvarditemKaspi et al.2000kaspi Kaspi V.M., Lachey J.R., Mattox J., Manchester R.N., Bailes M., Pace R. 2000, ApJ, 528, 445 \harvarditemKawai et al.1998kawai Kawai N., Tamura K., Shibata S., 1998, in: Neutron Stars and pulsars. Ed(s). Shibazaki N. et al. Universal academy press., Tokyo, Japan, 449 \harvarditemkennel & Coroniti1984kc Kennel C.F., Coroniti F.V. 1984, ApJ, 283, 710 \harvarditemKoptsevich et al.2001koptsevich Koptsevich A.B., Lundqvist P., Sollerman J., Shibanov Yu.A., Wagner S., Int. conference Neutron Star Physics, Sankt-Petersburg, Abstracts, 2001 \harvarditemKrennrich2001Krennrich Krennrich F., 2001, astro-ph/0101120 \harvarditemKwok, Cheng & Lau1991kwok Kwok P.W., Cheng K.S., Lau M.M. 1991, ApJ, 379, 653 \harvarditemLipari2002lipari Lipari P. 2002, Astropart. Phys., 16, 295 \harvarditemLyne1996lyne Lyne A.G., 1996, in Pulsars: Problems and Progress, Ed.S.Jonston, M.A. Walker and M.Bailes (ASP Conf. Ser. 105), p.73 \harvarditemLorimer2001lorimer Lorimer D.R., in Proc. ”The neutron star-black hole connection”. Eds. Kouveliotou C., Ventura J., van den Heuvel E., 2001, Kluwer Acad. Publishers, the Netehrelands, p.3 \harvarditemLyubarsky1995lyub95 Lyubarsky Yu.E. 1995, in: Sunayev R.A. (ed.) Physics of pulsars. Astrophysics and Space Physics reviews, Harwood Academic Publishers \harvarditemlyubarskii & Kirk2001luyb01 Lyubarskii Yu.E., Kirk J., 2001, ApJ, 547, 437 \harvarditemManchester & Taylor1977mantay Manchester R.N., Taylor J.H., 1977, Pulsars, W.H.Freeman and company, San Francisco \harvarditemManchester et al.1978manchester Manchester R.N., et al., 1978, MNRAS, 184, 159 \harvarditemMarkwardt & Ögelman1997mo Markwardt C.B., Ögelman H.B., 1997, ApJ, 480, L13 \harvarditemMcLaughlin & Cordes2000cordes McLaughlin M.A., Cordes J.M., 2000, ApJ, 538, 818 \harvarditemMichel1982michel Michel F.C., 1982, Rev. Mod. Phys. 54, 1 \harvarditemNasuti et al.1997nasuti Nasuti F.P. et al., 1997, A&A, 323, 839 \harvarditemNel at el.1996nel Nel H.I. et al. 1996, ApJ, 465, 898 \harvarditemOgelman et al.1989ogelman89 Ogelman H., et al., 1989, ApJ, 342, L83 \harvarditemOgelman et al.1993ogelman Ogelman H., et al.,1993, Nature, 361, 136 \harvarditemOchelkov & Usov1980ochelkov Ochelkov Iu.P., Usov V.V., 1980, Ap&SS, 69, 439 \harvarditemPacini1971pacini Pacini F., 1971, ApJ, 163, L17 \harvarditemPage et al.1996page Page et al., 1996, Proc. Intern. Conf. on X-ray Astronomy and Astrophysics Rötngenstrahlung from the Universe. Würzburg MPE Report 263, 173 \harvarditemQuenby & Wenk1962qw Quenby J., Wenk G. 1962, Phil. Mag., 7, 1457 \harvarditemRamanamurpthy et al.1995ram Ramanamurthy P.V. et al., 1995, ApJ, 450, 791 \harvarditemRomani1996romani96 Romani R.W., 1996, ApJ, 470, 469 \harvarditemRudak & Dyks2000rudak Rudak B.T., Dyks J., 2000, MNRAS, 317, 97 \harvarditemSeward et al.2000seward Seward F.D. et al., 2000, ApJ, 536, 948 \harvarditemSreekumar et al.1998sree Sreekumar P., Bertsch D.L., Dingus B.L. et al., 1998, ApJ, 494, 523 \harvarditemThompson1999thompson99 Thompson D.J., 1999, ApJ, 516, 297 \harvarditemThompson2001thompson00 Thompson D.J., 2001, in: Proc. “High energy gamma-ray astronomy” (Eds. F.A. Aharonian & H.J. Völk), AIP Conf. Proc. 558, Melville, New York, p.103 \harvarditemUsov1983usov83 Usov V.V., 1983, Nature, 305, 409 \harvarditemUsov & Melrose1995usov Usov V.V., Melrose D. 1995, Australian Journal of physics, 48:4, 575 \harvarditemWang et al.2000wang Wang N. et al., 2000, MNRAS, 317, 843 \harvarditemWeiskopff et al.2000weiskopff Weiskopff M.C., Hester J.J., Tennant A.F. et al. 2000, ApJ, 526, L81 \harvarditemWillmore et al.1992willmore Willmore A.P. et al., 1992, MNRAS, 254, 139 \harvarditemYadogaroglu & Romani1995Yadog Yadigaroglu I.A., Romani R.W., 1995, ApJ, 449, 211 \harvarditemYoshikoshi et al.1997yoshi Yoshikoshi T., et al., 1997, ApJ, 487, L65