An unexpectedly high AGN fraction in red cluster galaxies
Abstract
As part of a program to study the evolution of active galactic nuclei (AGN) in clusters of galaxies, we present our results for Abell 2104. A deep Chandra observation of this massive, cluster reveals a significant X-ray point source excess over the expectations of blank fields, including eight X-ray counterparts with mag. Our spectroscopy shows that all six X-ray sources associated with red counterparts are cluster members and their X-ray properties are consistent with all of them being AGN. Only one of the six has the emission lines characteristic of optically selected AGN; the remaining five would not have been classified as AGN based on their optical spectra. This suggests the existence of a large population of obscured, or at least optically unremarkable, AGN in clusters of galaxies. These six sources correspond to a lower limit of % of the AGN fraction in cluster galaxies with mag (rest-frame mag) and is comparable to the blue galaxy fraction in the cluster. Such an obscured AGN population in clusters of galaxies has many implications for cluster galaxy evolution, the hidden growth of their central, supermassive black holes, estimates of the star formation rate at infrared and radio wavelengths, and the observed variance in the hard X-ray background.
1 Introduction
Both star formation and accretion onto supermassive black holes require reservoirs of cold gas. The presence of nuclear activity in cluster galaxies is therefore an indication of the efficiency with which these galaxies were stripped of their cold interstellar medium, and to what extent their central, supermassive black holes may continue to grow in cluster environments. The evolution of the fraction of cluster galaxies which host active galactic nuclei (AGN) is therefore an important component of galaxy evolution in clusters. Determination of the connection between AGN and the history of infall and star formation for host galaxies may also provide interesting constraints on the fueling and lifetimes of nuclear activity. AGN in clusters of galaxies may be a significant contribution to the radio and infrared sources in clusters, and need to be identified in order to use such measurements to infer star formation rates (e.g. Duc et al., 2002).
It is not yet known if the AGN fraction in clusters of galaxies shows any evolution with redshift, although there is clear evidence for evolution in cluster galaxies. The fraction of galaxies with recent star formation decreases significantly from to the present (the Butcher-Oemler effect; Butcher & Oemler, 1978, 1984) and the fraction of poststarburst galaxies also has decreased dramatically over this same redshift range (Dressler & Shectman, 1988; Dressler et al., 1999) and much more so than in the field (Zabludoff et al., 1996; Dressler et al., 1999). The current best estimate of the mean cluster AGN fraction is % (e.g. Dressler & Gunn, 1983; Dressler et al., 1999), a factor of a few less than the bright AGN fraction in the field (e.g. Huchra & Burg, 1992). These measurements of the AGN fraction in clusters and the field are the result of extremely large, spectroscopic surveys of galaxies. However, the fraction of all galaxies that are bright AGN is small; this makes spectroscopic searches inefficient and any evolution in the host galaxy population difficult to detect. A related problem is that AGN may not be obvious at visible wavelengths, whether due to moderate line strengths compared to the host galaxy light, or obscuration.
A better way to search for AGN is at X-ray wavelengths. While AGN comprise only a small minority of all galaxies at visible wavelengths, they are the dominant contribution to the luminous, hard (2-10 keV) X-ray point source population. We have begun a program to study the AGN content of clusters of galaxies that have deep observations with the Chandra X-ray Observatory. As all luminous AGN produce significant hard X-ray emission, we use the Chandra data to select AGN for spectroscopic observations to determine cluster membership. Chandra data are therefore uniquely suited to identify these AGN due to its superior angular resolution compared to all other X-ray satellites. In this Letter we present our discovery of six previously unknown AGN in Abell 2104, a rich cluster (Abell class 2; Allen et al., 1992) of galaxies at (Liang et al., 2000).
2 Observations
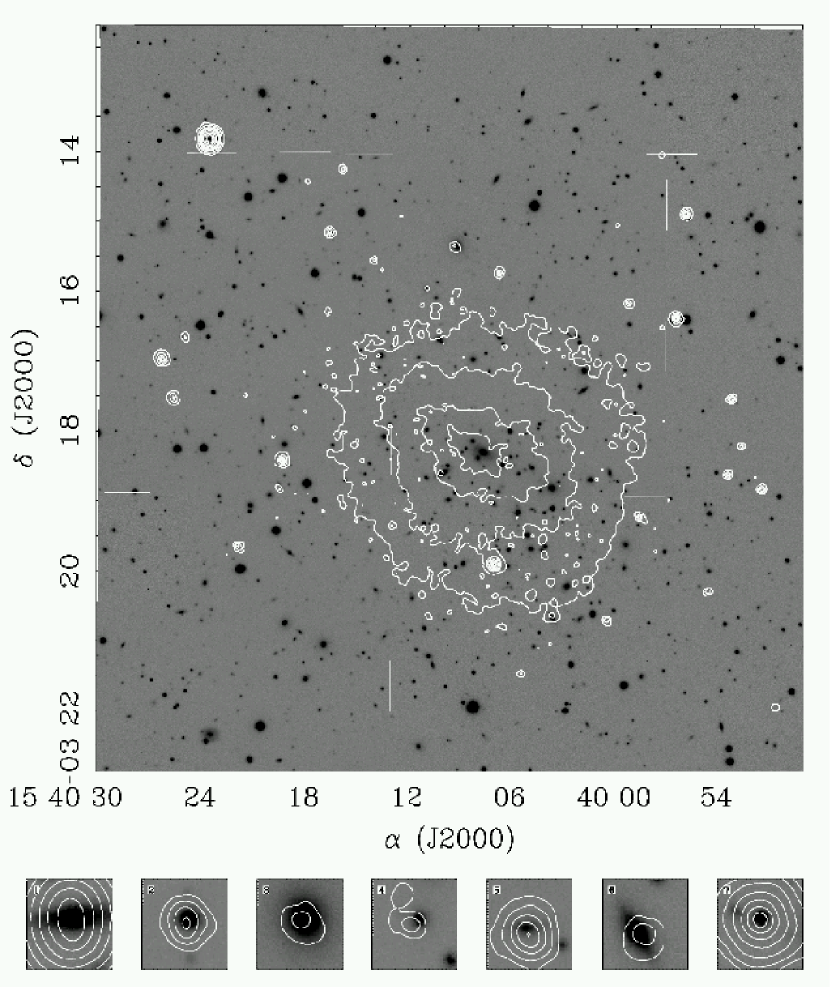
Abell 2104 was observed by Chandra with ACIS-S on 25 May 2000 for 49.83ks. Here we restrict our analysis to the S3 chip, which covers a field of view. The hard X-ray flux limit for this observation is approximately erg s-1cm-2. We identified point sources in a smoothed version of the 0.8-10 keV image with SExtractor (Bertin & Arnouts, 1996). Figure 1 shows the X-ray contours, after subtraction of the diffuse cluster component, on a deep band image of the inner of the cluster obtained at the 2.5m du Pont telescope. Fourteen of the X-ray sources have optical counterparts brighter than mag; eight have optical counterparts brighter than mag. Figure 2 shows a vs. color–magnitude diagram (small points) and the spectroscopically confirmed cluster members from Liang et al. (2000, filled circles). The X-ray detections (open circles) were not observed by Liang et al. (2000), with the exception of a foreground AGN at (star in Figure 2, galaxy #117 in Liang et al.) and one cluster member (our #6, Liang et al. #314).


We observed the seven counterparts with mag (we excluded the foreground AGN) with the 6.5m Baade telescope on 6 April 2002. These spectra, shown in Figure 3, were obtained with the Low Dispersion Survey Spectrograph 2 and a longslit. All six of the red, mag optical counterparts are members of Abell 2104. The seventh, blue counterpart is a QSO at . Based on Chandra observations of blank fields, we expect one or two optically bright X-ray counterparts in an observation with this exposure time (Mushotzky et al., 2000), rather than the eight observed. The X-ray and visible-wavelength properties for our seven spectroscopic targets are provided in Table 1.
Of the six X-ray detected members of Abell 2104, only #1 is a broad-line AGN and this is also the most luminous X-ray source. Only one of the remaining five has any emission lines: the weak [OIII] Å in #2 (the atmospheric A band falls on H at the cluster redshift). We did not detect [OII] Å [OIII], or H emission in any of the remaining objects. The X-ray properties of the point sources were derived using the CIAO software package. Sources #1, 2, 5, and 7 were sufficiently bright to extract and fit X-ray spectra. All three of the cluster members are consistent with high absorbing columns and can only be AGN due to both their luminosities and hard X-ray spectra. We measured hardness ratios () for the remaining three members. Of these three, #6 has a hardness ratio typical of a highly absorbed AGN. The remaining two (#3 and 4) are softer, but still too hard to be explained by thermal emission alone. The hardness ratios of these two objects are consistent with a combination of thermal emission and a powerlaw component. In this model, nearly all of the flux in the 2-10 keV band comes from the powerlaw component. Given the large luminosities of the powerlaw components an AGN likely exists in both of these galaxies.
3 Discussion
Only one of the six AGN in Abell 2104, or % of the mag (rest-frame mag) cluster members, is an obvious AGN in our optical spectra. This is in good agreement with the mean cluster AGN fraction of 1% from optical spectroscopic surveys (Dressler et al., 1999). When Chandra observations are used to identify AGN, the AGN fraction appears to be a factor of five higher, or %. To evaluate the significance of this result, we use a simple binomial distribution test. Given an expected AGN fraction of 1%, the variance in the number of AGN in a sample of 100 galaxies is . We discovered five more AGN than expected, which is significant at the 5/0.99 or level. In fact, an AGN fraction of 5% is a lower limit to the true AGN fraction as our observations are not sensitive to more highly obscured AGN. For example, if the lower-luminosity AGN (such as #5 and #6) had a factor of five to ten higher absorbing columns, we would not have detected them; such higher absorption columns are not unusual among nearby field AGN with similar luminosities. There is additional evidence for a larger number of AGN in other clusters of galaxies in recent Chandra observations of point source excesses toward several other clusters (Cappi et al., 2001; Sun & Murray, 2002; Molnar et al., 2002).
Most of the AGN in Abell 2104 lack strong emission lines, which may be due to dilution by host galaxy light. For example, if we use the ratio of [OIII]Å to hard X-ray flux for source #1 to predict the equivalent widths for the other five sources, the equivalent widths would not be detectable in our spectroscopy. The [OIII]Å to hard X-ray flux ratio for source #1 is and is comparable to many Seyfert 2s (Polletta et al., 1996), although this ratio varies by several orders of magnitude in AGN. Our nondetection of emission lines in these objects could therefore be due to the low signal-to-noise of our spectroscopy, or due to some obscuration of the emission line region. It is not likely that the two X-ray sources with the lowest luminosities are powered by star formation, rather than AGN. While the most luminous local starbursts, such as Arp 220 or NGC 3256, have hard X-ray luminosities comparable to the two faintest sources in Abell 2104 ( erg s-1 Moran et al., 1999; Iwasawa, 1999), our low luminosity sources do not show detectable emission lines indicative of massive star formation. Furthermore, both Arp 220 and NGC 3256 would be 0.3 mag bluer in rest-frame (or 0.6 mag in observed ) than our A2104 optical counterparts. It is therefore more likely that these X-ray sources are powered by nuclear activity. Even if these two X-ray sources do not include an AGN component, the significance of our result changes to (4-1)/0.99 or a excess over expectations. These AGN, without detectable emission lines, appear similar to the optically bright, hard X-ray population that contribute approximately 40% of the hard X-ray background (Mushotzky et al., 2000). If a significant number of such sources reside in clusters, they may be an important constituent of the hard X-ray background. Their association with the highly biased cluster galaxy population may also explain the variation in the hard X-ray background intensity from field to field discussed by Cowie et al. (2002).
The unexpectedly high AGN fraction in Abell 2104 is comparable to the fraction of galaxies that qualify as Butcher–Oemler galaxies (Butcher & Oemler, 1984) or that are emission-line galaxies (Liang et al., 2000). This AGN fraction, and the fact that it is a lower limit, suggests that obscured AGN may make a significant contribution to infrared and radio sources in cluster galaxies. For example, Duc et al. (2002) concluded that most of their FIR and radio-selected galaxies in Abell 1689 are powered by star formation because they only found optical emission line ratios consistent with AGN in one galaxy. Our result suggests that many of their sources could be AGN that lack strong emission-line features.
Surprisingly, the host galaxies of these AGN all fall near or on the cluster color–magnitude relation (Sandage & Visvanathan, 1978), which is presumably composed of old, quiescent galaxies without the reservoirs of cold gas necessary to fuel AGN. From our ground-based data ( seeing FWHM), approximately half of these host galaxies appear to have disk morphologies and half appear to have elliptical or S0 morphologies. They also span approximately three magnitudes in luminosity. Our naive expectation was that the AGN population in clusters should be associated with the blue, starforming galaxies as they have both significant reservoirs of cold gas and are interacting with the cluster potential for the first time. If the AGN lifetime were longer than the typical lifetime of Gyr for star forming galaxies in clusters (Poggianti et al., 1999), or there were a long delay before the onset of nuclear activity, AGN might instead be associated with the post-starburst population. In Abell 2104, the brightest three AGN shown in Figure 2 fall on the cluster color–magnitude relation; while the fainter three are slightly bluer, they are not as blue as Butcher-Oemler galaxies. None of these AGN host galaxies have been completely stripped of their cold gas by the cluster potential (e.g. Gunn & Gott, 1972). These galaxies appear to have retained a reservoir of cold gas at the center of their potential wells similar to the dust disks observed in local cluster ellipticals (e.g. Jaffe et al., 1994; Martel et al., 1999).
The association of these six AGN in Abell 2104 with red cluster galaxies could be because these observations only probe the inner 1 Mpc of the cluster, which is dominated by old, red galaxies. The population of blue, starforming galaxies in clusters is known to be more spatially extended (Butcher & Oemler, 1984) and have higher velocity dispersions (Dressler et al., 1999) than the red, passively evolving galaxies. While the six AGN in Abell 2104 are photometrically and spectroscopically similar to old, red galaxies, their mean redshift is offset by km s-1 from the cluster members measured by Liang et al. (2000). At least some of the AGN may therefore be falling into the cluster for the first time. The asymmetric appearance of the cluster galaxy distribution in Figure 1 suggests that this cluster is dynamically evolving. The spatial and kinematic distribution of AGN hosts to large cluster radii would help identify whether AGN are predominantly associated with the infalling galaxy population.
The AGN host galaxy population in clusters could provide some interesting constraints on the fueling and lifetimes of AGN. Their association with blue galaxies would suggest that the AGN lifetime is less than the 0.1 Gyr lifetime of this population, consistent with current estimates for the lifetime of nearby AGN in the field (Martini et al., 2002), and that nuclear activity is quenched by the cluster potential. If AGN are instead found in cluster galaxy populations of different ages, this suggests that nuclear activity is also episodic in the cluster environment and galaxies retain a central reservoir of cold gas for several Gyr after they enter the cluster potential. In either scenario, the presence of this large population of obscured AGN in cluster galaxies indicates that their central, supermassive black holes continue to grow in the cluster environment.
4 Summary
We used deep Chandra and ground-based images to search for AGN in the cluster Abell 2104. Our follow-up spectroscopy has revealed six X-ray sources that are cluster members and all six fall on the cluster color–magnitude relation. The X-ray luminosities of four of these sources are sufficiently high that they can only be AGN. The remaining two are sufficiently luminous, red, and have hardness ratios that suggest they include or are dominated by an AGN component as well. These six sources correspond to an AGN fraction of % of cluster galaxies with mag. This is a lower limit to the cluster AGN fraction due to our insensitivity to AGN with higher absorbing columns. Only one of these six sources has the characteristic spectral signatures of AGN; the remaining five exhibit either very weak emission (one) or no evidence for nuclear activity (four). The fraction of optically identifiable AGN in Abell 2104 is therefore %, in good agreement with other clusters of galaxies (Dressler & Shectman, 1988; Dressler et al., 1999).
The X-ray selected AGN fraction is a factor of five greater than the fraction selected by optical spectroscopy alone and is comparable to the fraction of blue galaxies. The high fraction of X-ray selected AGN in Abell 2104 suggests the existence of an obscured, or at least optically unremarkable, AGN population in rich clusters of galaxies. Obscured AGN such as these could significantly affect infrared and radio-wavelength measurements of star formation in clusters of galaxies, as well as explain the cosmic variance in the hard X-ray background. Additional observations of AGN in other clusters of galaxies may provide interesting constraints on their fueling, lifetimes, and the growth of their central, supermassive black holes.
References
- Allen et al. (1992) Allen, S. W., Edge, A. C., Fabian, A. C., Boehringer, H., Crawford, C. S., Ebeling, H., Johnstone, R. M., Naylor, T., & Schwarz, R. A. 1992, MNRAS, 259, 67
- Bertin & Arnouts (1996) Bertin, E. & Arnouts, S. 1996, A&AS, 117, 393
- Butcher & Oemler (1978) Butcher, H. & Oemler, A. 1978, ApJ, 219, 18
- Butcher & Oemler (1984) —. 1984, ApJ, 285, 426
- Cappi et al. (2001) Cappi, M., et al. 2001, ApJ, 548, 624
- Cowie et al. (2002) Cowie, L. L., Garmire, G. P., Bautz, M. W., Barger, A. J., Brandt, W. N., & Hornschemeier, A. E. 2002, ApJ, 566, L5
- Dressler & Gunn (1983) Dressler, A. & Gunn, J. E. 1983, ApJ, 270, 7
- Dressler & Shectman (1988) Dressler, A. & Shectman, S. A. 1988, AJ, 95, 284
- Dressler et al. (1999) Dressler, A., Smail, I., Poggianti, B. M., Butcher, H., Couch, W. J., Ellis, R. S., & Oemler, A. J. 1999, ApJS, 122, 51
- Duc et al. (2002) Duc, P.-A., Poggianti, B. M., Fadda, D., Elbaz, D., Flores, H., Chanial, P., Franceschini, A., Moorwood, A., & Cesarsky, C. 2002, A&A, 382, 60
- Gunn & Gott (1972) Gunn, J. E. & Gott, J. R. I. 1972, ApJ, 176, 1
- Huchra & Burg (1992) Huchra, J. & Burg, R. 1992, ApJ, 393, 90
- Iwasawa (1999) Iwasawa, K. 1999, MNRAS, 302, 96
- Jaffe et al. (1994) Jaffe, W., Ford, H. C., O’Connell, R. W., van den Bosch, F. C., & Ferrarese, L. 1994, AJ, 108, 1567
- Liang et al. (2000) Liang, H., Lémonon, L., Valtchanov, I., Pierre, M., & Soucail, G. 2000, A&A, 363, 440
- Martel et al. (1999) Martel, A., Baum, S. A., Sparks, W. B., Wyckoff, E., Biretta, J. A., Golombek, D., Macchetto, F. D., de Koff, S., McCarthy, P. J., & Miley, G. K. 1999, ApJS, 122, 81
- Martini et al. (2002) Martini, P., Regan, M. W., Mulchaey, J. S., & Pogge, R. W. 2002, ApJ, submitted
- Molnar et al. (2002) Molnar, S. M., Hughes, J. P., Donahue, M., & Joy, M. 2002, ApJ, 573, L91
- Moran et al. (1999) Moran, E. C., Lehnert, M. D., & Helfand, D. J. 1999, ApJ, 526, 649
- Mushotzky et al. (2000) Mushotzky, R. F., Cowie, L. L., Barger, A. J., & Arnaud, K. A. 2000, Nature, 404, 459
- Poggianti et al. (1999) Poggianti, B. M., Smail, I., Dressler, A., Couch, W. J., Barger, A. J., Butcher, H., Ellis, R. S., & Oemler, A. J. 1999, ApJ, 518, 576
- Polletta et al. (1996) Polletta, M., Bassani, L., Malaguti, G., Palumbo, G. G. C., & Caroli, E. 1996, ApJS, 106, 399
- Sandage & Visvanathan (1978) Sandage, A. & Visvanathan, N. 1978, ApJ, 225, 742
- Sun & Murray (2002) Sun, M. & Murray, S. S. 2002, ApJ, 2431
- Zabludoff et al. (1996) Zabludoff, A. I., Zaritsky, D., Lin, H., Tucker, D., Hashimoto, Y., Shectman, S. A., Oemler, A., & Kirshner, R. P. 1996, ApJ, 466, 104
| ID | Name | Index or | [2-10keV] | [2-10keV] | Spectral Features | ||||
|---|---|---|---|---|---|---|---|---|---|
| [ cm-2] | [erg s-1cm-2] | [erg s-1] | [mag] | ||||||
| 1 | CXOU J154023.6-031347 | 0.159 | 17.32 | 2.42 | [OIII],Mgb,NaD,H | ||||
| 2 | CXOU J154016.7-031507 | 0.155 | 18.79 | 2.16 | [OIII]5007,Mgb,NaD | ||||
| 3 | CXOU J154009.4-031519 | 0.162 | 0.17 | 16.95 | 2.38 | H+K,G,Mgb | |||
| 4 | CXOU J154014.0-031704 | 0.157 | 0.16 | 19.67 | 2.04 | Mgb,NaD | |||
| 5 | CXOU J154019.5-031825 | 0.161 | 19.63 | 1.97 | G,Mgb | ||||
| 6 | CXOU J154003.9-032039 | 0.154 | 17.81 | 2.36 | Mgb,NaD | ||||
| 7 | CXOU J154007.2-031952 | 1.51 | 19.36 | 1.21 | MgII,OIII |
Note. — Summary of our observations of X-ray sources with bright, mag counterparts in the field of Abell 2104. The redshifts, best-fit absorbing column, spectral indices or hardness ratios, and observed hard X-ray fluxes are listed in columns 3 – 6. We have used the spectral fits, or the models described below, to derive the absorption-corrected hard X-ray luminosities provided in column 7 (assuming a ( cosmology) . The errorbars are for the 90% confidence level. Columns 8 & 9 provide the magnitude and color of each source, and column 10 lists the spectral features used for the redshift determination. The fluxes for #3 and #4, which only have approximately ten counts each, were derived assuming a thermal model with a temperature of 1 keV and a power law with index 1.5. The flux for #6 was derived assuming a power law with index 1.5 and an absorbing column cm-2. These models are consistent with the measured hardness ratios.