Discovery of GRB 020405 and its Late Red Bump
Abstract
We present the discovery of GRB 020405 made with the Inter-Planetary Network (IPN). With a duration of 60 s, the burst appears to be a typical long duration event. We observed the 75-square acrminute IPN error region with the Mount Stromlo Observatory’s 50-inch robotic telescope and discovered a transient source which subsequently decayed and was also associated with a variable radio source. We identify this source as the afterglow of GRB 020405. Subsequent observations by other groups found varying polarized flux and established a redshift of 0.690 to the host galaxy. Motivated by the low redshift we triggered observations with WFPC2 on-board the Hubble Space Telescope (HST). Modeling the early ground-based data with a jet model, we find a clear red excess over the decaying optical lightcurves that is present between day 10 and day 141 (the last HST epoch). This “bump” has the spectral and temporal features expected of an underlying supernova (SN). In particular, the red color of the putative SN is similar to that of the SN associated with GRB 011121, at late time. Restricting the sample of GRBs to those with , a total of five bursts, red bumps at late times are found in GRB 970228, GRB 011121, and GRB 020405. It is possible that the simplest idea, namely that all long duration GRBs have underlying SNe with a modest dispersion in their properties (especially peak luminosity), is sufficient to explain the non detections.
1 Introduction
In recent years several indirect lines of evidence have emerged connecting the class of long duration -ray bursts (GRBs) to massive stars. Every GRB afterglow with a sub-arcsecond position is associated with a star-forming galaxy (Bloom, Kulkarni & Djorgovski, 2002). Some of these galaxies are forming stars copiously with rates of a few hundred M⊙ yr-1 (Berger, Kulkarni & Frail, 2001; Frail et al., 2002). On smaller scales, some afterglows (the so-called “dark bursts”), show evidence for heavy dust extinction (Djorgovski et al., 2001; Piro et al., 2002). X-ray and optical observations of some GRBs indicate substantial column densities (Owens et al., 1998; Galama & Wijers, 2001). In addition, there is evidence for moderate circumburst densities, cm-3, in some bursts (Harrison et al., 2001; Panaitescu & Kumar, 2001; Yost et al., 2002). These indicators are consistent with GRBs originating in gas-rich star-forming regions (i.e. molecular clouds).
The most direct link between GRBs and massive stars comes from observations on stellar scales, namely the detection of underlying supernovae (SNe) and X-ray spectral features. X-ray spectral features have been observed in a few GRBs (e.g. Piro et al. 2000; Reeves et al. 2002), although the detections generally have low signal-to-noise, and the interpretations are somewhat controversial. What is generally agreed, however, is that X-ray features would require the presence of high densities of iron on stellar scales.
The discovery of the unusual Type Ic SN 1998bw (Galama et al., 1998) in a nearby (40 Mpc) galaxy, within the small error box of GRB 980425 (Pian et al., 2000) suggested that at least some GRBs might be caused by SN explosions. Despite the fact that GRB 980425 was under-energetic compared to the cosmological GRBs (Frail et al., 2001) and may therefore represent an independent class of GRBs, the fact remains that SN 1998bw directly demonstrates that a massive star is capable of producing relativistic ejecta (Kulkarni et al., 1998) — an essential requirement for producing -rays.
The first indication of a SN underlying a cosmological GRB came from the observation of a red excess (“bump”) in the rapidly-decaying afterglow of GRB 980326 (Bloom et al., 1999), which had a color and peak time consistent with SN 1998bw shifted to . However, the lack of a measured redshift for this GRB and the possibility of other explanations (e.g. dust echoes: Esin & Blandford 2000; Reichart 2001) made the identification of the bump uncertain. Several attempts to identify similar bumps in the afterglows of GRBs with known redshift followed with mixed results; see Price et al. (2002) for a review.
These earlier results motivated us to successfully propose a large Hubble Space Telescope (HST) program to search for SNe underlying GRBs (GO-9180, P.I.: Kulkarni). HST is ideally suited to this effort since its stable point-spread function and high angular resolution make possible accurate and precise photometry of variable sources embedded on host galaxies. Low redshift GRBs are particularly important to study, since beyond a redshift of 1.2 the strong absorption in the SNe rest-frame spectra blueward of 4000 Å covers the entire observed optical region, thus making searches all but impossible with current instruments.
To date, the best case for a SN underlying a cosmological GRB comes from HST observations of GRB 011121 (; Bloom et al. 2002; Garnavich et al. 2002). This is based on a bump in the optical afterglow lightcurves between 15 and 75 days, exhibiting a spectral turnover at 7200 Å.
In addition, based on early NIR and radio observations (Price et al., 2002), the afterglow of GRB 011121 exhibits clear evidence for a circumburst density, (where is the radial distance from the burst). Such a density profile is indicative of stellar mass loss. Hence, from two independent lines of evidence, it can be inferred that the progenitor of GRB 011121 was a massive star.
However, not all GRBs have an underlying SN as bright as that of GRB 011121 (e.g. GRB 010921: Price et al. 2002). Thus, additional deeper searches for coincident SNe are necessary to determine whether the lack of an observed SN is due to dust obscuration, diversity in the brightness of SNe coincident with GRBs, or to some subset of GRBs having a different progenitor.
So far, our discussion has been motivated by, and based on observations. However, theorists have studied massive star models for long duration GRBs for more than a decade. In particular, the “collapsar” model posits that GRBs arise when the cores of massive stars with sufficient angular momentum collapse and form black holes (Woosley, 1993; MacFadyen & Woosley, 1999; MacFadyen, Woosley & Heger, 2001) whose accretion powers bursts of -rays. From the discussion in this section, it is clear that there is a good observational basis for the collapsar model. Detailed studies of the underlying SNe (or their absence) will provide much needed observational constraints to the collapsar model, or other models which also require an associated SN event (“supranova” — Vietri & Stella 1998; “cannonball” — Dado, Dar & De Rujula 2002).
Here, we present the discovery of the afterglow of GRB 020405 and the subsequent search for and discovery with HST of a red bump in the afterglow that we suggest may be a SN underlying the GRB.
2 The GRB and its Optical Afterglow
On 5 April 2002 at 00:41:26 UT the InterPlanetary Network (IPN) consisting of Ulysses, Mars Odyssey/HEND and BeppoSAX discovered and localized GRB 020405 (Hurley et al., 2002). With a duration of 60 s, the burst is a typical long duration GRB (Figure 1). The prompt emission can be well fitted by a Band function (Band et al., 1993) with the following parameters: low-energy spectral index, , high-energy spectral index, and break energy, keV. The fluence, as measured by Konus-WIND, was erg cm-2 (15–2000 keV), and the peak flux, averaged over 0.768 s, was erg cm-2 s-1.
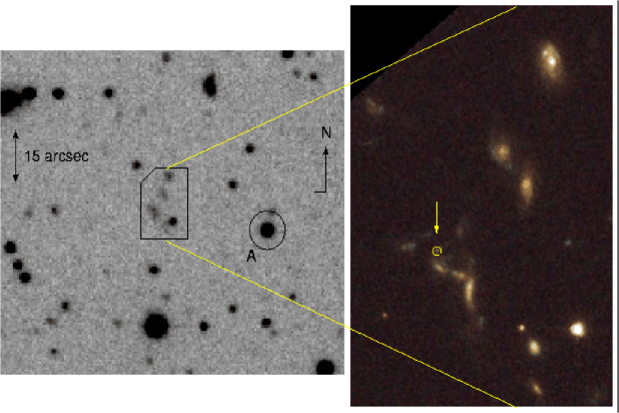
We observed the 75 square-arcmin error box of GRB 020405 with the robotic 50-inch telescope at Mount Stromlo Observatory (MSO) and the 40-inch telescope at Siding Spring Observatory (SSO), commencing approximately 17 hours after the GRB. From comparison of these images with images from the Digitised Sky Survey111The Digitized Sky Surveys were produced at the Space Telescope Science Institute under U.S. Government grant NAG W-2166. we were able to identify a bright ( mag) source within the error-box that was not present in the Sky Survey (Price, Schmidt & Axelrod, 2002). We undertook further imaging observations with the Wise 40-inch, SSO 2.3-m, and the Las Campanas du Pont 100-inch telescopes (see Table 2) and found that the candidate faded.
In parallel, we undertook VLA observations of the source and found a mJy radio counterpart (Berger, Kulkarni & Frail, 2002). The combination of a decaying optical source and a variable radio counterpart established that we had detected the afterglow of GRB 020405.
3 Optical Observations of the Afterglow and the Host Galaxy
The low redshift of this event made it a prime candidate for a search for an underlying SN as a part of our large HST program. We staggered observations with the Wide Field Planetary Camera 2 (WFPC2) in F555W, F702W and F814W between 19 and 31 days after the GRB in order to densely sample the peak of any underlying SN. We followed this sequence with observations in each filter approximately two months after the GRB in order to measure the SN decay. At each epoch we exposed a total of 3900 s and used a 6-point dither pattern to recover the under-sampled point-spread function (PSF).
We used “On-The-Fly” pre-processing to produce debiased, flattened images. The images were then drizzled (Fruchter & Hook, 2002) onto an image with pixels smaller than the original by a factor of 0.5 using a pixfrac of 0.7.
Given that we had to tie the ground based and HST datasets we paid special attention to calibration. Calibration of field stars was performed through observation of Stetson standards222http://cadcwww.dao.nrc.ca/standards/ with the Swope 40-inch telescope at LCO. We estimate that our calibration is accurate to approximately 0.05 mag. Images were bias-subtracted and flat-fielded in the standard manner, and combined where necessary to increase the signal-to-noise.
As can be seen from Figure 2, the host galaxy complex is quite bright ( mag). Hence it is essential to employ image subtraction techniques on the ground-based images to obtain accurate lightcurves for the afterglow (e.g. Price et al. 2002; Bersier et al. 2002). We used the Novicki-Tonry photometry technique (see Price et al. 2002 for a description) on both the ground-based and HST observations to produce host-subtracted fluxes, under the assumption that the afterglow flux in the last available HST images in each filter were negligible (Tables 2 and 3). For the ground-based data, this is a reasonable assumption, since none of the observations are particularly deep, and the errors in the photometry will be larger than any offset. Similarly for the F555W and F702W measurements with HST, which have late observations, but in F814W there will be an uncertain, additional flux not included in our measurements since we are using subtracted fluxes. This additional flux is equal to the flux of the afterglow on Jun 9 in F814W, and so it is important to bear in mind that the F814W measurements presented below are an underestimate of the true flux for this filter only.
3.1 Host Galaxy Spectroscopy
We observed the afterglow and host galaxy of GRB 020405 with the Echellette Spectrograph and Imager (Sheinis et al., 2002) on Keck II at 2002 Apr 8.41 UT in poor seeing conditions. We used a 0.75-arcsec wide slit close to the parallactic angle and obtained two 1800-s exposures in echellette mode with a small dither on the slit. We used custom software to straighten the echelle orders before combining the individual exposures and extracting the spectrum using IRAF. Arc lamp exposures were used for wavelength calibration, with a resultant scatter of 0.06 Å. An observation of Feige 34 was used for flux calibration. An earlier spectrum was also obtained from the Baade Telescope, but with lower resolution and signal-to-noise.
We detect several bright emission lines which we attribute to [O II], H and [O III] at a mean Heliocentric redshift of 0.68986 0.00004, consistent with the measurement first reported by Masetti et al. (2002). We list these emission lines in Table 1. Using the observed [O II] and H line fluxes and assuming a flat Lambda cosmology with = 65 km s-1 Mpc-1 and = 0.3, we calculate (Kennicutt, 1998) a star formation rate of 4 M⊙ yr-1. This star-formation rate is uncorrected for extinction or stellar absorption, and is therefore a lower limit.
4 Modeling the Afterglow
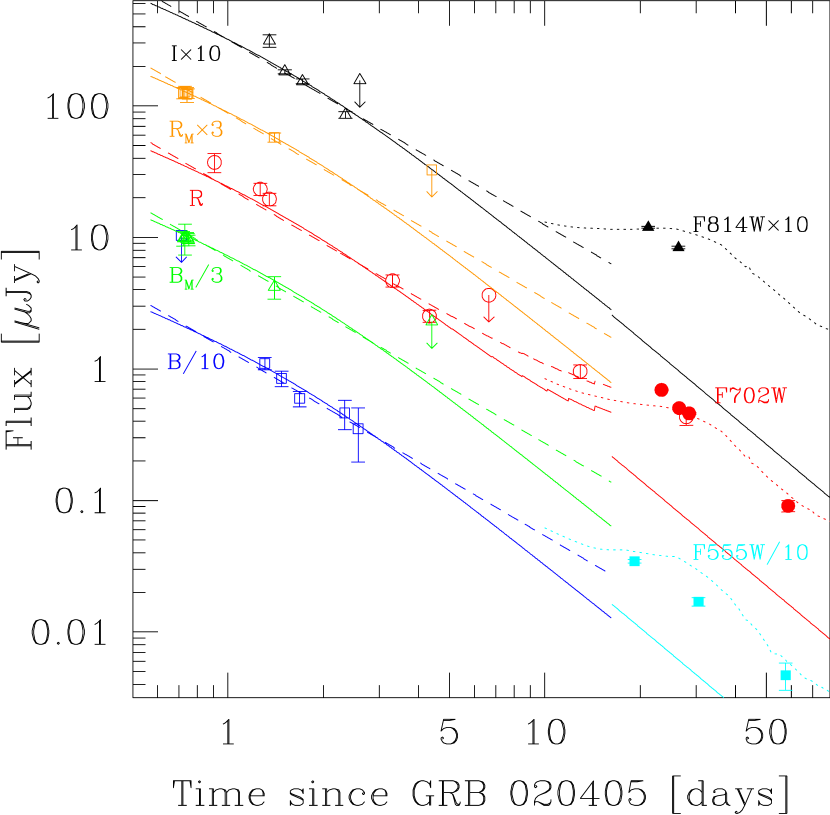
We model the lightcurves (Figure 3) by adopting a standard afterglow model with power-law temporal decay and a power-law spectrum, . Due to the bright host galaxy complex, we include in our data set only those values in the literature that have been derived from host-subtracted images — specifically, the measurements of Bersier et al. (2002) (corrected for the apparent difference in reference star magnitudes) and those presented here. In the first round of analysis we restrict ourselves to data taken prior to 10 d after the GRB. We obtain a fairly poor fit with /DOF = 53.4/29, and . We notice that the model slightly over-predicts the flux for the earliest data from the MSO 50-inch. This may suggest the presence of a jet break about one day after the GRB.
Bersier et al. (2002) have detected strong polarization of the afterglow emission (9.9%) at 1.3 d after the GRB which then appears to have declined to about 1.9% by 2.1 d after the GRB (Covino et al., 2002). Sari (1999) predicted the polarization of GRB afterglows to peak at about 10% at the time of the jet break for GRBs that are not viewed far off-axis. The behavior of the polarization-curve, therefore, also argues for the presence of a jet break about a day after the GRB. The low radio flux (Berger et al. in prep.) compared to the bright optical afterglow may also be evidence for an early jet break.
We therefore adopt a broken power-law temporal decay with indices (early times), (late times) and a jet break time, . The power-law indices are functions of the electron energy distribution index, ( for ). However, given the sparse data we make the ad hoc simplifying assumption that the optical band is above the cooling frequency and the circumburst medium is homogenous. In this case, and (Sari, Piran & Halpern, 1999).
With these assumptions, we obtain a much-improved fit (/DOF = 35.9/28): and d. Adding a systematic error of 0.06 mag in quadrature with the measurement errors to account for differences between data taken with different instruments reduces the to match the degrees of freedom. In our experience, this is an expected level of systematic error.
The redshift of GRB 020405, , and the observed spectrum of the burst, imply an isotropic-equivalent -corrected (Bloom, Frail & Sari, 2001) energy release, erg. The -correction () is small and rather precise given the spectral constraints from BeppoSAX. From our best-fit value of , using the specific formulation of Frail et al. (2001), we calculate a jet opening angle of degrees, where is the number density of the ambient medium in units of 1 cm-3. The beaming-corrected energy is thus erg, at the low end of (but consistent with) the distribution centred on erg for long duration GRBs (Frail et al., 2001).
We can also measure the dust extinction from the afterglow data by demanding that the intrinsic spectral slope match that predicted by a particular theoretical model (dependent upon the density profile and the location of the cooling frequency relative to the optical bands) and attributing any observed reddening to extinction (see, e.g., Price et al. 2002). Assuming an SMC extinction curve (Reichart, 2001), we measure the extinction to be 0.22 mag 0.64 mag, depending on the choice of afterglow model.
4.1 Late Time Data: A Red Bump
We now turn our attention to data taken after 10 d from the GRB. We note that there is a strong excess in each of the three HST filters. This excess (“bump”) exists independent of the assumed geometry of the afterglow, but is more pronounced for a jet model (discussed above). We suggest this excess may be due to a SN which exploded within about a week of the GRB. Although it is not possible to analyze the bump in detail (in particular, its flux relative to SN 1998bw) until later HST observations have been made of the host galaxy to remove the assumption of zero afterglow flux in the last available epochs, we can make a number of qualitative statements.
First, the peak of the bump is not well constrained by these data, and appears to be between 10 and 25 days after the GRB. Second, fitting a power-law spectrum, , to the HST data demonstrates that the bump is quite red, with (i.e. mag, mag), in contrast to measured for the afterglow at early times, further evidence for the existence of two components. This measurement of the spectral index is similar to that for the SN underlying GRB 011121, which has between the F450W and F555W filters at late time (Bloom et al., 2002). However, the SN underlying GRB 011121 appeared somewhat bluer in the F555W filter than SN 1998bw (Garnavich et al., 2002), while GRB 020405’s red bump appears more red. For GRB 011121, the SN spectral peak was at Å (Bloom et al., 2002), which corresponds to 9300 Å at the redshift of GRB 020405. Since the spectrum is well described by a single power-law, the spectral peak of a SN would be redward of 8700 Å, which is consistent with the data on GRB 011121. Thus, the broad-band spectra of the red bump appears to be grossly similar to that of GRB 011121 upon first inspection. Some differences in color are not unexpected, due to the uncertain extinction along the line-of-sight to GRB 020405 and the expected diversity in the properties (e.g. jets) of these energetic SNe.
5 Conclusions
Here we report the discovery of the nearby () GRB 020405 and the subsequent discovery of the afterglow. The GRB itself, with a duration of 60 s, appears to be a typical long duration burst. The optical afterglow data, spanning about 10 days, can be fitted with a standard broken power law with a break time of about 1.5 d. Identifying this break with a jet we obtain a beaming-corrected energy release of about erg, typical of that inferred for long duration GRBs.
Motivated by the low redshift, we undertook multi-color observations of the afterglow with HST. We found an excess over the flux predicted by the modeling of the afterglow from ground based data. The overall broad-band spectrum of the bump as well as its temporal evolution are most simply explained as due to an underlying SN which exploded at about the same time as the GRB.
In Price et al. (2002), we summarize the searches for underlying SNe in GRBs (the redshift restriction arising from the fact that the searches are conducted in the optical band; see §1). Including GRB 020405, there are 13 GRBs with . A strong case for an underlying SN can be made for GRB 011121 (; Bloom et al. 2002; Garnavich et al. 2002) and GRB 020405 (). A good case can be made for GRB 970228 (; Reichart 1999; Galama et al. 2000) and GRB 980326 ( unknown; Bloom et al. 1999). At first blush this appears to be a low yield and suggestive that either there is diversity in the progenitors of long duration GRBs or in the properties of underlying SNe, or both.
However, it is important to bear in mind that one of the two unique signatures for a SN is the spectral rollover at short wavelengths, namely below about 4000 Å (see Bloom et al. 1999). Thus for , observations in the and bands are critical, whereas at lower redshifts observations in and bands are critical. The band is quite noisy for ground-based observations whereas most afterglows are well observed in and bands.
Restricting to we find five GRBs (970228, 011121, 020405, 990712 and 010921), of which underlying SNe have been identified in the first three, and possibly in GRB 990712 (Björnsson et al., 2001). The limit for an underlying SN in GRB 010921 is not very stringent (Price et al., 2002); in particular, an underlying SN fainter by more than 2 mag relative to that of SN 1998bw (about as bright as typical SNe Ib/c) would have escaped identification. It is thus premature to conclude that we need several progenitors to cause GRBs. What we can conclude, though, is that dense sampling in several bands of nearby GRBs is likely to remain a productive activity.
References
- Band et al. (1993) Band, D. et al. 1993, ApJ, 413, 281.
- Berger, Kulkarni & Frail (2001) Berger, E., Kulkarni, S. R., and Frail, D. A. 2001, ApJ, 560, 652.
- Berger, Kulkarni & Frail (2002) Berger, E., Kulkarni, S. R., and Frail, D. A. 2002, GRB Circular Network, 1331, 1.
- Bersier et al. (2002) Bersier, D. et al. 2002, ApJL (submitted), astro-ph/0206465.
- Bessell & Germany (1999) Bessell, M. S. and Germany, L. M. 1999, PASP, 111, 1421.
- Björnsson et al. (2001) Björnsson, G., Hjorth, J., Jakobsson, P., Christensen, L., and Holland, S. 2001, ApJ, 552, L121.
- Bloom, Djorgovski & Kulkarni (2001) Bloom, J. S., Djorgovski, S. G., and Kulkarni, S. R. 2001, ApJ, 554, 678.
- Bloom, Frail & Sari (2001) Bloom, J. S., Frail, D. A., and Sari, R. 2001, AJ, 121, 2879.
- Bloom, Kulkarni & Djorgovski (2002) Bloom, J. S., Kulkarni, S. R., and Djorgovski, S. G. 2002, AJ, 123, 1111.
- Bloom et al. (1999) Bloom, J. S. et al. 1999, Nature, 401, 453.
- Bloom et al. (2002) Bloom, J. S. et al. 2002, ApJ, 572, L45.
- Covino et al. (2002) Covino, S. et al. 2002, GRB Circular Network, 1431, 1.
- Dado, Dar & De Rujula (2002) Dado, S., Dar, A., and De Rujula, A. 2002, A&A, 388, 1079.
- Djorgovski et al. (2001) Djorgovski, S. G., Frail, D. A., Kulkarni, S. R., Bloom, J. S., Odewahn, S. C., and Diercks, A. 2001, ApJ, 562, 654.
- Dolphin (2000) Dolphin, A. E. 2000, PASP, 112, 1397.
- Esin & Blandford (2000) Esin, A. A. and Blandford, R. 2000, ApJ, 534, L151.
- Frail et al. (2002) Frail, D. A. et al. 2002, ApJ, 565, 829.
- Frail et al. (2001) Frail, D. A. et al. 2001, ApJ, 562, L55.
- Fruchter & Hook (2002) Fruchter, A. S. and Hook, R. N. 2002, PASP, 114, 144.
- Galama et al. (2000) Galama, T. J. et al. 2000, ApJ, 536, 185.
- Galama et al. (1998) Galama, T. J. et al. 1998, Nature, 395, 670.
- Galama & Wijers (2001) Galama, T. J. and Wijers, R. A. M. J. 2001, ApJ, 549, L209.
- Garnavich et al. (2002) Garnavich, P. M. et al. 2002, ApJ (submitted), astro-ph/0204234.
- Harrison et al. (2001) Harrison, F. A. et al. 2001, ApJ, 559, 123.
- Hurley et al. (2002) Hurley, K. et al. 2002, GRB Circular Network, 1325, 1.
- Kennicutt (1998) Kennicutt, R. C. 1998, ARA&A, 36, 189.
- Kulkarni et al. (1998) Kulkarni, S. R. et al. 1998, Nature, 395, 663.
- MacFadyen & Woosley (1999) MacFadyen, A. I. and Woosley, S. E. 1999, ApJ, 524, 262.
- MacFadyen, Woosley & Heger (2001) MacFadyen, A. I., Woosley, S. E., and Heger, A. 2001, apj, 550, 410.
- Masetti et al. (2002) Masetti, N. et al. 2002a, GRB Circular Network, 1375, 1.
- Masetti et al. (2002) Masetti, N., Palazzi, E., Pian, E., Hjorth, J., Castro-Tirado, A., Boehnhardt, H., and Price, P. 2002b, GRB Circular Network, 1330, 1.
- Owens et al. (1998) Owens, A. et al. 1998, A&A, 339, L37.
- Panaitescu & Kumar (2001) Panaitescu, A. and Kumar, P. 2001, ApJ, 560, L49.
- Pian et al. (2000) Pian, E. et al. 2000, ApJ, 536, 778.
- Piro et al. (2002) Piro, L. et al. 2002, ApJ (in press), astro-ph/0201282.
- Piro et al. (2000) Piro, L. et al. 2000, Science, 290, 955.
- Price et al. (2002) Price, P. A. et al. 2002a, ApJ, 572, L51.
- Price et al. (2002) Price, P. A. et al. 2002b, ApJL (submitted), astro-ph/0207187.
- Price, Schmidt & Axelrod (2002) Price, P. A., Schmidt, B. P., and Axelrod, T. S. 2002, GRB Circular Network, 1326, 1.
- Reeves et al. (2002) Reeves, J. N. et al. 2002, Nature, 416, 512.
- Reichart (1999) Reichart, D. E. 1999, ApJ, 521, L111.
- Reichart (2001) Reichart, D. E. 2001a, ApJ, 553, 235.
- Reichart (2001) Reichart, D. E. 2001b, ApJ, 554, 643.
- Sari (1999) Sari, R. 1999, ApJ, 524, L43.
- Sari, Piran & Halpern (1999) Sari, R., Piran, T., and Halpern, J. P. 1999, ApJ, 519, L17.
- Sheinis et al. (2002) Sheinis, A., Bolte, M., Epps, H., Kibrick, R., Miller, J., Radovan, M., Bigelow, B., and Sutin, B. 2002, PASP (accepted), astro-ph/0204297.
- Vietri & Stella (1998) Vietri, M. and Stella, L. 1998, ApJ, 507, L45.
- Woosley (1993) Woosley, S. E. 1993, ApJ, 405, 273.
- Yost et al. (2002) Yost, S. A. et al. 2002, ApJ (accepted), astro-ph/0204141.
| (Å) | Line | EW (Å) | GW (Å) | ||
|---|---|---|---|---|---|
| 6298.67 0.10 | [O II] | 55.7 4.7 | 28.0 4.7 | 2.08 0.22 | |
| 6303.59 0.04 | [O II] | 64.5 3.7 | 31.8 4.6 | 1.28 0.09 | |
| 6539.7 | [Ne III] | 13.1 5.1 | 7.0 3.0 | 2.2 | |
| 7337.13 0.24 | H | 19.9 5.3 | 11.6 3.9 | 1.88 0.60 | |
| 8217.42 0.11 | H | 66.3 5.7 | 54 11 | 2.54 0.24 | |
| 8382.25 0.08 | [O III] | 51.1 3.9 | 26.3 5.3 | 2.29 0.17 | |
| 8463.42 0.02 | [O III] | 201.9 3.7 | 71.7 5.9 | 2.545 0.052 |
Note. — Left to right, the columns are the observed wavelength of the line, line identification, observed flux corrected for Galactic extinction using in units of erg/cm2/s, observed equivalent width (uncorrected for contamination by the afterglow), and observed Gaussian width. The line at is affected by a bright night sky line. Given the suggestion that GRB host galaxies may exhibit strong [Ne III] emission (Bloom, Djorgovski & Kulkarni, 2001) we have included an entry for this line.
| Date (2002 UT) | Filter | Flux (Jy) | Telescope |
|---|---|---|---|
| Apr 5.742 | 36 34 | SSO40 | |
| Apr 6.506 | 8.5 1.1 | SSO40 | |
| Apr 6.713 | 5.97 0.80 | SSO40 | |
| Apr 7.367 | 4.6 1.2 | dP | |
| Apr 7.605 | 3.5 1.6 | SSO40 | |
| Apr 5.752 | 29.5 3.7 | MSO50 | |
| Apr 5.761 | 29.9 7.9 | MSO50 | |
| Apr 5.772 | 30.1 2.5 | MSO50 | |
| Apr 5.777 | 29.6 2.5 | MSO50 | |
| Apr 5.781 | 28.5 2.6 | MSO50 | |
| Apr 6.430 | 12.6 2.4 | MSO50 | |
| Apr 9.434 | 3.0 1.9 | MSO50 | |
| Apr 5.752 | 41.9 4.2 | MSO50 | |
| Apr 5.761 | 42.4 4.4 | MSO50 | |
| Apr 5.772 | 40.8 5.4 | MSO50 | |
| Apr 5.777 | 41.5 3.5 | MSO50 | |
| Apr 6.430 | 19.1 1.5 | MSO50 | |
| Apr 9.434 | 5.3 2.8 | MSO50 | |
| Apr 5.936 | 37.2 6.2 | Wise40 | |
| Apr 11.694 | 1.5 1.1 | SSO23 | |
| Apr 6.541 | 18.20 0.64 | SSO40 | |
| Apr 6.750 | 15.39 0.63 | SSO40 | |
| Apr 7.378 | 8.53 0.50 | dP | |
| Apr 7.639 | 4.9 5.4 | SSO40 |
Note. — These data have been obtained by the Novicki-Tonry photometry technique, and hence contain no contribution from the host galaxy. Zero points were set through photometry of several calibrated field stars (sequence available upon request from pap@mso.anu.edu.au). These data have not been corrected for Galactic extinction. Telescopes are: SSO40 — Siding Spring Observatory 40-inch; MSO50 — Mount Stromlo Observatory 50-inch (robotic, using MACHO filters; Bessell & Germany 1999); dP — du Pont 100-inch telescope at Las Campanas Observatory; Wise40 — Wise Observatory 40-inch telescope; SSO23 — Siding Spring Observatory 2.3-m.
| Date (2002 UT) | Filter | Flux (Jy) |
|---|---|---|
| Apr 24.225 | F555W | 0.345 0.011 |
| May 5.585 | F555W | 0.170 0.013 |
| Jun 2.636 | F555W | 0.047 0.011 |
| Aug 23.171 | F555W | … |
| Apr 28.388 | F702W | 0.693 0.010 |
| May 1.574 | F702W | 0.504 0.010 |
| May 3.579 | F702W | 0.459 0.009 |
| Jun 1.568 | F702W | 0.091 0.009 |
| Aug 23.374 | F702W | … |
| Apr 26.229 | F814W | 1.194 0.020 |
| May 1.440 | F814W | 0.837 0.020 |
| Jun 9.513 | F814W | … |
Note. — These data were obtained through Novicki-Tonry photometry and hence contain no contribution from the host galaxy. Those measurements for which no flux is recorded are the last available images in each filter; the flux of the afterglow is assumed to be zero in each of these for the purposes of Novicki-Tonry photometry. Counts were converted to fluxes by using IRAF/synphot to calculate the response to a constant flux of 1 mJy; the resultant fluxes are hence analogous to AB magnitudes. These measurements have been corrected for charge transfer (in-)efficiency (CTE) using the prescription of Dolphin (2000).