Ly absorption around nearby galaxies.
Abstract
We have used STIS aboard HST to search for Ly absorption lines in the outer regions of eight nearby galaxies using background QSOs and AGN as probes. Ly lines are detected within a few hundred km s-1 of the systemic velocity of the galaxy in all cases. We conclude that a background line of sight which passes within kpc of a foreground galaxy is likely to intercept low column density neutral hydrogen with (H I). The ubiquity of detections implies a covering factor of % for low (H I) gas around galaxies within 200 kpc. We find, however, that the Ly lines are usually composed of individual components spread out in velocity over ranges of km s-1. Two sightlines show components which are unusually broad for low-redshift Ly systems, with Doppler parameters km s-1. These may arise in intragroup gas at temperatures of K.
We discuss the difficulty in trying to associate individual absorption components with the selected galaxies and their neighbors, but show that by degrading our STIS data to lower resolutions, we are able to reproduce the anti-correlation of Ly equivalent width and impact parameter found at higher redshift. The anti-correlation does not improve by correcting for the absolute magnitude of a galaxy in the same way as found at higher-. We also show that the equivalent width and column density of Ly complexes (when individual components are summed over km s-1) correlate well with a simple estimate of the volume density of galaxies brighter than at the same redshift as a Ly complex. We do not reject the hypothesis that the selected galaxies are directly responsible for the observed Ly lines, but our analysis indicates that absorption by clumpy intragroup gas is an equally likely explanation.
1 Introduction
The initial detection of Ly-forest absorption lines in HST QSO spectra (Bahcall et al. 1991; Morris et al. 1991; Bahcall et al. 1993) not only demonstrated the existence and evolution of diffuse H I clouds over a significant fraction of the age of the universe, but made it possible to search for the origin of the clouds themselves. Although Ly absorbers were generally accepted to be intergalactic clouds at high-redshift (Sargent et al. 1980), the success at detecting galaxies associated with higher H I column density Mg II systems at (Bergeron 1986; Cristiani 1987; Bergeron & Boisse 1991; Steidel et al. 1994; Steidel 1995) fuelled a keen interest in investigating whether or not low column density Ly lines might also arise in the regions of individual galaxies.
The mapping of galaxies around the sightline towards 3C 273 (Salzer 1992; Morris et al. 1993; Salpeter & Hoffman 1995) found little evidence for a direct association between galaxy and Ly-absorber. Morris et al. (1993) concluded that Ly clouds are not distributed at random with respect to galaxies, nor do they cluster as strongly as galaxies cluster with each other, and could only be associated with galaxies on scales of Mpc111, where is the Hubble constant, and is assumed throughout this paper. However, in a study of six different fields, Lanzetta et al. (1995, hereafter LBTW) found that i) the majority of normal, luminous galaxies possess extended Ly-absorbing halos or disks of radii kpc, and ii) between one and two thirds of all Ly lines arise in such galaxies. Combined with other similar studies (Stocke et al. 1995; Le Brun et al. 1996) it appeared that one possible way to reconcile these disparate results was if strong Ly lines (those with equivalent widths Å) were associated with galaxies, while weak ones ( Å) arose in the intergalactic medium. Such a claim was quickly rejected by other authors (e.g. Tripp et al. 1998).
These initial results were soon re-evaluated in light of the rapid development in hydrodynamical and semi-analytic simulations of hierarchical cold dark matter structure formation. Simulations showed gas following the same density fluctuations that are gravitationally induced by dark matter distributions, resulting in a ‘web’ of intersecting filaments and sheets of gas. Analyses of artificial spectra, generated by shooting random sightlines through the simulations, were extremely successful in reproducing the observed properties of the high-redshift Ly-forest (Cen et al. 1994; Zhang et al. 1995; Hernquist et al. 1996; Miralda-Escude et al. 1996; Bryan et al. 1999). In particular, they showed that low column density lines can be produced predominantly in the sheets of gas, while higher column density lines can arise from denser gas in a virialized halo, i.e., the same regions in which a high galaxy density might be expected.
More recently, Chen et al. (1998, hereafter CLWB) and Chen et al. (2001) have extended the original observations of LBTW, and continue to find that the strength of the absorption depends on QSO-galaxy separation (‘impact parameter’) as well as galaxy luminosity, suggesting a strong link between galaxy and absorber. Meanwhile, the simulators have advanced their models to , and are again able to reproduce many features of the observed Ly-forest (Theuns et al. 1998; Davé & Tripp 2001). Davé et al. (1999) have identified clumps of gas and stars in their simulations which are likely to correspond to galaxies, and impressively, have been able to reproduce the anti-correlation of line strength and impact parameter.
In a previous paper (Bowen et al. 1996) we used Archival HST Faint Object Spectrograph (FOS) data to search for Ly lines from present-day galaxies. Studying the absorption properties of galaxies in the local universe is useful because a galaxy’s properties are more easily determined and because its environment can be examined in detail, without the difficulties which naturally arise from observing higher redshift galaxies. In the previous paper, we found that nearby galaxies do not possess Ly-absorbing halos beyond 300 kpc in radius, and — assuming that an individual galaxy was indeed responsible for the absorption — that the covering factor of galaxies between 50 and 300 kpc was % at an equivalent width limit Å. However, we found no anti-correlation of Ly equivalent width with impact parameter or with galaxy luminosity, and questioned whether the galaxies were indeed responsible for the absorption lines. We instead concluded that our results supported the emerging picture that Ly lines arise in the gaseous sheets and filaments discussed above.
Unfortunately, our analysis suffered from two deficiencies: we probed few galaxies within the canonical 160 kpc found originally by LBTW and confirmed by CLWB; and we were restricted to looking only for strong lines in the low resolution FOS data. In this paper we seek to remedy these inadequacies by describing the results of a program designed specifically to search for weak Ly lines within 160 kpc of a nearby galaxy. The experiment was not originally designed to address the origin of all Ly absorbers, since we start by identifying a suitable galaxy and then search for Ly absorption at the galaxy’s systemic redshift. As we shall see, however, this simple attempt to define galaxy-absorber associations is not so straightforward, since the high spectral resolution of our STIS observations not only enables us to identify lines weaker than those found in FOS data, but also to resolve multiple components within an absorption complex on a scale of km s-1. As we will discuss, resolving individual components in Ly systems makes it surprisingly difficult to tie absorption lines to individual galaxies.
The paper is ordered as follows: We describe the selection of the probed galaxies in §2, and the data reduction and analysis in §3. §4 details the geography of individual galaxy fields and describes the Ly absorption lines detected in the STIS spectra. §5 attempts to interpret the data obtained as a whole, and §6 summarizes our results and places them in context with the higher-redshift systems discussed above.
2 Selection Criteria for the Observed Sample
2.1 Derivation of sample
In order to produce a sample of QSO-galaxy pairs which could be observed with HST, we cross-correlated the Third Reference Catalogue of Bright Galaxies (RC3; de Vaucouleurs et al. 1991) with version 7 of the QSO/AGN catalog of Veron-Cetty & Veron (1996) to find galaxies within 160 kpc of a QSO/AGN line of sight. Selecting from the RC3 has the advantage that galaxies have well-determined systemic velocities, often measured from the 21 cm emission line, as well as magnitudes determined in a consistent way for all the galaxies. We chose galaxies with velocities km s-1, since absorption at velocities less than this would likely be blended with the damped Ly absorption profile from the Milky Way. Our sample was also supplemented with known QSO-galaxy pairs available in the literature.
Initially, we attempted to select galaxies which—from a visual inspection of STScI Digitized Sky Survey (DSS) images—appeared to be isolated from other galaxies. Our aim was to test if single galaxies were surrounded by Ly absorbing halos and avoid complications that might arise from selecting galaxies with neighbors that might also have extended halos. Galaxies are rarely found alone, however, and in retrospect this criterion has largely been violated (see §4). One exception, where we knew from the outset that a galaxy was in a group, was the field containing NGC 3613 and NGC 3619, which lie close to the sightline towards MCG+10. This AGN was eventually included due to the rarity of finding a bright background probe so close to a foreground galaxy. Also, the galaxy group around NGC 6654A, which is kpc away from the sightline towards Q1831+731, and thus slightly beyond the 160 kpc limit initially imposed, was still included in our final sample since the QSO was already selected due to its proximity to NGC 6654.
Finally, we imposed several more practical constraints: we favored probes within HST’s Continuous Viewing Zone to double the length of the available exposure times, and preference was given to QSO and AGN with known UV fluxes in order to estimate accurate exposure times for the required signal-to-noise (S/N) of the observations. As will be seen from the data, uniform S/N was not obtained for all the spectra, since the far-UV flux was known for only three QSOs.
The QSO-galaxy pair Mrk 1048 and NGC 988 was initially selected as part of our sample. However, prior to the execution of our program, we found that the AGN was already due to be observed by another group (GO program 7345), and we therefore removed it from our observing plan. However, since the pair were initially selected, we include the data here, extracted from the HST Archive.
2.2 Physical parameters of sample galaxies
The list of probes observed in our program is given in Table 1. The galaxies foreground to these QSOs and AGN are listed in Table 2. Most parameters in Table 2 are taken directly from the RC3, although G1341+2555 is not listed therein, and data are taken instead from Bowen et al. (1995). Galaxy morphology is taken from the NASA Extragalactic Database (NED).
Three probes turned out to have far-UV fluxes considerably less than expected from their visual magnitudes. ISO 1475+3554 was selected due to its proximity on the sky to the bright elliptical galaxy UGC 1308, 8.2 arcmins or 118 kpc away. SBS 1127+574 was observed due to its small separation from NGC 3683A, 12.6 arcmins or 88 kpc from the AGN sightline. The X-ray source MS 10473+35, lies 29.1 arcmin, or 137 kpc from NGC 3381, and was potentially a good probe of the face-on galaxy. All three probes had fluxes close to zero, rendering their data useless. They are listed in Table 1, but are not included in any further discussion.
| Exposure | |||||||||
|---|---|---|---|---|---|---|---|---|---|
| RA & DEC | Galactic | Observation | Time | Observed | |||||
| Target | Alias | (J2000.0) | & | Type | Date | (min) | FluxbbFlux at Å in units of ergs cm-2 s-1 Å-1 | ||
| ISO 1475+3554 | … | 01:50:32.74 36:09:25.8 | 136.1 25.2 | 15.3 | 0.080 | Sy2 | 06-Sep-00 | 88.7 | |
| Mrk 1048 | NGC 985 | 02:34:37.72 08:47:15.7 | 180.8 59.5 | 14.3 | 0.043 | Sy1 | 17-Feb-99 | 62.2 | 5.0 |
| PKS 1004+130 | 4C+13.41 | 10:07:26.09 12:48:56.2 | 225.1 49.1 | 15.2 | 0.240 | QSO | 23-Mar-00 | 86.5 | 0.9 |
| MS 10473+35 | CGCG 184023 | 10:50:10.86 35:02:01.6 | 188.4 63.0 | 15.6 | 0.040 | Sy1.9 | 20-May-99 | 138.4 | |
| ESO 438G009 | 11:10:48.01 28:30:03.7 | 277.5 29.4 | 14.2 | 0.025 | Sy1.5 | 22-Mar-00 | 184.8 | 0.1 | |
| MCG+10111 | SBS 1116+583A | 11:18:57.72 58:03:23.9 | 144.2 55.1 | 15.7 | 0.027 | EmLS | 02-Nov-99 | 325.0 | 1.0 |
| SBS 1127+575 | … | 11:30:03.48 57:18:29.5 | 142.9 56.6 | 16.0 | 0.036 | Sy2 | 06-Sep-99 | 325.0 | |
| PG 1149110 | 11:52:03.45 11:22:24.4 | 280.5 48.9 | 15.5 | 0.049 | Sy1 | 22-May-00 | 134.5 | 0.1 | |
| PG 1341+258 | Ton 730 | 13:43:56.72 25:38:47.5 | 28.7 78.2 | 16.6 | 0.087 | Sy1 | 28-Jul-99 | 135.7 | 0.9 |
| Q1831+731 | IRAS F18315+7310 | 18:30:23.08 73:13:10.0 | 104.0 27.4 | 15.5 | 0.123 | Sy | 20-Jul-00 | 97.4 | 4.5 |
| Separations | |||||||||||||
|---|---|---|---|---|---|---|---|---|---|---|---|---|---|
| Intervening | |||||||||||||
| Target | Galaxy | Type | (km s-1) | (′) | ( kpc) | (′) | 2 | (Jy) | () | ||||
| (1) | (2) | (3) | (4) | (5) | (6) | (7) | (8) | (9) | (10) | (11) | (12) | (13) | (14) |
| PKS 1004+130 | UGC 5454 | SABdm | 2792 | 10.5 | 84 | 1.1 | 19.1 | 14.7 | 0.2 | 14.4 | 4.4 | 0.8 | |
| ESO 438G009 | UGCA 226 | SB(s)m | 1507 | 25.2 | 110 | 3.0 | 16.8 | 14.8 | 0.2 | 13.8 | 26.7 | 1.4 | |
| MCG+10111 | NGC 3613 | E6 | 1987 | 4.5 | 26 | 3.2 | 2.8 | 11.8 | 0.1 | 11.7 | … | … | |
| NGC 3619 | (R)SA(s)0+ | 1542 | 18.2 | 85 | 2.6 | 14.0 | 12.4 | 0.1 | 12.4 | 5.5 | 0.3 | ||
| PG 1149110 | NGC 3942 | SAB(rs)c pec | 3696 | 8.7 | 92 | 1.4 | 12.4 | 13.3 | … | 13.8 | 5.8 | 1.9 | |
| Q1831+731 | NGC 6654 | (R’)SB(s)0/a | 1821 | 27.2 | 143 | 2.7 | 20.1 | 12.6 | 0.2 | 12.4 | 17.2 | ||
| NGC 6654A | SB(s)d pec? | 1558 | 44.3 | 199 | 2.8 | 31.6 | 13.5 | 0.2 | 12.5 | 17.8 | 1.0 | ||
| Mrk 1048 | NGC 988 | SB(s)cd | 1504 | 36.3 | 158 | 4.7 | 15.4 | 11.9 | 0.2 | 10.9 | 34.2 | 1.8 | |
Note. — Explanation of table entries: (1) target ID; (2) foreground galaxy probed; (3) morphological type, taken from the NED; (4) galaxy heliocentric velocity, all from 21 cm measurements, except NGC 3613; (5) QSO-galaxy separation in arcmins; (6) physical distance of sightline from galaxy center in kpc derived from the listed galaxy velocity; (7) isophotal major diameter at a surface brightness level of 25 mag arcsec-2, corrected to a face-on inclination, from the RC3; (8) ratio of impact parameter to optical radius; (9) apparent -band magnitude from RC3; (10) error in from RC3; (11) apparent face-on -band magnitude, from RC3; (12) absolute -band magnitude derived from ; (13) 21 cm flux derived from RC3 entry with (Jy) = 6.97 ; limit for NGC 6654 taken from Eskridge & Pogge (1991); (14) H I mass derived from .
3 Observations & Data Reduction
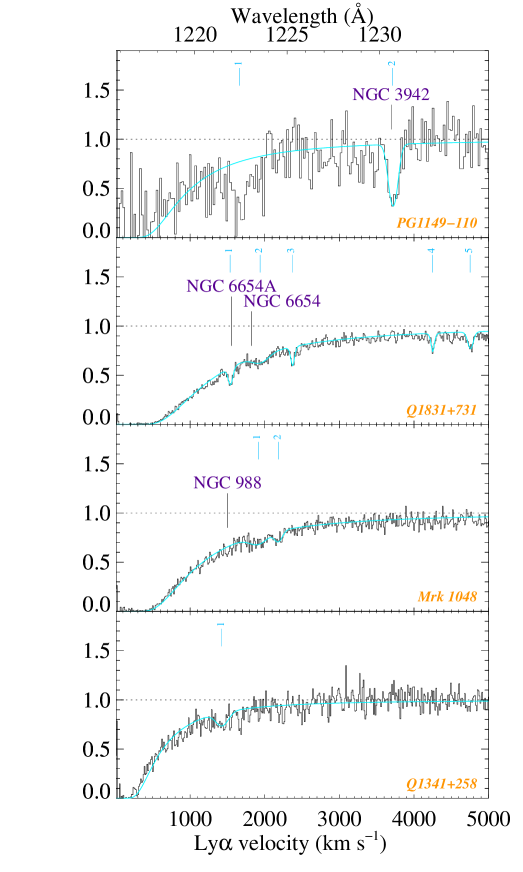
The HST STIS observations are journaled in Table 1. All data were taken with the G140M grating centered at 1222 Å and the 52x0.2 aperture. In most cases the spectra used were those extracted with standard pipeline calibration. For sources with a weak signal, we used the IRAF routine APALL to optimally extract data and improve the S/N of the spectra. Unless otherwise stated in §4, all data were resampled to the original dispersion of 0.05 Å pix-1.
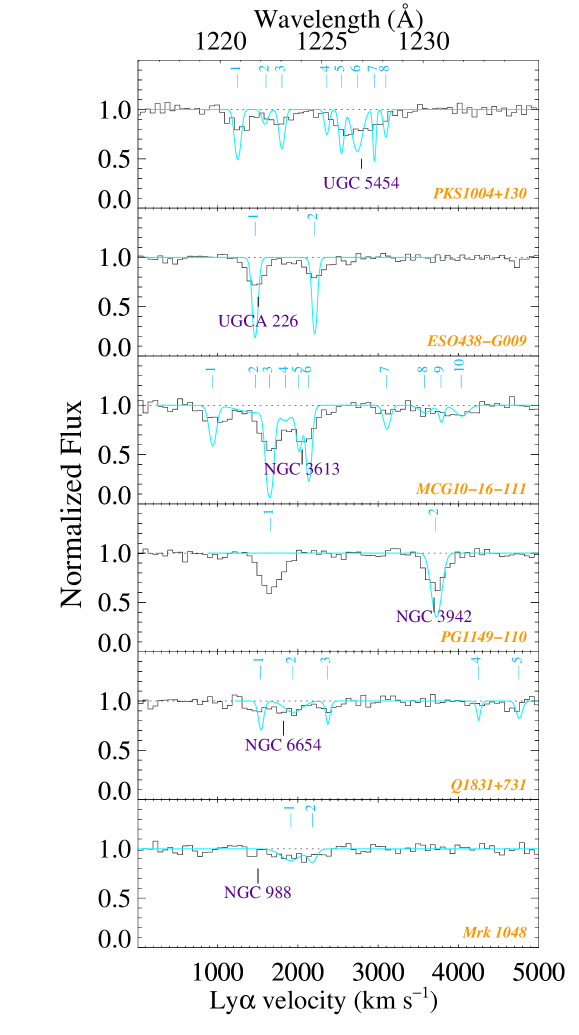
Normalization of the spectra was complicated by absorption from neutral hydrogen in the Milky Way, which produces a damped Ly profile extending over a significant velocity range. When the Galactic H I column density, (H I), is high, the QSO or AGN continuum may not return to its unabsorbed value for several thousand km s-1, which is a significant fraction of the total wavelength covered by our observations with the G140M grating. To normalize the data in a way which retains the Galactic absorption, a theoretical continuum must be fitted over a large wavelength region where there is no information on the continuum’s true value. Hence, to produce the normalized spectra in Figure 1, we required that (H I) from the Milky Way absorption (as derived from our profile fitting — see below) match that derived from 21 cm emission measurements in the Leiden/Dwingeloo H I survey data (Hartmann & Burton 1997). Although H I column densities measured from absorption and emission line methods need not be the same (due, e.g., to beam smearing in the 21 cm data), we found that the cores of the damped profile could be reproduced well when adopting (H I) from the radio data.
Of course, analysis of any narrow extragalactic absorption lines need not rely on data normalized this way, since it is always possible to normalize the narrow lines themselves relative to whatever continuum can be placed either side of a line. (That is, the data herein can be normalized in a way to simply remove the Milky Way Ly absorption.) However, some extragalactic Ly lines detected in our survey were at velocities which placed them on the damping wings of the Milky Way Ly profile where the change in flux with wavelength was rapid. We found that an ‘a priori’ knowledge of where the continuum should go — as defined by the (H I) column inferred from the 21 cm data — was useful when the S/N of the data was poor and the continuum either side of a weak line was ill-defined.
Measurements of the extragalactic lines themselves were made with the Galactic H I profile divided out of the data, although in Figure 1 we show the data with the Galactic absorption still present. Equivalent widths, , of detected Ly lines were measured in the usual way (see, e.g. Bowen et al. 1995) and are listed in Table 3. We measure equivalent widths of individual components whenever possible, but where lines are blended, we calculate over several components, indicating which components are covered in the column headed ‘’.
We also fitted theoretical Voigt profiles to the data, using a Line Spread Function (LSF) appropriate for the G140M grating at 1200 Å and the 52x0.2 aperture. This LSF is composed of a sharp narrow Gaussian core with a FWHM km s-1, convolved with a wide, shallow profile which can be represented by a Gaussian with a FWHM of km s-1. We fitted all Ly lines detected, not just those at velocities near the systemic velocities of the galaxies of interest, up to km s-1. Resulting recession velocities, , H I column densities, (H I), and Doppler parameters, , are listed in Table 3, along with the resulting theoretical equivalent widths, , derived from the final values of and (H I).
Errors in these values, , , are also given in Table 3. These were calculated using a Monte Carlo type simulation, described in detail in an earlier paper (Bowen et al. 1995). To recap, we take the synthetic spectrum derived from the best fit to the data as a template, and from this generate 100 new spectra with the same S/N as the original data. Each of these spectra are then refitted with theoretical Voigt profiles, again minimizing . Each spectrum generates a new value of , , and (H I). The distribution of values is usually Gaussian, so the values of listed in Table 3 are those for a normal error distribution. Errors in and need not be independent of each other, however. For example, a narrow line which covers only a few pixels is more sensitive to sudden changes at the bottom of the line profile, resulting in a dramatic increase in (H I) and a decrease in . The exact way in which (H I) and change in relation to each other for different spectra depends on the initial strength of a line, the S/N of the data, and the degree to which a line is resolved. Where the distribution of (H I) and are clearly not Gaussian, we simply take to be the value of (H I) and for which 68% of the points lie away from the mean value of (H I) and . Where (H I) and are strongly correlated, deviations in one quantity are always associated with deviations in the other quantity.

Obviously, these errors only take into account uncertainties arising from Poisson statistics, since the template spectrum itself suffers from the same systematic errors found in the data. Hence the errors do not account for incomplete knowledge of the multicomponent structure of a cloud, an erroneous LSF, or (for the derived values of ) errors in the wavelength calibration of STIS data. This latter quantity should be small; according to the STIS Handbook, the error in the absolute wavelength of spectra should be no more than pixels, or 26 km s-1. Errors arising from a poorly determined LSF will be small providing the line is resolved. When this is not the case, errors in and are large anyway, since and cannot be constrained with only one unresolved Ly line. (Such uncertainties are accounted for in the monte-carlo simulations, since and can deviate widely from their initial values with no discernible variation in a line profile.)
| Profile fitting (H I) | ||||||||||||||
|---|---|---|---|---|---|---|---|---|---|---|---|---|---|---|
| Intervening | aaThe equivalent width of a component derived from the values of and | |||||||||||||
| Target | Galaxy | (km s-1) | (Å) | (Å) | bbThe components (from column 7) included in the wavelength range over which the equivalent width was calculated. | # | (km s-1) | (km s-1) | (km s-1) | (km s-1) | (H I) | (Å) | ||
| PKS 1004+130 | UGC 5454 | 2792 | 0.22 | 0.02 | 1 | 1 | 1252 | 5 | 49 | 10 | 13.67 | 0.05 | 0.20 | |
| 0.08 | 0.03 | 2 | 2 | 1604 | 7 | 51 | 15 | 13.02 | 0.06 | 0.05 | ||||
| 0.13 | 0.02 | 3 | 3 | 1802 | 7 | 46 | 15 | 13.49 | 0.09 | 0.14 | ||||
| 0.67 | 0.05 | 4-8 | 4 | 2362 | 5 | 37 | 13 | 13.16 | 0.20 | 0.07 | ||||
| 5 | 2545 | 7 | 38 | 13 | 13.48 | 0.08 | 0.14 | |||||||
| 6 | 2741 | 5 | 83 | 13 | 13.76 | 0.05 | 0.26 | |||||||
| 7 | 2954 | 3 | 22 | 15 | 13.38 | 0.20 | 0.10 | |||||||
| 8 | 3096 | 8 | 36 | 16 | 13.20 | 0.08 | ||||||||
| ESO 438G009 | UGCA 226 | 1507 | 0.51 | 0.20 | 1 | 1 | 1469 | 5 | 30: | 10 | 14.13: | 0.2: | 0.31 | |
| 0.23 | 0.04 | 2 | 2 | 2211 | 6 | 25 | 14.08 | 0.25 | ||||||
| MCG+10111 | NGC 3619 | 1542 | 0.20 | 0.01 | 1 | 1 | 936 | 3 | 51 | 4 | 13.64 | 0.02 | 0.19 | |
| 0.62 | 0.02 | 2-4 | 2 | 1472 | 84 | 50 | 13.48 | 0.12 | 0.10 | |||||
| 3 | 1645 | 1 | 40 | 2 | 14.45 | 0.04 | 0.47 | |||||||
| NGC 3613 | 1987 | 0.54 | 0.02 | 4-6 | 4 | 1844 | 24 | 101 | 13.33 | 0.14 | 0.11 | |||
| 5 | 2012 | 3 | 38 | 6 | 13.61 | 0.05 | 0.17 | |||||||
| 6 | 2133 | 1 | 32 | 3 | 14.04 | 0.03 | 0.29 | |||||||
| 0.10 | 0.02 | 7 | 7 | 3104 | 6 | 49 | 11 | 13.32 | 0.05 | 0.10 | ||||
| 0.11 | 0.02 | 8-9 | 8 | 3578 | 30 | 98 | 13.00 | 0.05 | ||||||
| 9 | 3783 | 7 | 31 | 14 | 13.04 | 0.09 | 0.05 | |||||||
| 0.09 | 0.01 | 10 | 10 | 4034 | 18 | 103 | 29 | 13.20 | 0.08 | 0.08 | ||||
| PG 1149110 | NGC 3942 | 3696 | 1.1 | 0.3 | 1 | 1 | 1660 | 15 | … | … | … | … | … | |
| 0.39 | 0.10 | 2 | 2 | 3716 | 14 | 71 | 14.04 | 0.41 | ||||||
| PG 1341+258 | … | … | 0.12 | 0.02 | 1 | 1 | 1425 | 16 | 110 | 18 | 13.40 | 0.08 | 0.13 | |
| Q1831+731 | NGC 6654A | 1558 | 0.11 | 0.02 | 1 | 1 | 1536 | 3 | 32 | 5 | 13.33 | 0.03 | 0.10 | |
| NGC 6654 | 1821 | 0.11 | 0.02 | 2 | 2 | 1938 | 13 | 148 | 20 | 13.38 | 0.05 | 0.12 | ||
| 0.10 | 0.02 | 3 | 3 | 2368 | 4 | 21 | 6 | 13.15 | 0.05 | 0.06 | ||||
| 0.05 | 0.01 | 4 | 4 | 4246 | 4 | 15 | 10 | 13.00 | 0.05 | |||||
| 0.09 | 0.05 | 5 | 5 | 4752 | 5 | 40 | 8 | 0.05 | 0.07 | |||||
| Mrk 1048 | NGC 988 | 1504 | 0.12 | 0.01 | 1 | 1 | 1913 | 23 | 162 | 33 | 13.43 | 0.09 | 0.13 | |
| 0.08 | 0.01 | 2 | 2 | 2183 | 17 | 67 | 27 | 13.12 | 0.13 | 0.07 | ||||
Most lines measured in our data appear to be resolved, suggesting that (H I) is reasonably well constrained. Of course, we cannot exclude the possibility that lines are actually comprised of several components, with broad lower column density absorption lines masking narrow higher (H I) components.
4 Results
In the following subsections we outline the available data on each QSO-galaxy field studied.
Although we selected sightlines to pass close to nearby galaxies, we also have the opportunity to define the environment of these galaxies because of their low redshifts. Indeed, given the interest in whether or not Ly clouds trace the same large scale structure as galaxies, it seems incumbent on us to explore any relationship which might exist between such structures and Ly absorbers. Unfortunately, our experiment was not initially designed to encompass such inquiries, and to proceed further we need to use published galaxy catalogs. To this end, we have selected all galaxies from the electronic version of the RC3222Catalog 7155, as distributed by the Astronomical Data Center (ADC) at NASA Goddard Space Flight Center. which lie within 691 arcmins of each QSO/AGN. This radius corresponds to 2 Mpc at a redshift of 1000 km s-1, roughly the cut-off in velocity for which Ly can be seen before being lost in the damped Ly profile of the Milky Way. The RC3 is “reasonably complete for galaxies having apparent diameters larger than 1 arcmin at the isophotal level and total -band magnitudes brighter than about 15.5” (de Vaucouleurs et al. 1991). We have also searched the NED within a radius of 300 arcmin (the maximum search radius allowed) or 868 kpc at 1000 km s-1, for all galaxies with known redshifts, irrespective of their magnitudes.
Obviously, neighboring galaxies collated in this way do not form a complete magnitude limited survey. For example, a lack of redshifts in any given field does not necessarily imply that no galaxies exist, merely that no measurements of their redshifts have been made. Similarly, any peak in the galaxy distribution at low redshift may be misleading, since the absence of galaxies beyond a few thousand km s-1 may again merely reflect the fact that a particular area of sky has not been surveyed to any depth in redshift. It is therefore important to realize that the histograms shown in §4 represent a ‘first-look’ at the distribution in redshift of all galaxies with known redshifts. We defer a more rigorous analysis of these distributions until §5.
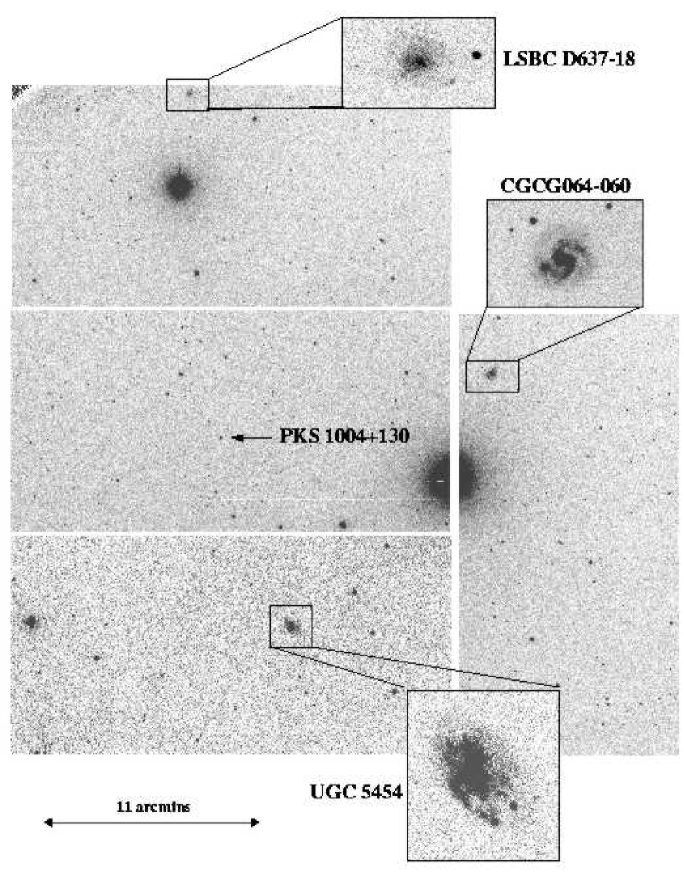
4.1 PKS1004+130 & UGC 5454
The sightline to PKS 1004+130 passes 10.5 arcmins or 84 kpc from UGC 5454, a SABdm galaxy with a velocity of km s-1. Figure 2 shows a 200 sec -band Wide Field Camera (WFC) image of the field taken at the Isaac Newton Telescope on 24-Nov-1998. The galaxy is irregular, with disturbed spiral arms containing discrete H II regions.
Two other galaxies are also visible in the CCD image. CGCG064060 lies 14.4 arcmins from the sightline, at a velocity of km s-1, which gives a separation of 368 kpc. The wavelength at which Ly might be expected from this galaxy is not covered by our G140M observations. The second galaxy of interest is a low surface brightness galaxy designated by Pildis et al. (1997) as D63718333see also http://zebu.uoregon.edu/js/dwarfs/d637-18.ps for full details., which lies 17.6 arcmin from the QSO sightline, or 138.1 kpc given its velocity of km s-1 (a redshift similar to that of UGC 5454). There also exists a third galaxy not shown in Figure 2 with a velocity close to UGC 5454: CGCG 064055 has km s-1 and arcmins kpc. We summarize the properties of all additional galaxies within 200 kpc of a sightline in Table 4.
Collating galaxies with known redshifts reveals a strong over-density of galaxies at a velocity similar to the UGC 5454 group. Figure 3 shows a histogram of galaxy velocities for objects within 2 Mpc of the line of sight. A clear peak can be seen at the same velocity as the three galaxies discussed above, making it likely that the group around UGC 5454 is part of a larger conglomeration of galaxies.
The nearest cataloged cluster of galaxies to the sightline is the M 96 group, which is 10 degrees away. The group has a velocity of 969 km s-1, which gives a linear separation between QSO sightline and the group’s center of 1.7 Mpc. [Assuming a distance of 11.2 Mpc to M96 measured from Cepheids (Tanvir et al. 1999) gives a separation of 2.0 Mpc.] The giant intergalactic cloud discovered by Schneider et al. (1983) is also only 9.9 degrees away; the ring has a heliocentric velocity of 8701050 km s-1, with the bulk of the absorption at 960 km s-1.
The STIS spectrum shows a cluster of Ly absorption lines centered on the systemic velocity of UGC 5454, with at least five components spread over 740 km s-1 (see Table 3 for details). Wills et al. (1999) have shown that there exists strong O VI, N V and Ly at redshifts of and which probably arise from outflows from the QSO. It is likely that we detect C III at 1210.2 Å from the system, which gives rise to the possibility that the Ly complex centered on the redshift of UGC 5454 is contaminated by another strong, high ionization line, N III at 1226.1 Å from this system. We note, however, that if this line does exist, it will only contaminate (or perhaps be responsible for) component 4 of the complex.
The velocity of the M 96 group and the giant H I cloud is considerably lower than that of UGC 5454 and its neighbors, but a Ly line (component 1 in Figure 1 and Table 3) is detected at 1252 km s-1. This Ly cloud may be associated with the outer regions of the M 96 group, or with some other member galaxy close to the QSO sightline whose redshift remains undetermined.
There are three possible ways to understand the absorption detected. As we discuss in §5.1, at higher redshift the absorption towards PKS 1004+130 would appear as a single strong resolved Ly line in the lower resolution FOS data. In a search for a galaxy responsible for the absorption, UGC 5454 would be the nearest to the sightline, but whether its redshift would be measured is unclear, since it would be fainter at higher . (For example, with an absolute magnitude of , the galaxy’s -band magnitude would range from 19.6 to 22.2 at and . The other two nearby galaxies, with magnitudes times fainter, would be even less likely to be identified at higher redshift.) Assuming it was identified, the results from the surveys of CLWB and Chen et al. (2001) would predict that UGC 5454 would be associated with a Ly line of strength Å at a radii of 101 kpc [using their value of and the relationship kpc]. Our observations are consistent with this expectation: the integrated Ly equivalent width is 0.68 Å at an observed impact parameter of 84 kpc.
The higher-resolution STIS observations, however, show us that the absorption line is actually a complex of individual components. Ortiz-Gil et al. (1999) have suggested that the complex system of Ly lines towards Q1545+2101 observed with the GHRS aboard HST might arise in the overlapping halos of individual galaxies in dense regions (in this case, the cluster surrounding the observed QSO, since ). With the field around PKS 1004+130 well sampled (at least to the limit of the RC3), we have a fairly good inventory of galaxies close to the line of sight. The absorption systems at towards Q1545+2101 covers a range of 535 km s-1, a little smaller than the 740 km s-1 seen towards PKS 1004+130, but the complexity and velocity span suggests a similarity between the systems.
For PKS 1004+130, however, it seems harder to make the case that overlapping halos of galaxies in the group generate the multi-component, high-velocity spread within the Ly absorption system. The galaxies in the group are faint and distant from the sightline. For the absolute magnitudes given in Table 4, the three galaxies would be predicted by CLWB to have Ly-absorbing radii of 100, 42 and 72 kpc . The latter two radii are smaller than the actual impact parameters of the galaxies, i.e. the galaxies are too far away to produce the observed lines. There are also at least five lines comprising the system, whereas we only know of three galaxies within 200 kpc of the sightline. On the other hand, the predicted radii of galaxies at higher- assume that Ly lines would have strengths Å. Individual components marked in Figure 1 have equivalents widths ranging from Å (component 3) to Å (component 5), all less than 0.3 Å. If the anti-correlation of and continues for faint galaxies over large distances, then it is possible that more distant galaxies contribute to the absorption complex. Nevertheless, the fact that the group of three is not particularly rich, and that one galaxy would have to produce more than one component to contribute to the five observed, makes it less likely that the halos of individual galaxies in the group produce the observed absorption.
There are two other possible explanations for the observed Ly complex. Absorption might arise from a turbulent outflowing wind from UGC 5454. The galaxy appears irregular and may be actively forming stars. Heckman et al. (2000) have suggested that superwinds from active star-forming galaxies are blowing metals into the intergalactic medium (IGM), enriching gas to a metallicity as high as of the solar value. However, the mean velocity of the absorption lines towards PKS 1004+130 is not displaced with respect to the galaxy’s systemic velocity, as might be expected from material flowing towards or away from us. The wind would likely have to be expelled perpendicular to the plane of the sky to cause absorption at both positive and negative velocities with respect to UGC 5454’s systemic velocity, as is observed. Such an alignment is not impossible of course, and further study of UGC 5454 is needed to determine the nature of this galaxy.
Finally, Figure 3 shows that the group galaxies discussed mark the presence of a strong over density of galaxies at precisely the velocity of the center of the observed absorption line complex. Since the large velocity dispersion is more in keeping with that of a cluster, it is possible that the absorption arises from intragroup or intracluster gas, material not necessarily located in the same physical space as UGC 5454. The existence of faint galaxies near the line of sight would then simply be a coincidence.
| Intervening | |||||
|---|---|---|---|---|---|
| Galaxy | (km s-1) | (′) | ( kpc) | ||
| sightline: PKS 1004+130 | |||||
| UGC 5454 | 2792 | 10.5 | 84.3 | 14.4 | |
| LSBC D63718 | 2740 | 17.6 | 138.1 | … | |
| CGCG 064055 | 2789 | 24.7 | 197.6 | 15.3 | |
| sightline: ESO 438-G009 | |||||
| UGCA 226 | 1507 | 25.2 | 110 | 13.8 | |
| ESO 438G012 | 1322 | 35.9 | 137 | 13.7 | |
| ESO 438G010 | 1487 | 36.3 | 155 | 14.3 | |
| sightline: MCG+10 | |||||
| CGCG 291052 | 9753 | 1.3 | 35.2 | 15.1 | |
| SBS 1116+583B | 9905 | 3.6 | 98.8 | 19.5 | |
| NGC 3613 | 1987 | 4.5 | 25.5 | 11.7 | |
| NGC 3619 | 1542 | 18.2 | 81.0 | 12.4 | |
| UGC 6304 | 1762 | 19.8 | 100.6 | 16.5 | |
| NGC 3625 | 1940 | 20.7 | 115.7 | 13.2 | |
| UGC 6344 | 1934 | 22.1 | 122.9 | 17. | |
| SBS 1119+583 | 1623 | 27.6 | 129.2 | 17. | |
| SBS 1114+587 | 1594 | 31.3 | 144.0 | 17.5 | |
| SBS 1119+586 | 1583 | 33.3 | 152.1 | 19.5 | |
| sightline: Q1831+731 | |||||
| NGC 6654 | 1821 | 27.2 | 143 | 12.5 | |
| MCG+12-17-027 | 1404 | 43.7 | 177 | 17.0 | |
| UGC 11331 | 1554 | 43.7 | 196 | 15.4 | |
| NGC 6654A | 1558 | 44.3 | 199 | 12.5 | |
| sightline: Mrk 1048 | |||||
| NGC 988 | 1504 | 36.3 | 158 | 10.9 | |
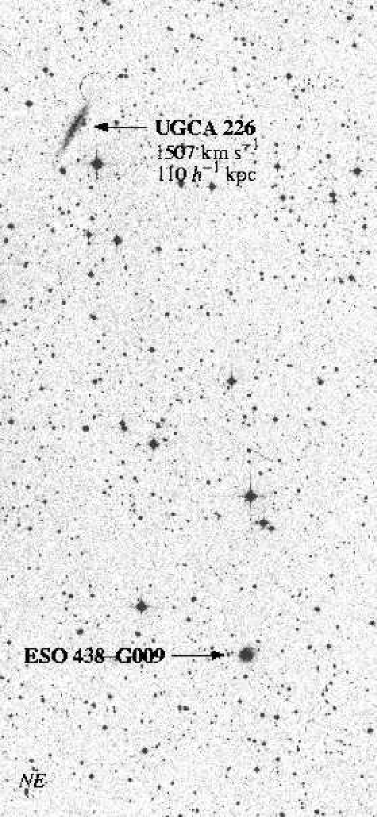
4.2 ESO 438-G009 & UGCA 226
UGCA 226 is a highly inclined SB(s)m galaxy with a velocity of km s-1 lying 25.2 arcmins or 109.6 kpc from ESO 438G009. A DSS image of the field (Figure 4) shows the galaxy to be relatively isolated, with no obvious companions. ESO 438G012 ( km s-1), 35.9 arcmins away ( kpc), is the next nearest galaxy with a known redshift, with ESO 438G010 ( km s-1) a close second, 36.3 arcmins ( kpc) away. These objects may constitute a loose group of galaxies. Within a 2 Mpc radius of the sightline there are additional galaxies at the velocity of UGCA 226 and its neighbors (Figure 5). The nearest cataloged cluster is Abell S0657, 29.9 arcmins away, but no redshift information is available for that cluster. The NGC 3923 group is 8.8 degrees away, or 3.7 Mpc given its velocity of 1788 km s-1— UGCA 226 and its neighbors may lie at the outer edges of that group.
Figure 1 shows that Ly is detected close to the redshift of UGCA 226, even though the S/N of the spectrum is poor (the data are rebinned to 0.1 Å pix-1 in the figure). As a result of the low quality of the data, and the position of the absorption on the damped wing from Milky Way absorption, a fit of a theoretical line profile is not well constrained, particularly blueward of the line where the flux is approaching zero. Hence we have primarily used the red wing of the line to derive km s-1 and (H I) at km s-1 for a single cloud. It is possible that additional absorption exists to the blue of this component, but without better quality data, adding additional components is unjustified. Also visible in Figure 1 is complex Si III at 0.0237, 0.0229 and 0.0216, close to the emission redshift of the AGN (). Not shown in the figure is the corresponding Ly absorption, which is extremely strong and indicative of a Broad Absorption Line (BAL) feature.
The only nearby galaxy with a known redshift similar to that of a strong Ly line at 2211 km s-1 (component 2) is ESO 438G006, an irregular galaxy 110 arcmins or 696 kpc from the sightline.
This field is obviously similar to that previously described towards PKS 1004+130 in §4.1, with the existence of three galaxies all within 200 kpc of the QSO sightline, and roughly similar luminosities (compare entries in Table 4). In that case the absorption is half as strong and does not show obvious complex multi-structure, although the data is of lower S/N than that of PKS 1004+130 and the line is on the wing of the Milky Way damped Ly profile. Better quality data is needed to fully resolve whether there is a large number of components comprising the line.
4.3 MCG+1016111 & NGC 3613/3619
The sightline to MCG+10111 passes 4.5 arcmins or 25.5 kpc from the E6 galaxy NGC 3613, which has a velocity of km s-1. It also passes 18.2 arcmins or 85.3 kpc from NGC 3619, a lenticular S0/Sa galaxy with a velocity of km s-1. Both galaxies can be seen in a DSS image reproduced in Figure 6. The figure also shows many other galaxies with velocities similar to both NGC 3619 and NGC 3613 nearby. Table 4 lists galaxies with known redshifts lying within 200 kpc of the sightline. NGC 3613 and NGC 3619 obviously lie in a rich group of galaxies, and a collation of galaxies out to 2 Mpc (Figure 7) shows that NGC 3619 in particular is part of a large over-density which arises from the outer regions of the Ursa Major cluster. The center of Ursa Major is 10.3 degrees away, which at a velocity of km s-1 (lower than NGC 3613 & NGC 3619), corresponds to 1.7 Mpc. A reproduction of the galaxy distribution presented by Tully et al. (1996) in the form of a pie-diagram is shown in Figure 8, annotated to include the line of sight towards MCG+10111. The velocity of NGC 3619 well matches that of the sub-groups labelled 12-3 and 12-5. Several galaxies can also be seen at the higher velocity of NGC 3613.
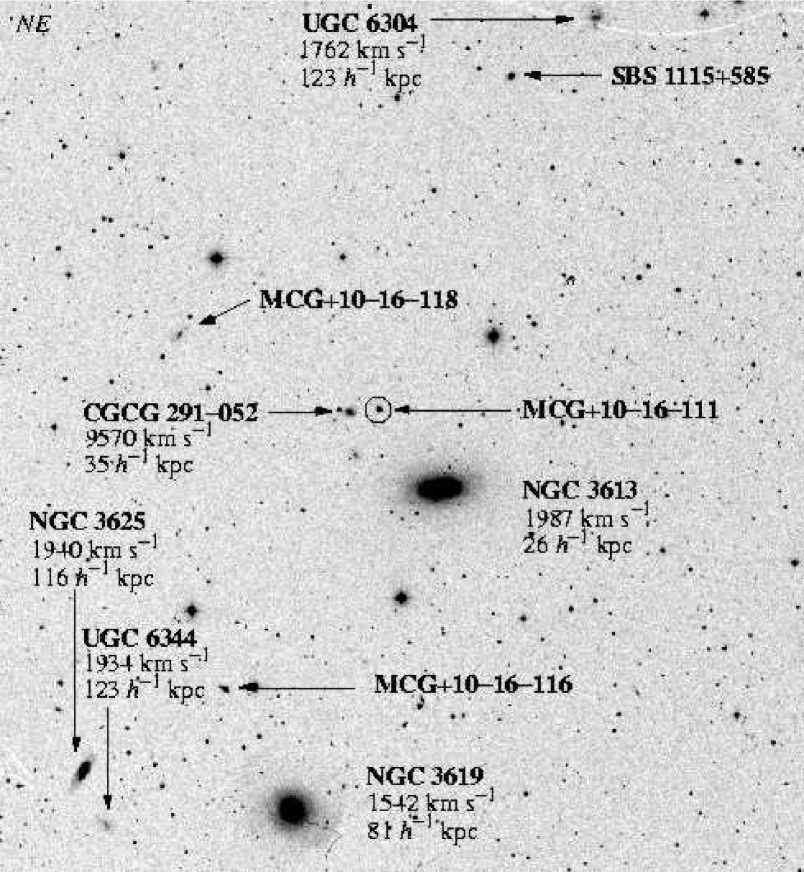
At the time we selected MCG+10111 to be observed with HST, the redshift of the closest galaxy to the sightline on the plane of the sky, CGCG 291052, with arcmins, was not known. We obtained a spectrum of this galaxy using the ISIS spectrograph at William Herschel Telescope on La Palma on 26-Nov-1998, and measured a velocity of km s-1. The redshift of this galaxy has also now been listed in the Updated Zwicky Catalog (Falco et al. 1999) with km s-1, close to our measured value. These velocities give a separation of 35 kpc, but our G140M spectrum does not cover the wavelength region where Ly absorption would be expected.
Strong Ly lines are seen at velocities close to both NGC 3619 and NGC 3613 (Figure 1). The strongest line (component 3 in Figure 1 and Table 3) at 1645 km s-1 is +103 km s-1 from NGC 3619’s systemic velocity (and 340 km s-1 from NGC 3613). Si III is also detected at the same velocity as this line. Although the strong line can be well fit with a single theoretical component, an additional weak, broad line is required at 1472 km s-1 (component 2) to fit the blue wing of component 3. This component is needed because there appears to be a significant deviation in the continuum at that velocity. If this line is really composed of only one component, then it seems to be particularly broad, with km s-1. Unfortunately, the blending of the line with the rest of the complex makes it very hard to reliably constrain either or (H I).
Absorption is seen close to the velocity of NGC 3613 (1987 km s-1) as well, split into two components (5 and 6) at 2012 and 2133 km s-1. There is also need for a weak component between the strong lines (component 4) since a clear decrement exists in the continuum between component 3 and components 4/5. The profile fit to the weak feature is not well constrained, blended as it is with the strong flanking lines. Formally, we derive km s-1 if the line is a single component. If the line width was purely a function of the gas kinetic temperature, , then , or K. Such temperatures might be indicative of a hot gas cloud cooling within the intragroup medium.
The velocities of galaxies in the Ursa Major cluster itself range from 8001300 km s-1, and we detect Ly absorption at km s-1 (component 1). Determining whether this arises from gas loosely bound to the cluster, or from a cluster member much closer to the line of sight, will require a complete redshift survey of the field.
NGC 3613 is the galaxy with the smallest separation from a QSO sightline in our sample (26 kpc), and the field around the line of sight has the highest density of galaxies of galaxies of all the fields presented herein. We can consider the absorption in two ways. First, the total spread of absorption components is 660 km s-1, similar to the 740 km s-1 seen towards PKS 1004+130 (§4.1). The fields would seem to be analogous, in that a rich group of galaxies has produced strong, complex absorption. The total equivalent width of components is Å, the strongest complex in our sample. Our original goal, however, was to explore how gas was distributed around individual galaxies. The detection of the strongest lines close to the velocity of the nearest, brightest galaxies naturally leads us to view individual absorption components as associated with individual galaxies. Indeed, the distribution of components in velocity fits well the model of individual galaxies surrounded by their own halos: NGC 3613 and NGC 3619 both have systemic velocities within 150 km s-1 of the strong absorption components (3 and 6 in Figure 1) while component 4 could be ascribed to the next nearest bright () galaxy, NGC 3625, which has a velocity of 1940 km s-1 (a difference of 96 km s-1 from the Ly line) and is 116 kpc from the line of sight.
Again, however, Figures 7 and 8 warn that such associations may be coincidental. There is no doubt that component 3 of the absorption complex is also ‘associated’ with a strong and (apparently) narrow over-density of galaxies within a 2 Mpc radius of the line of sight. In this case we know the large-scale structure of the galaxy distribution, namely the Ursa Major cluster. There is a hint of a similar over-density at the velocity of component 5, although here the peak is small and poorly defined. It may be that some or all of the absorption seen actually arises from intracluster gas. The detection of a broad Ly component (number 4) may also support such an idea. If true, the coincidence in velocity between absorbing gas and the two individual bright galaxies suggests that both gas and stars must closely follow the same dark matter potentials.
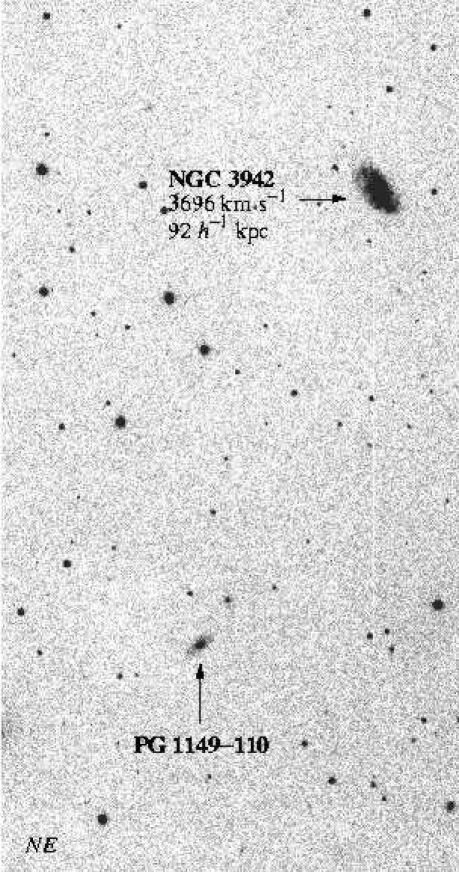
4.4 PG1149110 & NGC 3942
The sightline to PG1149110 passes 8.7 arcmins or 92 kpc from the SAB(rs)c galaxy NGC 3942 which has a velocity of km s-1. Figure 9 shows a 200 sec -band INT WFC image of the pair taken 24-Nov-1998. The next nearest galaxy with a known redshift is MCG, and, with a velocity much lower than NGC 3942 (1271 km s-1) and an angular separation of 69 arcmins, is 253 kpc from the sightline. This galaxy appears to form part of a group of galaxies at a velocity km s-1 (see Figure 10). The nearest galaxy at a velocity similar to NGC 3942 is Mpc away, suggesting that NGC 3942 is relatively isolated, although this may simply be that few redshifts have been obtained in the region beyond 3000 km s-1.
The S/N of the STIS spectrum obtained is poor, and the data are rebinned by a factor of two to 0.1 Å pix-1 in Figure 1. Nevertheless, moderately strong absorption is detected at the redshift of NGC 3942 (component 2 in Figure 1 and Table 3).
The nearest cataloged collection of galaxies is the NGC 3672 group, which lies 7.2∘ away from the QSO sightline. At the velocity of NGC 3672 itself (1862 km s-1) this separation corresponds to 2.3 Mpc. It is likely that galaxies shown in Figure 10 with velocities km s-1 are part of the NGC 3672 group. Ly absorption is also detected at 1660 km s-1 in the G140M spectrum (component 1 in Figure 1), and it may be that this line is associated with either intragroup gas or with an as yet unidentified group member. Unfortunately, the spectrum is particularly noisy at that point, and we cannot derive a reliable column density. The previous sections have indicated that in several cases absorption detected at galaxy redshifts splits into multicomponents spread over several hundred km s-1. We are unable to tell from the spectrum of PG 1149110 how complex the Ly line is, but we note that there does appear to be a depression in the continuum to the blue of the line (between 3100 and 3500 km s-1in Figure 1). It would be presumptuous to claim this feature as detection of absorption, but higher quality data would be useful in determining if the system actually comprises additional weaker absorption components spanning several hundred km s-1.
4.5 PG 1341+258 & G1341+2555
The sightline to PG 1341+258 passes by the North Galactic Pole, 1.9 arcmins from G1341+2555, although it avoids the high density regions of the Virgo and Ursa Major clusters. Included in the QSO-galaxy compilation of Monk et al. (1986), the redshift of G1341+2555 was originally listed by Moody & Kirshner (1988) as 5802 km s-1, giving a QSO-galaxy separation of 31 kpc. However, since our HST program was completed, a new redshift measurement has been published by Grogin & Geller (2000) [and included in the Updated Zwicky Catalog (Falco et al. 1999)]. The new value is unambiguously measured to be km s-1. Unfortunately, although the impact parameter between QSO and galaxy is still of interest, kpc, our STIS observations do not cover the wavelength region where Ly is expected (1275Å). Although the small impact parameter implied from the original redshift made the QSO-galaxy pair well-suited for our program, the new measurement means we must exclude the pair from further analysis. However, we do reproduce the spectrum of the sightline in Figure 1, since we will use the data in §5.2. We see a single, weak Ly line at a velocity of 1425 km s-1.
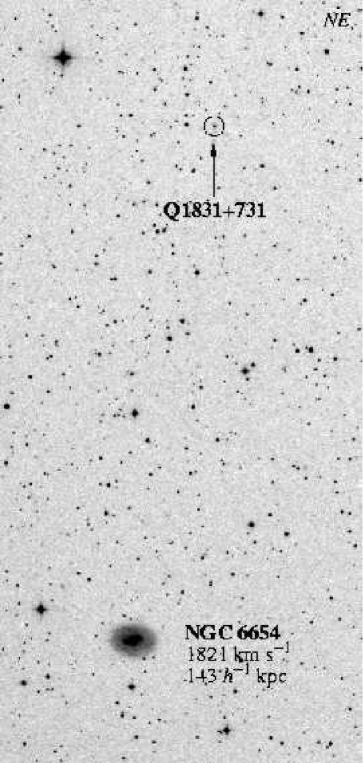
4.6 Q1831+731 & NGC 6654/NGC 6654A
The nearest galaxy to the sightline towards Q1831+731 is NGC 6654, an SB(s)0/a galaxy with a velocity of 1821 km s-1, which, given the impact parameter of 27.2 arcmins, corresponds to 143 kpc. A reproduction of a DSS image of the galaxy can be seen in Figure 11. Further away and at a lower velocity (1558 km s-1) lies NGC 6654A. Figure 12, also taken from the DSS, shows that NGC 6654A is actually the brighter member of a group of (at least) three, with the dwarf UGC 11331 ( km s-1) and a fainter galaxy MCG+12 ( km s-1) making up the group’s membership. The properties of all four galaxies are listed in Table 4. These latter galaxies are almost certainly part of the NGC 6643 group (Figure 13). NGC 6643 has a velocity of 1484 km s-1, and is separated by 92 arcmins or 395 kpc from the line of sight.
The sightline also passes 251 arcmins from NGC 6503, a nearby galaxy with a velocity of only 26 km s-1. However, its distance from us is thought to be Mpc (Bottema & Gerritsen 1997; Karachentsev & Sharina 1997), which makes the impact parameter kpc. The low recession velocity also ensures that any Ly absorption would be lost at the bottom of the damped Ly profile of our own Galaxy.
Figure 1 shows that three weak absorption lines are seen near the velocities of both NGC 6654 and NGC 6654A. We are again presented with the dilemma of whether to associate all components with NGC 6654, the NGC 6654A group, and/or the NGC 6643 group, or whether we should ascribe individual absorption components to individual galaxies. The velocity spanned by all three components is 830 km s-1, again similar to the spread in velocity seen towards PKS 1004+130 (§4.1) and MCG+1016111 (§4.3), although the lines are considerably weaker. The coincidence in velocity between component 1 and the NGC 6643 group, as shown in Figure 13, also suggests that absorption could be from intragroup gas. The Doppler width of component 2 is unusually wide, with km s-1, 35 times larger than the usual values seen in higher resolution GHRS data (e.g. Penton et al. 2000). Although the line could be composed of more than a single component, if absorption arises from a single cloud, the inferred kinetic temperature is K, a value which might reflect gas cooling in a cluster.

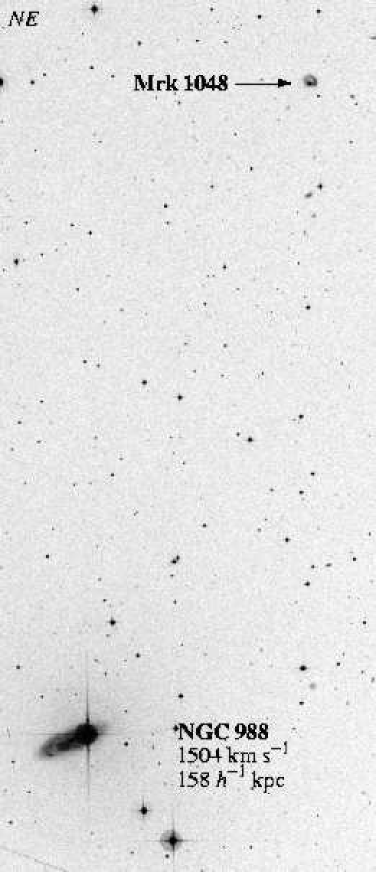
4.7 Mrk 1048 & NGC 988
The sightline to Mrk 1048 passes 36.3 arcmins or 158 kpc from NGC 988, an SB(s)cd with a velocity of 1504 km s-1. Inspection of a DSS image around Mrk 1048 (Figure 14) shows no obvious bright galaxies closer to the sightline than NGC 988, suggesting that the galaxy is relatively isolated. However, van Gorkom et al. (1986) suggest that NGC 988 may be part of the NGC 1052 group, which, combined with the NGC 1069 group, makes up the Cetus I cloud. NGC 1052 is 100.9 arcmins from the sightline, or 429 kpc at its velocity of 1473 km s-1. Hence the sightline to Mrk 1048 intercepts the group (whether or not NGC 988 is a member) at this impact parameter assuming NGC 1052 marks the group’s center. Within 1 Mpc of the sightline there are 21 galaxies with known redshifts, of which 14 lie within km s-1 of NGC 1052 (Figure 15).
Weak Ly absorption is detected at velocities of 1913 and 2182 km s-1, +409 and +678 km s-1 redward of NGC 988’s systemic velocity. Profile fitting of the first of these components is difficult since the line is weak and broad, and lies on a region of the spectrum where the flux is declining rapidly due to Milky Way Ly absorption. Nevertheless, we derive a value for the Doppler parameter of km s-1 for component 1 (Table 3) and if the line is composed of only one component, it may represent absorption from hot gas with a kinetic temperature of K.
The Ly lines towards this target are the most poorly matched absorption features in our sample to either individual galaxies or to the groups of galaxies. Compared to the overall distribution of galaxies with known redshifts within 2 Mpc of the sightline (Figure 15), the first absorption line at 1913 km s-1 is close to, but certainly not coincident with, the velocity of the NGC 1052 group. In fact, both absorption lines appear to lie in velocity between the NGC 1052 group and a loose collection of galaxies comprising of Mrk 1042, DDO023, Mrk 1039 and VV 525, some 800 kpc from the sightline. The only evidence that suggests any of the gas might be intragroup gas is the large Doppler parameter of component 1. The detection of absorption at a velocity close to NGC 988 makes it possible that the absorber is related to the galaxy, but the 400 km s-1 velocity difference is quite large, and would probably have to be explained by material infalling or outflowing from the galaxy.
5 Correlations and Interpretations
The previous section indicates that we find absorption within 500 km s-1 of all eight galaxies studied, with individual Ly lines appearing to cluster at the same velocities as the galaxies. The original intention of this program was to establish how the physical properties of a Ly absorbing cloud correlate with those of a particular galaxy. However, to make such a connection, we immediately encounter the problem of how to associate an absorbing cloud with an individual galaxy. In our survey, there are several cases where absorption arises in several components close to (but not necessarily coincident with) the systemic velocity of a galaxy. The first problem is deciding which components to associate with the galaxy. The situation is further complicated if there is more than one galaxy close to the line of sight (e.g., NGC 3616/3619 and NGC 6654/6654A) and at similar velocities, since absorption assigned to one galaxy might be more properly associated with another.
For example, we could simply take as ‘associated’ the absorption component nearest in velocity with that of a probed galaxy. The consequences of this would be that all the substructure seen in the lines towards PKS 1004+130 (components 3,4,6 and 7 in Figure 1) would not be counted, which would likely be an inadequate description of the absorbing gas along the sightline. Also, towards MCG+10, component 5 would be associated with NGC 3613, although it is actually the weaker of the two lines (components 5 and 6) forming the absorption structure at km s-1. Hence this method seems unsatisfactory. Alternatively, we could count all absorption components within a velocity interval of the systemic velocity of the galaxy, taking to be, say, some value between that expected for gas co-rotating in a disk ( km s-1, depending on galaxy inclination) and the dispersion of a fairly rich galaxy group ( km s-1). Such a scheme would certainly include all five components clustered around UGC 5454’s velocity towards PKS 1004+130 for example. However, rigorous application of the counting scheme in cases where more than one galaxy is present would lead to a situation of ‘double counting’ of absorption lines. Components 1 & 2 in Figure 1 towards Q1831+731 would have to each be counted for both NGC 6654 and NGC 6654A, since both lines fall within km s-1of each galaxy, and the value of would need to be at least this high because of the difference in velocity between absorber and galaxy. Similarly, the strong absorption component 3 towards MCG+10 would have to be counted once for NGC 3619 and again for NGC 3613, since the absorption lies km s-1 from NGC 3619 and km s-1 from NGC 3613.
Of course, such double counting could be overcome by making the chosen sufficiently small. However, at some point, is so small that only one line is counted, and we have returned to the first suggested method of counting absorption lines by selecting only those closest in velocity to a galaxy.
In reality, deciding which method to use (or, equivalently, deciding how small should be) almost presupposes some model of how Ly clouds are associated with galaxies. If the underlying assumption is that a galaxy and absorber are associated on a one-to-one basis, e.g. as a result of absorption from a co-rotating disk or halo, then it would make more sense to count only the component nearest in velocity. Conversely, choosing absorption lines within a certain velocity range — at least when more than one galaxy is present — would be a method chosen if the gas is assumed to be part of the gravitational potential that a galaxy group shares.
It is actually easier to consider whether our results are consistent with those seen at higher redshift and to examine how our results would be interpreted in higher- surveys by degrading our STIS data to the lower resolution of FOS data. We perform such an experiment in the following section.
5.1 Degrading STIS data to FOS resolutions
To synthesize how our QSO/AGN spectra would appear if obtained with the FOS, we have taken the profile fits to the normalized data and convolved the spectra with a Gaussian of FHWM of 1.0 Å, which approximates the LSF of the G130H FOS grating. Ly lines observed at higher redshift would have been observed with all three available UV medium-resolution gratings, but the resolutions of all the gratings were similar, or 230 km s-1. Post-COSTAR, the LSFs of FOS gratings show some departures from Voigt profiles at high S/N, but no theoretical LSFs are available (Keyes 1997), and the use of a Gaussian is likely sufficient for this exercise. The convolved spectra have then been rebinned to the FOS G130H dispersion of 0.25 Å pix-1. The resulting spectra are shown in Figure 16. This figure differs from the original data presented in Figure 1 in that we have removed the Galactic damped Ly profile in order to better show the lower resolution features. The original (STIS-resolution) theoretical line profiles are superimposed on the plot to show how the data originally appeared. The velocity of the nearest galaxies to the line of sight is also marked.
In these lower resolution data, how would the equivalent widths of Ly lines be measured and which galaxies would the lines be associated with? LBTW and CLWB take the galaxy nearest to the sightline as being responsible for Ly absorption when more than one is detected at similar redshifts. UGC 5454 would be taken to be the nearest galaxy to the sightline of PKS 1004+130; the individual components within the complex profile discussed in §4.1 would be unresolved. We assume that only this broad line would be identified as the absorption system, and that weaker lines (components 1 and 2) would not be included in a measure of the equivalent width. The values of the total equivalent width, and for UGCA 226 towards ESO 438G009, and NGC 3942 towards PG 1149-110, would be unaffected. The absorption system towards MCG+1016 would appear as two lines, but most likely counted as one system, with NGC 3613 identified as the absorbing galaxy. Again, we adopt for only the two lines, and do not include a contribution from component 1. It is somewhat harder to decide which, if any, of the components towards Q1831+731 and Mrk 1048 would be detected in FOS data, since the lines are weak, and their detection would be much more sensitive to the exact S/N of the data. From our simulation, although the individual components towards Q1831+731 are, in principle, resolved from each other, at their respective velocities, (and given the S/N adopted here) they blend to form a single broad line. Similar, for Mrk 1048, the two components would be blended together to form a shallow, single broad line. For both cases, therefore, we take the value of that would be measured to be sum of the equivalent widths of all the components seen at higher resolution. As we shall see, taking these sums as upper limits (if only one of two components were detected) does not affect our conclusions.
Looking at Figure 16, it seems clear that with these assignments, we are effectively summing equivalent widths of components over a range of km s-1. The only exception is towards ESO 438G009, where components 1 and 2 are separated by 740 km s-1, but we have ‘associated’ only component 1 with UGCA 226. Let us formalize the associations and take 1000 km s-1 as the range over which we count ‘one’ line, but take only the nearest galaxy to the sightline as being associated. We summarize which components have been combined in Table 5. How then do the total equivalent widths, , correlate with ?
The results are shown in Figure 17. The plot of Ly line equivalent width, , against line-of-sight impact parameter, , is shown top of the Figure, along with the relationship found by CLWB for higher redshift Ly absorbers, const. Also plotted is the typical dispersion in their measurements with dashed lines (these represent % of their data points either side of their best fit). We find that the points lie well within the envelope of points found for high-redshift systems, although statistically, Spearman and Kendall rank-order correlation tests show an anti-correlation at a significance level of only 2.0 each.
CLWB also found a relationship between Ly equivalent width, impact parameter, and galaxy luminosity of the form
| (1) |
with
that is, they found that brighter galaxies have larger halos, or put another way, that brighter galaxies show stronger Ly equivalent widths at a given radius. In the middle panel of Figure 17, we plot against for the galaxies in our sample, corrected by a factor of , [assuming the absolute magnitude of an galaxy to be (Norberg et al. 2001b)], with CLWB’s anti-correlation plotted as a dashed line. We use the apparent magnitudes—uncorrected for inclination—given in Table 2, since these are more likely to represent the types of magnitudes measured by CLWB for the high redshift galaxies. The figure demonstrates that the dispersion in our data points actually increases with this correction. Formally, both a Spearman and Kendall test find an anti-correlation at only the 0.9 level, lower than the significance for a correlation without a luminosity correction.
Although the galaxies in our sample do not follow the correlation found at higher redshift, we can still perform a simple fit of equation 1 to our data to see if there is any dependence of with galaxy luminosity. Performing such a test, we find
that is, the correlation is the opposite sense to that found for the higher-redshift sample, implying that stronger Ly lines are associated with fainter galaxies. We show how the correlation is afffected by correcting by a factor in the bottom panel of Figure 17. Although the points appear to be better correlated, statistically, a Spearman test finds the correlation to be significant at the 2.2 level, little different from the correlation without a luminosity correction (2.0). A Kendall test finds a correlation signficant at the 2.8 level, a somewhat better improvement over the 2.0 significance derived without a luminosity correction.

In summary: by summing individual Ly components over a width of km s-1 of the velocity of a galaxy next to the line of sight, and considering only the impact parameter of the nearest galaxy, we are able to reproduce the correlation of with seen at higher redshift. The correlation is weakened if we correct for galaxy luminosity in the way found for galaxies at higher redshift (Ly equivalent width being stronger around brighter galaxies at a given radius), but we are able to improve our correlation by correcting in the opposite manner (so that Ly equivalent width is weaker around brighter galaxies at a given radius). We discuss this apparent correlation in §6.
| No. of | ||||||||||
|---|---|---|---|---|---|---|---|---|---|---|
| Probe | (Å) | (Å) | (km s-1) | gals | ( Mpc-3) | |||||
| (1) | (2) | (3) | (4) | (5) | (6) | (7) | (8) | (9) | (10) | (11) |
| Ly complexes near pre-selected galaxies | ||||||||||
| PKS 1004+130 | 4-8 | 0.67 | 0.05 | 14.15 | 0.22 | 15.0 | 2200 3200 | 9 | 1.15 | |
| ESO 438G009 | 1-2 | 0.74 | 0.2 | 14.41 | 0.30 | 14.0 | 1340 2340 | 7 | 1.26 | |
| MCG+10111 | 2-6 | 1.16 | 0.03 | 14.69 | 0.28 | 14.5 | 1400 2400 | 12 | 1.02 | |
| PG 1149110 | 2 | 0.39 | 0.1 | 14.04 | 0.14 | 15.5 | 3200 4200 | 3 | 1.63 | |
| Q1831+731 | 1-3 | 0.32 | 0.03 | 13.77 | 0.26 | 15.0 | 1500 2500 | 2 | 1.80 | |
| Mrk 1048 | 1-2 | 0.20 | 0.02 | 13.60 | 0.33 | 14.5 | 1550 2550 | 1 | 2.10 | |
| Other Ly complexes in STIS spectra | ||||||||||
| PG 1341+258 | 1 | 0.12 | 0.03 | 13.40 | 0.08 | 15.0 | 925 1925 | 16.4 | 1 | 2.10 |
| PKS 1004+130 | 1-3 | 0.43 | 0.02 | 13.94 | 0.28 | 15.0 | 1100 2100 | 16.6 | 9 | 1.15 |
| MCG +10111 | 7-10 | 0.30 | 0.03 | 13.76 | 0.23 | 14.5 | 3050 4050 | 18.6 | 3 | 1.63 |
| PG 1149110 | 1 | 1.10 | 0.30 | … | … | 15.5 | 1160 2160 | 16.2 | 10 | 1.10 |
Note. — Explanation of table entries: (1) QSO/AGN probe; (2) component numbers in Table 3 which are covered in the integrated equivalent width; (3) the integrated equivalent width, equivalent to the sum of equivalent widths from the individual components covered, which would be measured over ; (4) error in the integrated equivalent width; (5) integrated column density, derived from the sum of individual column densities from components listed in (2); (6) error in the integrated column density; (7) adopted magnitude limit for the collated galaxies from the RC3; (8) velocity range over which galaxies were included when calculating ; (9) absolute magnitude of at the Ly complex redshift + 500 km s-1; (10) Actual number of galaxies brighter than within ; (11) resulting volume density of galaxies.
5.2 Comparison with Large Scale Structure
We saw in §4 that by collating together all the available information on galaxy redshifts in the fields of our selected QSOs, we found evidence that Ly absorption is found preferentially at peaks in the galaxy redshift distribution, even though it is also possible to associate each absorption line with a given galaxy.
We described at the beginning of §4 how we selected galaxies within 2 Mpc of a QSO/AGN sightline to search for any peaks in the redshift distribution at the same redshift as the selected galaxies. We took all galaxies with known redshifts in the RC3 within 691 arcmins of the sightline (corresponding to 2 Mpc at a redshift of 1000 km s-1). This list was supplemented with any other galaxies from the NED. Since the RC3 is relatively complete in magnitude however, it should be possible to be more quantitative about the density of galaxies along the QSO line of sight. In principle, if we know the redshifts of all galaxies within a specified radius, measured to some limiting galaxy magnitude, we should be able to calculate directly the volume density of galaxies at the same redshift as the probed galaxy.
We first consider the possible errors in the RC3 magnitudes. de Vaucouleurs et al. (1991) discuss in some detail the likely errors in the observed magnitudes, considering that the measurements are made from many different sources. In the end, they conclude that the mean error is in the range mags. Obviously, we would like to use magnitudes drawn from a heterogeneous data set, but until all-sky surveys such as the Sloan Digital Sky Survey (SDSS) are complete, we do not have such data. If de Vaucouleurs et al. (1991)’s estimate of the magnitudes are correct, however, then their values are probably sufficiently accurate for the purposes of this analysis.
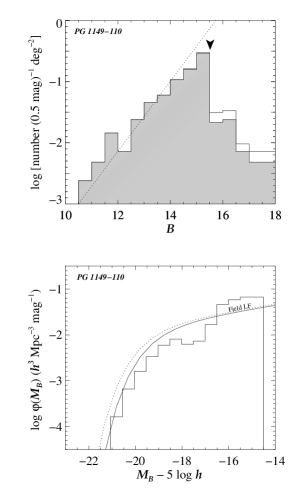
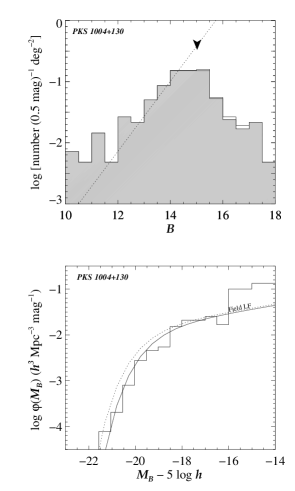
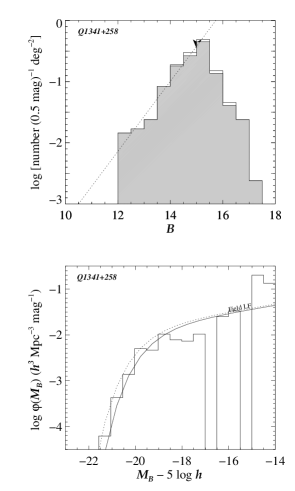
Our initial objective is to determine how complete we might be to a given magnitude limit if we are to use the RC3 as a magnitude limited sample. We construct the observed -band distribution of galaxies for all galaxies within 691 arcmin ( Mpc for km s-1) of each QSO line of sight. For each field, less than 2% of galaxies in the RC3 do not have a measured magnitude. We have used total -band magnitudes () when available, otherwise we have used photographic -band magnitudes (). We then produce a histogram of the number of galaxies in a 0.5 magnitude interval per unit area. These are shown in the top panels of Figure 18. Also plotted are the galaxy number counts taken from the SDSS Commissioning data (Yasuda et al. 2001). As we found previously, the field around Q1831+731 does not appear to have a high density of galaxies with known redshifts. Examination of the -band distribution suggests that this is because there is a genuine under-density of galaxies in the field. Conversely, we know that the sightline around MCG+1016111 shows the highest density of galaxies of all the fields presented here, and that too is reflected in the magnitude distribution, with an excess of bright galaxies over the average found in the SDSS data. The magnitude distribution towards all the other fields agree with the result from the SDSS quite well.
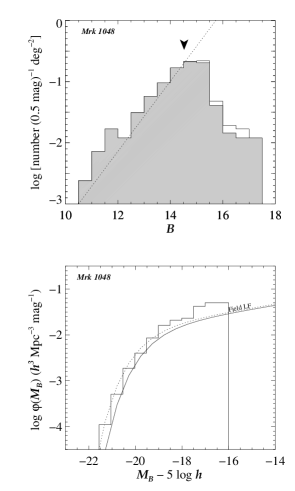
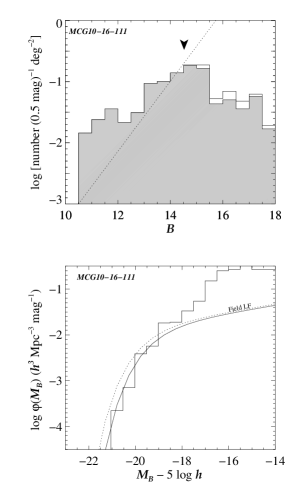
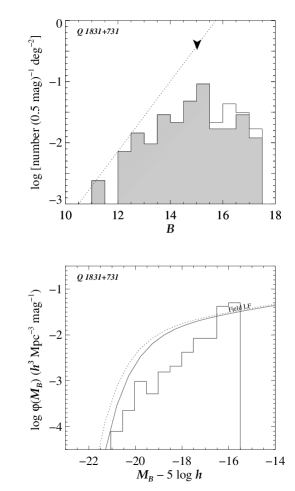
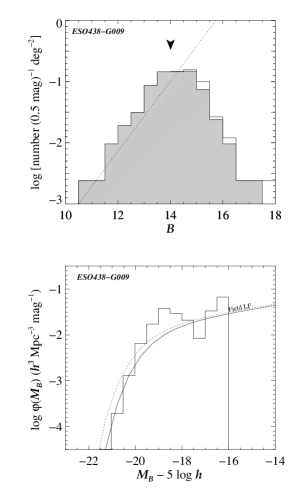
These magnitude distributions give us some confidence that we are complete to some magnitude limit, . We take that limit to be the magnitude at which the number counts begin to turn over, or, more precisely, the magnitude at the edge of the last bin where an increase in magnitude is seen. These adopted limits are shown with arrows in Figure 18 and are summarized in Table 5.
The distribution of -band magnitudes includes galaxies of all redshifts of course. A more precise measurement of the completeness of our galaxy collation is the derivation of the galaxy luminosity function (LF), and its comparison to the field LF. To estimate this, we have taken all the galaxies brighter than the -band limit derived from the magnitude distributions, and derived the classic differential LF
| (2) |
Here, is the volume corresponding to the maximum distance a galaxy with magnitude which is bright enough to be included in the sample could be observed (Schmidt 1968). When used to derive the LF of a sample of galaxies, this estimator is often criticized for being over-sensitive to density fluctuations, giving poor statistics when the objective is to derive the field LF (e.g. Willmer 1997). In our case, however, this is an advantage, since departures from the field LF (assuming our adopted magnitude limit is reasonably accurate) can tell us directly how sparse or dense the galaxy distribution is along a line of sight.
LFs for our fields are shown in the lower panels of Figure 18. Over-plotted is the LF from the 2dF galaxy redshift survey derived by Norberg et al. (2001b), which has the form of a Schechter LF with , and . These values are derived in the -band, but can be converted to magnitudes using the relation (Blair & Gilmore 1982). Since we have no colors for galaxies selected from the RC3, we simply convert the 2dF value to a -band value by adding and considering two cases, and . When galaxies are counted in this way, Figure 18 shows some interesting results. For Q1831+731, there appears to be a genuine deficiency of galaxies for most magnitudes compared to the field. (Note that this conclusion still rests on whether the field has truly been sampled to the adopted magnitude limit.) For MCG+10 the bright end of the LF closely follows the field LF for bright galaxies until when it rises sharply, suggesting a preponderance of fainter galaxies, as is seen in many clusters (e.g. Yagi et al. 2002). The rest of our fields, however, match well the field LF.
Our ultimate aim of course is to measure the density of galaxies around a Ly system, to see if this correlates with Ly equivalent width or H I column density. To derive , the space density of galaxies brighter than an absolute magnitude limit, , we simply calculate, for each field,
| (3) |
i.e. we count the number of sample galaxies within a projected separation of , which we take to be 2 Mpc (the separation at which we are complete for km s-1), and divide by a volume defined by a cylinder of radius stretching in length between a distance of km s-1 and km s-1 from the Ly complex. ( is the distance of a galaxy at a redshift from us). The volume defined in this way has a length along the line of sight which is greater than the transverse distance (). We would like the length along the line of sight to be of order of the Ly system’s redshift, in order to be sure of sampling just the region of space close to a galaxy. However, with the peculiar velocity of a galaxy likely to be a significant fraction of its systemic velocity, we cannot take as a precise measure of a galaxy’s distance from us. Distortions in redshift space due to the peculiar velocities of galaxies in clusters are well known, and we must allow for that distortion in counting galaxies along the line of sight. We adopt a dispersion of km s-1 since this is about the maximum observed for groups and poor clusters. It also the same velocity range (and hence volume) that we adopted in §5.1 over which we effectively summed equivalent widths and column densities of individual Ly components, resulting in our estimates of and . We obtain very similar results if we take a dispersion of only km s-1, however. The ranges used are shown in Table 5, and include exactly the same components used to compare total equivalent widths with impact parameters in §5.1.
is calculated from at a velocity 500 km s-1 greater than the Ly absorption system. The resulting values are given in Table 5. Fortuitously, the range in is small, and we can change to be a fixed value so that we are counting galaxies all brighter than a single value in each field. Table 5 shows that using is convenient, hence we calculate for galaxies brighter than this. Note that since this limit is not particularly faint, we sometime exclude in the census the galaxies we originally selected to probe.
The top panel of Figure 19 shows the derived galaxy density plotted against the integrated equivalent width, . The errors in are simply those from counting statistics, . The figures shows that is correlated with . The bottom panel of Figure 19 shows that the same correlation holds true if the integrated column density, , is also plotted against galaxy density. Hence, the higher the density of galaxies in a given volume, the stronger the equivalent width of Ly absorption and H I column density measured over 1000 km s-1.

In the above analysis, we were interested in Ly complexes which arose at the same velocities as galaxies close to the line of sight. What about the remaining Ly lines in the STIS spectra? If we are suggesting that the determining factor of the strength of a Ly complex is galaxy density, we should at least explore whether the same relationship holds for Ly lines not selected because of the proximity of a galaxy to the line of sight.
We first impose the selection that all Ly lines must have redshifts km s-1, as we adopted above. The additional Ly lines are then: components towards PKS 1004+130, towards MCG 1016111, component 1 towards PG 1149-110, and the single line we found towards PG 1341+258. Again, we need to sum these components over a 1000 km s-1 range to replicate the procedures we adopted above. Choosing components to include is fairly straightforward, and we sum equivalent widths and column densities of components towards PKS 1004+130 and towards MCG 1016111. We then repeat the calculation of identifying galaxies within the volume defined above. Table 5 shows that we do not reach the towards MCG 1016111 given for that field, and hence may be only a lower limit. Conversely, we go too deep for the lower redshift Ly lines towards the other three sightlines. In order to compare our results with the densities shown in Figure 19, we impose the limit of when counting galaxies. The results are shown in Figure 20 where triangles represent the four additional Ly line complexes, each labelled to show which components were included. We also include the data from Figure 19 as squares, but without labels, in order to avoid over-crowding in the diagrams. From Figure 20 it can be seen that the additional absorption complexes follow the correlation we have found, within the uncertainties.

We conclude that there is suggestive evidence in favour of the density of Ly components along a sightline being related to the volume density of galaxies brighter than within a few Mpc of a sightline. Clearly, there are sufficient data in the HST Archive to test this conclusion further using very low redshift Ly lines detected in FOS, GHRS, and STIS data. We defer such a test for a later paper. We stress again that these conclusions rest on the assumption that the RC3 is capable of providing a magnitude limited sample along a sightline to the limits given in Table 5. We note though that a visual inspection of the field tends to support our analysis of the catalog. That is, it is easy to see that certain fields contain more bright galaxies than others. We do note, however, that the correlations in Figs 19 and 20 are quite sensitive to the numbers of galaxies counted, simply because the actual numbers are small. A more detailed analysis, which might involve counting galaxies to fainter magnitude limits, or simply selecting more sightlines, will test our conclusions more rigorously.
6 Conclusions and Summary
By selecting background QSOs whose sightlines pass close to low redshift galaxies in the local universe, we have detected Ly absorption lines within a few hundred km s-1 of the systemic velocity of a galaxy in all cases. We conclude that a line of sight which passes within an impact parameter of kpc of a galaxy is likely to intercept low column density neutral hydrogen with (H I). The ubiquity of detections implies a covering factor of % around galaxies selected in this way. We find that Ly absorption lines are actually composed of individual components spread out in velocity over a range sometimes as large as 800900 km s-1.
Along the sightlines towards two probes, the high resolution and high S/N of our STIS data reveal components which are unusually broad for low-redshift Ly lines, with Doppler parameters km s-1. If these widths reflect the kinetic temperature of the absorbing gas, then the gas must be at temperatures of K.
In general, there are two possible explanations for the Ly absorption we see. The first is that absorbing gas may be directly associated with the galaxies we chose to probe. Deposition of gas far from stellar populations of a galaxy may be due to internal interstellar processes within galaxies (e.g. superwinds from episodes of intense star formation, or gas cycling between the disk and halo in a galactic fountain) or perhaps from more external, dynamical processes, such as galaxy-galaxy interactions, or galaxy-dwarf accretion. The second explanation is that some or all of the absorbing components are not physically located around the probed galaxy at all. Instead, the absorbing gas simply traces the same large-scale gravitational structures that the galaxies inhabit.
The amount of data presented in this paper is insufficient to distinguish categorically between these two scenarios. However, several of our results appear to indicate that the second of these interpretations is at least as plausible as the first.
Although it seems relatively straightforward to match an individual absorption line with a given galaxy, we have discussed in §5 how such a one-to-one assignment is made uncertain by the multi-component structure of many of the Ly lines detected. Furthermore, galaxies are often found in loose groups and clusters. Although we targeted galaxies which appeared isolated, we subsequently discovered that there is usually more than one galaxy within our imposed impact parameter of 200 kpc from the QSO sightline. By degrading our STIS data to the resolution of the FOS, the multicomponent nature of our absorption systems is largely removed. By matching these degraded lines (effectively summing individual component equivalent widths and column densities over 1000 km s-1 to produce an equivalent width and column density ) to the galaxy closest to the sightline, and ignoring any companions, we are able to reproduce the anti-correlation of Ly equivalent width and impact parameter found at higher redshift. This suggests that the population of absorbing galaxies studied at high- is no different than the nearby galaxies we selected to probe.
We find that our anti-correlation is weakened by correcting for galaxy luminosity in the manner prescribed for the higher redshift systems, , yet appears to improve for . Such an relationship is surprising. It is possible to envisage a scenario whereby brighter galaxies have used up all the available neutral hydrogen in their immediate vicinity, resulting in brighter galaxies being associated with weaker Ly lines at a particular radius. Nevertheless, such a behaviour is significantly at odds with the results at higher redshift, and would imply that our population of absorbing galaxies had little to do with those found at higher-. It also seems largely incompatible with the result discussed below and §5.2, that correlates with the volume density of moderately bright galaxies. We note that the improved correlation becomes significant largely due to the correction for a single galaxy, UGCA 226 in the field of ESO 438-G009 (compare the top and bottom panels of Figure 17). Also, the rank correlation tests suggest the correlation is only marginally significant, at somewhere between the 2.2 (Spearman) and 2.8 (Kendall) level. We suspect therefore that the improvement in the correlation after correcting for galaxy luminosity is coincidental, a result of small number statistics, but we cannot rule out the relationship is real. Obvioulsy, further data are required to explore this issue in more detail.
Collating all available galaxy redshifts along each line of sight has shown that many of our selected galaxies are actually members of moderately rich groups, and we could equally well conclude that low redshift Ly lines are associated with groups of galaxies. We have investigated this alternative interpretation quantitatively, by defining a simple measure of the volume density of galaxies, , evaluated at the same distance as a given galaxy/Ly-complex. Assuming that the RC3 provides a magnitude limited sample (to the depths determined in Table 5), a correlation appears to exist between and both the total Ly equivalent width and H I column density of an absorption complex (Figures 19 and 20). This is highly suggestive evidence for an association of the Ly absorption lines with larger-scale structures rather than with individual galaxies, as predicted by hydrodynamical simulations of the growth of structure in currently favoured cosmologies. The evidence is strengthened by the fact that the same correlation seems to apply irrespective of whether there is a bright galaxy within 200 kpc of a sightline.
This second scenario has a parallel at high redshift, where Adelberger et al. (2002) also see a strong correlation between the optical depth in the Ly forest and the overdensity of galaxies. From their observations, they find that the forest is actually cleared out in the immediate vicinity of galaxies (at impact parameters of 100–200 kpc) which appears to be different from the galaxies studied in our sample (presumably from outflows generated by active star-forming galaxies at that epoch). However, on the same scales that we have been considering, 1–2 Mpc, there is an excess of Ly absorption closely related to the density of galaxies in the high redshift sample. The parallel is intriguing because the high- and low- Ly forest have been considered to be different populations, given their markedly different redshift evolutions (e.g. Weymann et al. 1998). Possibly, the two populations are closely related, as has been suggested by results from the hydrodynamical simulations of Davé et al. (1999).
Can our conclusions be reconciled with other results from studies of Ly lines? One corollary would be that the strongest lines seen in FOS spectra should be associated with the highest density regions of galaxies, in rich groups or clusters. (Of course, at sufficiently small impact parameters we would expect the outer regions of individual galaxy disks to be intercepted directly.) It should be possible to test this prediction by completing the redshift surveys which have been underway for several years, obtaining redshifts of all galaxies within a reasonably large radius (e.g. 2 Mpc arcmin at ) down to a specified magnitude limit. Unfortunately, the amount of telescope time required to fully sample a field may be hard to come-by. A field would need to be sampled to a depth where the galaxy luminosity function was adequately sampled at the absorber redshift. For example, if the field luminosity function used in §5.2 is valid at higher redshift, there would be only half a dozen or so galaxies in the cylindrical volume we used to measure galaxy volume density. Unfortunately, an galaxy would have an observed magnitude of at , meaning that several hundred galaxies with magnitudes brighter than this limit (which would include foreground and background galaxies) would have to be surveyed to properly sample the field at the required redshift.
The anti-correlation of equivalent width and impact parameter found at higher redshift might also be understood in terms of galaxy density: stronger lines would arise in regions of higher galaxy density, where the probability of finding a galaxy close to the sightline would be high because of the increase in the number of galaxies per unit area. It is likely that this effect has already been seen in the simulations of, e.g., Davé et al. (1999). If galaxy density principally governs Ly equivalent width, then why should Ly equivalent width correlate with the luminosity of the galaxy closest to the QSO line of sight (Figure 2 of Chen et al. 2001)? One possibility is that galaxies in high density regions (giving rise to strong Ly lines) may be brighter than those in low density regions (which produce only weak Ly lines). So QSO sightlines which intercept richer groups of galaxies are more likely to find brighter galaxies, which are themselves likely to be closer to a sightline due to the higher surface density of galaxies. The exact shape of the luminosity function in groups and clusters, and its variation between environments of different densities, is still unclear, but there is evidence for an increase in the luminosity of galaxies in denser environments (e.g. Garilli et al. 1999; Yagi et al. 2002; Norberg et al. 2001a).
Whether these effects are significant enough to recreate the correlations seem for the high redshift galaxy sample remains uncertain. Only more comprehensive redshift surveys around high- QSO fields, and more detailed studies of the absorbing population of galaxies in the nearby universe, might eventually help us to understand whether galaxy density and environment really are important factors in governing the existence and conditions of Ly clouds.
References
- Adelberger et al. (2002) Adelberger, K. L., Steidel, C. C., Shapley, A. E., & Pettini, M. 2002, ApJ, submitted
- Bahcall et al. (1991) Bahcall, J. N., Jannuzi, B. T., Schneider, D. P., Hartig, G. F., Bohlin, R., & Junkkarinen, V. 1991, ApJ, 377, L5
- Bahcall et al. (1993) Bahcall et al. 1993, ApJS, 87, 1
- Bergeron (1986) Bergeron, J. 1986, A&A, 155, L8
- Bergeron & Boisse (1991) Bergeron, J. & Boisse, P. 1991, A&A, 243, 344
- Blair & Gilmore (1982) Blair, M. & Gilmore, G. 1982, PASP, 94, 742
- Bottema & Gerritsen (1997) Bottema, R. & Gerritsen, J. P. E. 1997, MNRAS, 290, 585
- Bowen et al. (1995) Bowen, D. V., Blades, J. C., & Pettini, M. 1995, ApJ, 448, 634
- Bowen et al. (1996) —. 1996, ApJ, 464, 141
- Bryan et al. (1999) Bryan, G. L., Machacek, M., Anninos, P., & Norman, M. L. 1999, ApJ, 517, 13
- Cen et al. (1994) Cen, R., Miralda-Escude, J., Ostriker, J. P., & Rauch, M. 1994, ApJ, 437, L9
- Chen et al. (2001) Chen, H., Lanzetta, K. M., Webb, J. K., & Barcons, X. 2001, ApJ, 559, 654
- Chen et al. (1998) Chen, H. W., Lanzetta, K. M., Webb, J. K., & Barcons, X. 1998, ApJ, 498, 77 (CLWB)
- Cristiani (1987) Cristiani, S. 1987, A&A, 175, L1
- Davé et al. (1999) Davé, R., Hernquist, L., Katz, N., & Weinberg, D. H. 1999, ApJ, 511, 521
- Davé & Tripp (2001) Davé, R. & Tripp, T. M. 2001, ApJ, 553, 528
- de Vaucouleurs et al. (1991) de Vaucouleurs, G., de Vaucouleurs, A., Corwin, J. R., Buta, R. J., Paturel, G., & Fouque, P. 1991, in Third reference catalogue of Bright galaxies, New York : Springer-Verlag. (RC3)
- Eskridge & Pogge (1991) Eskridge, P. B. & Pogge, R. W. 1991, AJ, 101, 2056
- Falco et al. (1999) Falco, E. E., Kurtz, M. J., Geller, M. J., Huchra, J. P., Peters, J., Berlind, P., Mink, D. J., Tokarz, S. P., & Elwell, B. 1999, PASP, 111, 438
- Garilli et al. (1999) Garilli, B., Maccagni, D., & Andreon, S. 1999, A&A, 342, 408
- Grogin & Geller (2000) Grogin, N. A. & Geller, M. J. 2000, AJ, 119, 32
- Hartmann & Burton (1997) Hartmann, D. & Burton, W. B. 1997, Atlas of galactic neutral hydrogen (Cambridge; New York: Cambridge University Press, ISBN 0521471117)
- Heckman et al. (2000) Heckman, T. M., Lehnert, M. D., Strickland, D. K., & Armus, L. 2000, ApJS, 129, 493
- Hernquist et al. (1996) Hernquist, L., Katz, N., Weinberg, D. H., & Jordi, M. 1996, ApJ, 457, L51
- Karachentsev & Sharina (1997) Karachentsev, I. D. & Sharina, M. E. 1997, A&A, 324, 457
- Keyes (1997) Keyes, C. D. 1997, in The 1997 HST Calibration Workshop with a new generation of instruments, eds. S. Casertano, R. Jedrzejewski, C. D. Keyes, and M. Stevens. Baltimore, MD : Space Telescope Science Institute, 420
- Lanzetta et al. (1995) Lanzetta, K. M., Bowen, D. V., Tytler, D., & Webb, J. K. 1995, ApJ, 442, 538 (LBTW)
- Le Brun et al. (1996) Le Brun, V., Bergeron, J., & Boisse, P. 1996, A&A, 306, 691
- Miralda-Escude et al. (1996) Miralda-Escude, J., Cen, R., Ostriker, J. P., & Rauch, M. 1996, ApJ, 471, 582
- Monk et al. (1986) Monk, A. S., Penston, M. V., Pettini, M., & Blades, J. C. 1986, MNRAS, 222, 787
- Moody & Kirshner (1988) Moody, J. W. & Kirshner, R. P. 1988, AJ, 95, 1629
- Morris et al. (1993) Morris, S. L., Weymann, R. J., Dressler, A., McCarthy, P. J., Smith, B. A., Terrile, R. J., Giovanelli, R., & Irwin, M. 1993, ApJ, 419, 524
- Morris et al. (1991) Morris, S. L., Weymann, R. J., Savage, B. D., & Gilliland, R. L. 1991, ApJ, 377, L21
- Norberg et al. (2001a) Norberg et al. 2001a, MNRAS, 328, 64
- Norberg et al. (2001b) —. 2001b, astro-ph, 0111011
- Ortiz-Gil et al. (1999) Ortiz-Gil, A., Lanzetta, K. M., Webb, J. K., Barcons, X., & Fernández-Soto, A. 1999, ApJ, 523, 72
- Penton et al. (2000) Penton, S. V., Shull, J. M., & Stocke, J. T. 2000, ApJ, 544, 150
- Pildis et al. (1997) Pildis, R. A., Schombert, J. M., & Eder, J. 1997, ApJ, 481, 157
- Salpeter & Hoffman (1995) Salpeter, E. E. & Hoffman, G. L. 1995, ApJ, 441, 51
- Salzer (1992) Salzer, J. J. 1992, AJ, 103, 385
- Sargent et al. (1980) Sargent, W. L. W., Young, P. J., Boksenberg, A., & Tytler, D. 1980, ApJS, 42, 41
- Schmidt (1968) Schmidt, M. 1968, ApJ, 151, 393
- Schneider et al. (1983) Schneider, S. E., Helou, G., Salpeter, E. E., & Terzian, Y. 1983, ApJ, 273, L1
- Steidel (1995) Steidel, C. C. 1995, in QSO Absorption Lines, Proceedings of the ESO Workshop Held at Garching, Germany, 21 - 24 November 1994, ed. G. Meylan. Springer-Verlag Berlin Heidelberg, New York, 139
- Steidel et al. (1994) Steidel, C. C., Dickinson, M., & Persson, S. E. 1994, ApJ, 437, L75
- Stocke et al. (1995) Stocke, J. T., Shull, J. M., Penton, S., Donahue, M., & Carilli, C. 1995, ApJ, 451, 24
- Tanvir et al. (1999) Tanvir, N. R., Ferguson, H. C., & Shanks, T. 1999, MNRAS, 310, 175
- Theuns et al. (1998) Theuns, T., Leonard, A., & Efstathiou, G. 1998, MNRAS, 297, L49
- Tripp et al. (1998) Tripp, T. M., Lu, L., & Savage, B. D. 1998, ApJ, 508, 200
- Tully et al. (1996) Tully, R. B., Verheijen, M. A. W., Pierce, M. J., Huang, J., & Wainscoat, R. J. 1996, AJ, 112, 2471
- van Gorkom et al. (1986) van Gorkom, J. H., Knapp, G. R., Raimond, E., Faber, S. M., & Gallagher, J. S. 1986, AJ, 91, 791
- Veron-Cetty & Veron (1996) Veron-Cetty, M. & Veron, P. 1996, A Catalogue of quasars and active nuclei (ESO Scientific Report, Garching: European Southern Observatory (ESO), 7th ed.)
- Weymann et al. (1998) Weymann et al. 1998, ApJ, 506, 1
- Willmer (1997) Willmer, C. N. A. 1997, AJ, 114, 898
- Wills et al. (1999) Wills, B. J., Brandt, W. N., & Laor, A. 1999, ApJ, 520, L91
- Yagi et al. (2002) Yagi, M., Kashikawa, N., Sekiguchi, M., Doi, M., Yasuda, N., Shimasaku, K., & Okamura, S. 2002, AJ, 123, 87
- Yasuda et al. (2001) Yasuda et al. 2001, AJ, 122, 1104
- Zhang et al. (1995) Zhang, Y., Anninos, P., & Norman, M. L. 1995, ApJ, 453, L57