X-ray Detection of the Inner Jet in the Radio Galaxy M84
Abstract
During the course of an investigation of the interaction of the radio galaxy M84 and its ambient cluster gas, we found excess X-ray emission aligned with the northern radio jet. The emission extends from the X-ray core of the host galaxy as a weak bridge and then brightens to a local peak coincident with the first detectable radio knot at from the core. The second radio knot at 3.3′′ is brighter in both radio and X-rays. The X-ray jet terminates 3.9′′ from the core. Although all the evidence suggests that Doppler favoritism augments the emission of the northern jet, it is unlikely that the excess X-ray emission is produced by inverse Compton emission. We find many similarities between the M84 X-ray jet and recent jet detections from Chandra data of low luminosity radio galaxies. For most of these current detections synchrotron emission is the favored explanation for the observed X-rays.
1 Introduction
The radio galaxy M84 is a low luminosity (FRI type) radio galaxy in the Virgo cluster. We obtained Chandra observations in order to study the interaction of the radio structures with the hot intra cluster medium (ICM) and that work was reported in Finoguenov & Jones (2001). In this paper we report on X-ray emission detected from the inner 300 pc of the northern radio jet.
X-ray emission from radio jets presents us with the problem of identifying the emission process but once this process is determined, we can then obtain new constraints on physical parameters (Harris and Krawczynski, 2002). With the introduction of the relativistic beaming model of Celotti (Celotti, Ghisellini, & Chiaberge, 2001) and Tavecchio (Tavecchio, et al. 2000), most X-ray emission from jets has been interpreted as indicating either synchrotron emission or inverse Compton scattering off the cosmic microwave background (CMB). For M84, we show that synchrotron emission is the probable process, as has been found for a number of other FRI radio galaxies (Worrall, Birkinshaw, & Hardcastle, 2001; Hardcastle, Birkinshaw, & Worrall 2001). The implications of the detected X-ray emission are discussed in sec. 5.
We take the distance to the Virgo cluster to be 17 Mpc so that one arcsec corresponds to 82 pc. We follow the usual convention for flux density, S.
2 X-ray data
The X-ray data were obtained with the ACIS-S detector on the Chandra Observatory (obsid 803, 2000May19). The exposure time was 30 ksec and after filtering for high background a livetime of 28.7 ksec was realized. The central X-ray point source is coincident with the position of the radio nucleus. Its spectrum is well described as an absorbed ( cm-2) power law () with a corresponding luminosity of ergs s-1 in the 0.5–10 keV band. Further details of the data and basic processing can be found in Finoguenov & Jones (2001).
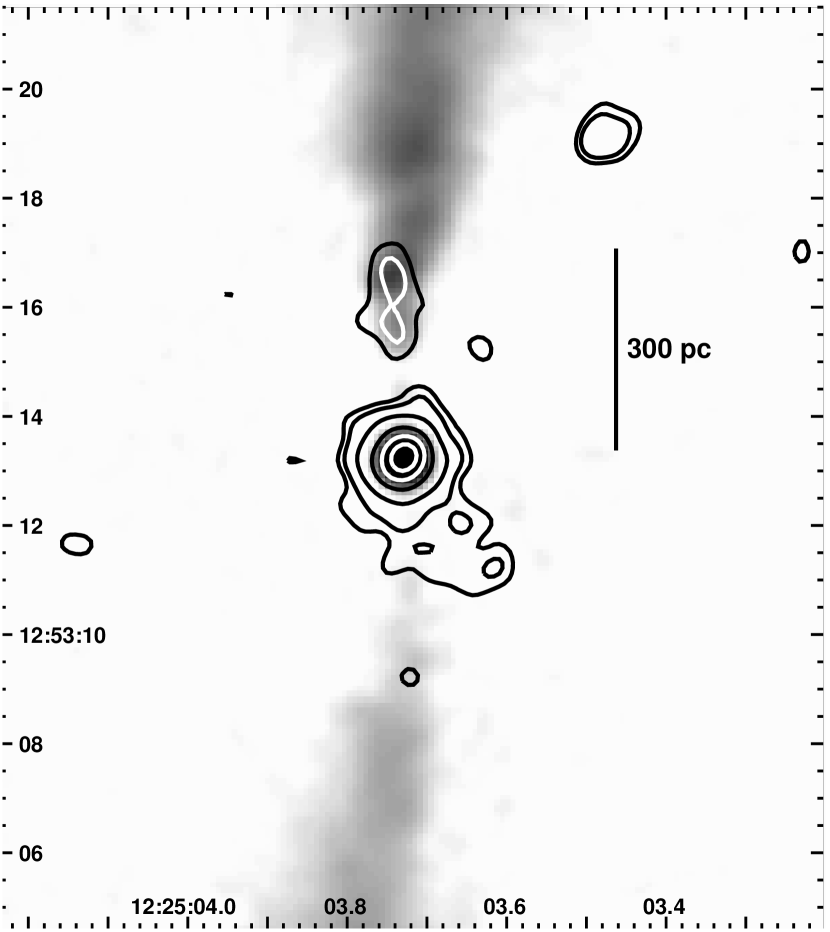
For image display purposes, we limited the energy range to 0.3-2keV and binned the data by a factor of 1/5 to obtain images with pixel size 0.098′′. Various Gaussian smoothing functions were then convolved with the data and one example is shown in figure 1; a radio image with X-ray contours overlayed. The coincidence of radio and X-ray emissions for knots N2.5 and N3.3 is evident (we name these features according to their angular distance from the core, in arcsec). The emission to the SW of the core at about the same brightness level as the northern jet does not correspond to any radio emission and is part of the complex thermal emission described by Finoguenov & Jones (2001). The data presented there revealed an H-shape of the diffuse component, anticorrelated with radio emission. Furthermore, the asymmetry in the X-ray emission, as well as in the radio, is attributed to hydrodynamic effects caused by motion of M84 towards the North-West through the hot gas of the Virgo cluster. As is clearly seen from their large-scale map, the western component of the X-ray emission is more compressed than the Eastern one and in addition is bent towards the south. The SW enhancement in the X-ray emission, seen in our fig. 1, is attributed to the stronger interaction between the ambient hot plasma and the southern radio lobe on the side of maximal compression of the X-ray emitting plasma.
For an estimate of the spectral parameters, a thermal (MEKAL) spectrum was fit to a large region near the north jet. Then with the counts extracted from a circle of radius 2.5′′ which included both N2.5 and N3.3, a two component model was fit with the temperature and metalicity of the thermal component fixed to that found for the adjacent hot gas (0.55 keV), but with the amplitudes of both the power law and the thermal components left as free parameters (as was the power law index). NH is always fixed to the Galactic value.
A single component fit to the jet spectrum, allowing only the normalization to vary gives an unacceptable : 51.3 for 16 degrees of freedom. The introduction of an additional component, such as the power-law, reduces the to an acceptable level of 13.5 per 14 degrees of freedom and the additional component is statistically significant at the 3.9 level (or 99.992%). If the second component is modeled with a thermal spectrum instead of a power law and only the temperature and normalization are allowed to vary, the fit is equally acceptable (13.9/14) and has a temperature of 3.21.1 keV and normalization of (8.73.3) in XSPEC units.
The results for the thermal background/power-law-jet are shown in fig. 2. From this fit, we find that the power law component has a flux, f(0.3-7keV) = 1.5 erg cm-2 s-1 and . This flux corresponds to 42 net counts in our data. Dividing the observed flux according to the ratio of the counts in two small circles centered on the two knots provides the intensity values reported in table 1.
| Parameter | N2.5 | N3.3 | units |
|---|---|---|---|
| net countsaaThe X-ray intensity of the knots comes from the spectral modeling, but the listed counts come from small circles: r=0.35′′ for N2.5 and r=0.5′′ for N3.3. This was done because the two knots are not well separated, being only 0.8′′ apart. Obviously the net counts in these small circles do not represent the total counts attributable to the knots, but their sum is close to the 42 counts contributing to the power law component of the spectral fit within a circle of radius 2.5′′. Listed uncertainties are the square root of the total counts within the measuring aperture, but they should be augmented by a few counts because of the uncertainty in the appropriate background level to use at the location of the knots. | 155 | 286 | counts |
| fx(0.3-7keV)bbThe X-ray flux has been corrected for galactic absorption and a power law with =0.8 was used for both components. | 0.530.18 | 0.960.20 | 10-14 erg s-1 cm-2 |
| Lx(0.3-7keV) | 1.80.6 | 3.30.7 | 1038 erg s-1 |
| S(1keV) | 0.630.21 | 1.150.25 | nJy |
| S(5GHz)ccThe radio flux densities were measured with a variety of AIPS tools. | 3.50.6 | 133 | mJy |
3 Radio data
The VLA data are a combination of observations made in three VLA configurations at 4.9 GHz: in the A configuration on 1980 November 9, in the B configuration on 1981 June 25, and in the C configuration on 1981 November 17. They were reduced in the AIPS software package using standard self-calibration and imaging methods. The asymmetry in brightness between the northern and southern jets supports the notion that the northern jet is the one coming towards us and that Doppler favoritism is operating out to (1.2 kpc).
We do not have radio data of sufficient spatial resolution at lower frequencies to determine accurate spectral indices, but the lower resolution data indicate values 0.65.
4 Parameters for Emission Models
To estimate physical parameters associated with various X-ray emission mechanisms, we need to assign volumes for the knots. For each knot we choose a cylindrical volume with length of 0.8′′ and radii of 0.15′′ (N2.5) and 0.21′′ (N3.3).
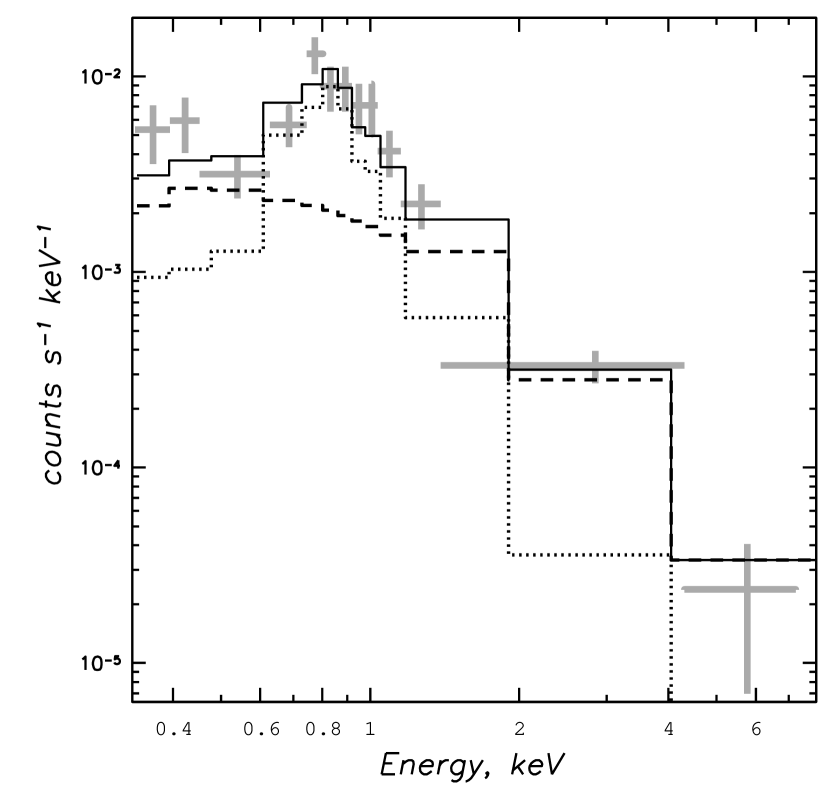
The overall spectrum for N3.3 is shown in figure 3.

4.1 Thermal Bremsstrahlung Emission
In many instances (e.g. Harris, Carilli, & Perley, 1994) it has been argued that if X-ray emission from radio features were to be from hot gas rather than a non-thermal mechanism, then the required electron densities together with the (equipartition) magnetic field strengths would predict departures from the relation of radio polarization position angle, as well as excess depolarization. Since these effects have not been found, it appears that whatever thermal gas is present in radio emitting volumes must have a density much lower than that needed to produce the observed X-ray emission. However, there could be excess hot gas around the jet since we do not have sufficient resolution or s/n to determine the precise distribution of the emission and we do not have Faraday rotation estimates on the arcsec scales under discussion here.
The X-ray luminosity for each knot is of order 1038 erg s-1 (table 1) and the density required to produce this emission from the cylindrical volumes would be 5 cm-3. The masses of the emitting cylinders would be 4 and 7 (N2.5 and N3.3, respectively). Assuming a temperature of 1 keV means that the pressure would be 1.6dyne cm-2. Although this pressure is significantly larger than that expected from the ambient hot gas (3.7dyne cm-2, Finoguenov & Jones, 2001) , since these emitting volumes are well inside the galaxy, there could be additional pressure contributed by cooler gas which does not produce X-rays.
The X-ray spectral analysis (section 2) demonstrates clear evidence for either a non-thermal or a 3 keV component not seen in nearby regions. In figure 2, note the excess both below 0.5 keV and above 2 keV. We favor the non-thermal alternative because even adiabatic compression of the X-ray emitting gas to the required densities ( 1 cm-3) should result in temperature of 15 keV, much higher than what is observed.
4.2 Synchrotron Emission
Even though we do not know the details of the spectrum, we may estimate the synchrotron parameters necessary to produce the observed X-rays with a spectrum such as that shown in fig. 3. For the radio emission from N3.3 (107 to 1011 Hz), the log of the luminosity would be 38.24 erg s-1 and the equipartition field would be 111 G. For a synchrotron X-ray model, we need to extend the spectrum up to 1018 Hz with the spectral index =0.9. In this case the log of the luminosity would be 39.14 erg s-1 and the equipartition field would be 143 G. If the synchrotron emission from N2.5 and N3.3 is mildly beamed (as we argue below) both these luminosity and magnetic field strength estimates should be reduced somewhat.
Although the change required by the extension of the synchrotron spectrum in the total energy contained in the source is not large, the power law distribution of electron energy would have to extend to with a halflife of 10 years for electrons of this energy. If (radio)=0.65, then the spectrum would most likely be a broken power law, but this will not make much difference to the rough estimates calculated here.
4.3 Inverse Compton Emission
The synchrotron self-Compton model fails because the photon energy density is so low that the predicted 1 keV flux density would be 4 orders of magnitude below that observed (assuming an equipartition field of 93 and 111 G for N2.5 and N3.3, respectively).
IC scattering off the CMB photons would require a magnetic field strength of 0.1 G, more than a factor of 1000 below the equipartition field.
If we invoke relativistic beaming to produce the observed X-ray jet (so that the CMB energy density would be increased by in the jet frame; where is the Lorentz factor of the relativistic jet), an angle between the jet velocity vector and the line of sight would have to be 3∘ or less and the beaming factor and would be 20. These values, derived from the equations in the appendix of Harris & Krawczynski (2002), are inconsistent with estimates from the radio data. From the observed ratio of intensities of the inner radio jets (i.e. 16 at 3′′ from the core), the angle between the line of sight and the N jet has to be less than 70∘ and is most likely greater than 45∘ since we see the two sides of the jet and lobes well separated. This range in angles corresponds to beaming factors in the range 0.6 to 1.25 and jet fluid velocities, ), in the range 1 to 0.6.
5 Discussion
We believe the evidence favors synchrotron emission for the observed X-rays although to sustain this model, higher s/n X-ray data and optical detections are required. Undoubtedly there are bulk relativistic velocities in the jet producing the observed intensity differences between the N and S jets, but with velocity vectors not too far from the plane of the sky, we see only mild boosting and the parameters for IC/CMB emission are completely at odds with all other evidence. To check the ’mild beaming’ synchrotron model, we note that the ratio of the net counts in the N jet (r=1.05′′ aperture) to that found in the same sized circle at the same distance to the south is 4.1 (where we used the 2 upper limit for the south value). Thus the X-ray ratio (North/South) is consistent with the radio value (16) measured at the same distance from the core (3′′).
Even in fields of order 100 G, the half-life for electrons producing X-rays is so short that they could travel no more than 3pc from their acceleration region. Thus the X-rays clearly demarcate that sort of acceleration region.
The M84 jet is considerably weaker than other FRI detections. The X-ray luminosity is 6 times less than that of Cen A, the jet with the lowest luminosity listed in a table of 7 FRI jets in Harris, Krawczynski, & Taylor (2002). The combined flux densities of N2.5 and N3.3 are a factor of 84 less than that from knots HST-1 and D in the M87 jet (Marshall et al. 2002); these two knots are within 3′′ of the nucleus of M87 although their physical distance from the core may be larger than that for the M84 knots owing to a larger projection effect. Although some of the disparity in X-ray luminosity between M84 and the other FRI jets may be caused by differences in beaming factors, most of the current sample are believed to have rather large angles between the line of sight and the jet axis and thus beaming is generally moderate to low in all of them.
Hardcastle, M.J., Birkinshaw, M., & Worrall, D.M. 2001 MNRAS 326, 1499 3c66B Hardcastle, M.J., Worrall, D.M., Birkinshaw, M., Laing, R.A. & Bridle, A.H. 2002, MNRAS (in press) 3C31 Harris, D. E., Krawczynski, H., and Taylor, G.B. 2002 ApJ (in press) Harris, D. E. and Krawczynski, H. 2002 ApJ 565, 244 Harris, D.E., Carilli, C.L. and Perley, R.A. 1994 Nature 367, 713. Finoguenov, A. & Jones, C. 2001 ApJ 547, L107 Marshall, H.L., Miller, B.P., Davis, D.S., Perlman, E.S., Wise, M., Canizares, C.R., and Harris, D.E. 2002, ApJ 564, 683 Worrall, D.M., Birkinshaw, M., & Hardcastle, M.J. 2001, MNRAS 326, L7