A Study of the Type II-Plateau Supernova 1999gi, and the Distance to its Host Galaxy, NGC 3184
Abstract
We present optical spectra and photometry sampling the first six months after discovery of supernova (SN) 1999gi in NGC 3184. SN 1999gi is shown to be a Type II-plateau event with a photometric plateau lasting until about 100 days after discovery. The reddening values resulting from five independent techniques are all consistent with an upper bound of mag established by comparing the early-time color of SN 1999gi with that of an infinitely hot blackbody, and yield a probable reddening of mag. Using the expanding photosphere method (EPM), we derive a distance to SN 1999gi of Mpc and an explosion date of 1999 December , or days prior to discovery. This distance is consistent with a recent Tully-Fisher distance derived to NGC 3184 ( Mpc), but is somewhat closer than the Cepheid distances derived to two galaxies that have generally been assumed to be members of a small group containing NGC 3184 (NGC 3319, Mpc, and NGC 3198, Mpc).
We reconsider the upper mass limit () recently placed on the progenitor star of SN 1999gi by Smartt et al. (2001, 2002) in light of these results. Following the same procedures, but using the new data presented here, we arrive at a less restrictive upper mass limit of for the progenitor. The increased upper limit results mainly from the larger distance derived through the EPM than was assumed by the Smartt et al. analyses, which relied on less precise (and less recent) distance measurements to NGC 3184.
Finally, we confirm the existence of “complicated” P-Cygni line profiles in early-time and later photospheric-phase spectra of SN 1999gi. These features, first identified by Baron et al. (2000) in spectra of SN 1999em as high-velocity absorptions in addition to the “normal” lower-velocity component, are here verified to be true P-Cygni profiles consisting of both an absorption trough and an emission peak at early times. In the earliest spectrum, taken less than a day after discovery, the features extend out to nearly km s-1, indicating the existence of very high-velocity material in the outer envelope of SN 1999gi.
1 INTRODUCTION
Supernova (SN) 1999gi was discovered by Nakano et al. (1999) on 1999 December 9.82 (UT dates are used throughout this paper) at an unfiltered magnitude of in the nearly face-on (, from the Lyon-Meudon Extragalactic Database [LEDA111http://leda.univ-lyon1.fr]) SBc galaxy NGC 3184. The identification of hydrogen in an early-time spectrum quickly defined it as a Type II event (Nakano et al. 1999; see Filippenko 1997 for a review of SN types), and the absence of the SN on CCD images of the same field taken 6.64 and 7.32 days earlier (Trondal et al. 1999, limiting unfiltered magnitude 18.5, and Nakano et al. 1999, limiting unfiltered magnitude 19.0, respectively) implies that it was discovered shortly after explosion.
There have been two previous investigations of SN 1999gi. In the first, Leonard & Filippenko (2001) examine a single epoch of optical spectropolarimetry of SN 1999gi taken 107 days after discovery. They find an extraordinarily high degree of linear polarization, , where is the highest level of polarization observed in the optical bandpass. If intrinsic to SN 1999gi, such polarization implies an enormous departure from spherical symmetry (Höflich 1991). However, Leonard & Filippenko (2001) conclude that the majority of the polarization is likely due to interstellar dust, and is not intrinsic to the SN. From photometry reported in various IAU Circulars, Leonard & Filippenko (2001) tentatively classify SN 1999gi as a Type II-plateau supernova (SN II-P). In addition, the total flux spectrum of SN 1999gi from day 107 and a comparable spectral epoch of SN 1999em, a classic SN II-P (Leonard et al. 2002 [hereafter L02]; Hamuy et al. 2001), show great spectral similarity, suggesting that they may have been quite similar events.
In the second study, Smartt et al. (2001; hereafter S01) examine pre-explosion archival Hubble Space Telescope (HST) images of NGC 3184 and use the lack of a progenitor-star detection in the pre-discovery frame, along with an estimated distance of Mpc, to set an upper limit on the absolute magnitude of the progenitor for SN 1999gi. This is then translated into an upper mass limit of for the progenitor of SN 1999gi through comparison with stellar evolution models. A subsequent reanalysis of the same data by Smartt et al. (2002; hereafter S02), using improved models, confirms this limit. Since stars with initial mass are not expected to undergo core collapse (e.g., Woosley & Weaver 1986, and references therein), this upper bound sets very tight constraints on the possible mass of the progenitor, a fact that has important implications for the nature of the progenitors of SNe II-P. Indeed, other than the Smartt et al. studies, progenitor masses for SNe II-P are virtually unconstrained by direct observation.222Mass constraints on the progenitors of other types of core-collapse SNe have been obtained through studies of their environments; see, e.g., Van Dyk et al. (1999b). Although the progenitors of SN 1961V (Goodrich et al. 1989; Filippenko et al. 1995; Van Dyk, Filippenko, & Li 2002), SN 1978K (Ryder et al. 1993), SN 1987A (e.g., White & Malin 1987; Walborn et al. 1987), SN 1993J (Filippenko 1993; Aldering, Humphreys, & Richmond 1994; Cohen, Darling, & Porter 1995), and SN 1997bs (Van Dyk et al. 1999a) have been identified, all of these SNe II were peculiar.
In this paper, we present 15 optical spectra and 30 photometric epochs of SN 1999gi sampling the first 169 and 174 days since its discovery, respectively, and derive its distance through the expanding photosphere method (EPM). We present and discuss our photometric and spectroscopic observations in § 2.1 and § 2.2, respectively. We estimate the reddening of SN 1999gi from a variety of techniques in § 2.3. We apply the EPM to SN 1999gi in § 3, and compare the derived distance to existing estimates of the distance to NGC 3184 in § 4.1. In § 4.2 we discuss the impact of our results on the progenitor mass limits previously determined by S01 and S02. We summarize our main conclusions in § 5. Note that much of the background material for the data and analysis presented in this paper, including the details of the photometric and spectral reductions as well as many specifics of the EPM technique itself, is thoroughly covered by earlier studies and therefore not repeated here. In particular, the recent analysis by L02 of SN 1999em, a strikingly similar event to SN 1999gi, is frequently referenced.
2 Reductions and Analysis
2.1 Photometry
We obtained 30 epochs of photometry for SN 1999gi, 26 of them taken with the Katzman Automatic Imaging Telescope (KAIT; Filippenko et al. 2001) and 4 with the 1.2 m telescope at the Fred Lawrence Whipple Observatory (FLWO). KAIT is equipped with a pixel Apogee CCD camera (AP7) located at the Cassegrain focus, providing a field of view of with per pixel. The FLWO 1.2 m is a Ritchey-Chrétien reflector equipped with a “4Shooter” CCD mosaic camera (A. H. Szentgyorgyi et al., in preparation), consisting of a array of thinned, backside illuminated, antireflection-coated Loral pixel CCD detectors situated at the Cassegrain focus, which provides a field of view on each chip. All exposures with the mosaic were made on the same CCD (Chip 3), and our observations were taken in a binned mode, so that the resulting images were sampled at per pixel. The seeing, estimated by the full width at half maximum (FWHM) of stars on the CCD frame, generally ranged from to at KAIT, and between to at FLWO. Exposure times of 3 to 5 minutes were typical at KAIT and 1 to 3 minutes at FLWO, with the longest exposures taken in .
![[Uncaptioned image]](/html/astro-ph/0207601/assets/x1.png)
![[Uncaptioned image]](/html/astro-ph/0207601/assets/x2.png)
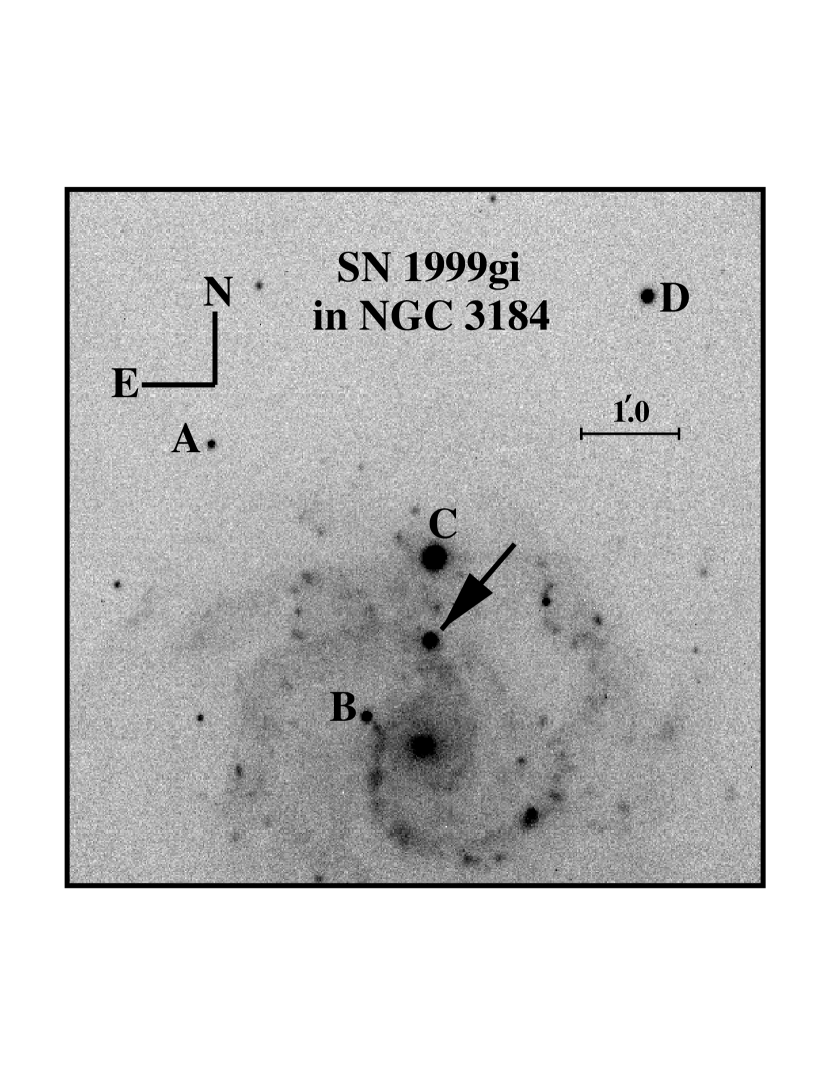
Figure 1 shows a KAIT -band image of NGC 3184 taken on 1999 December 17. The 4 “local standards” identified in the field of SN 1999gi were used to measure the relative SN brightness on non-photometric nights. We reduced the data according to the procedure detailed by L02, except that instead of using point-spread function (PSF) fitting to measure the SN’s brightness we employed the more accurate technique of galaxy subtraction (e.g., Filippenko et al. 1986; Richmond et al. 1995). To use this technique, an image of the host galaxy without the SN (i.e., a “template” image of the galaxy, taken either before the explosion or after the SN has faded beyond detection) is subtracted from the images containing the SN, with special care taken to match the alignment, intensity, and PSFs of the images with and without the SN present. Since we did not possess deep filtered pre-explosion images of NGC 3184, we obtained the templates on 17 January 2002 with the Nickel 1 m reflector at Lick Observatory. The Nickel telescope utilizes a Loral pixel CCD, which we binned to yield a plate scale of per pixel.
The absolute calibration of the field was accomplished on the three photometric nights of 2000 April 3 (with KAIT) and 2002 January 17 and 18 (with the Nickel 1 m), by observing several fields of Landolt (1992) standards over a range of airmasses in addition to the SN 1999gi field. The calibration of two of the local standards was further verified against the photometric calibrations by S. Benetti (personal communication; star “A” in Fig. 1) and B. Skiff333http://www.kusastro.kyoto-u.ac.jp/vsnet/Mail/vsnet-chat/msg02439.html (star “C” in Fig. 1), and found to agree to within the reported uncertainties. We list the measured magnitudes, and the uncertainty (quadrature sum of the photometric error and the scatter of the individual photometric measurements taken on the three nights), of the local standard stars in Table 1.
The transformation coefficients for the KAIT data to the standard Johnson-Cousins (Johnson et al. 1966 for ; Cousins 1981 for ) systems are those of L02. For the FLWO data with Chip 3 of the 4Shooter, we derived color terms from five photometric nights (1999 December 9, 2000 January 3, January 5, February 7, and February 16) of
| (1) | |||||
where are the instrumental and the standard Johnson-Cousins magnitudes. The terms and are the differences between the zero-points of the instrumental and standard magnitudes, determined for each observation by measuring the offset between the instrumental and standard magnitudes and colors of the local standard stars.
To transform the photometry to the standard Johnson-Cousins system we took the weighted mean of the values individually derived from the four calibrator stars. Since star “C” was saturated in nearly all of the FLWO observations, the FLWO photometry was usually derived using only three stars. The results of our photometric observations are given in Table 2 and shown in Figure 2. The reported uncertainties come from the photometric and transformation errors added in quadrature; in most cases, the total error was dominated by the uncertainty in the transformation.


The light curves of SN 1999gi indicate a fairly rapid initial rise followed by a clear plateau of nearly constant brightness in that lasts until about 100 days after discovery. To estimate the date of maximum in the and bandpasses (maximum brightness in and is not sharply defined and actually comes significantly after the initial rise; see Fig. 3 for detail of the light curves near maximum light), we fit spline functions to the data around the peak. To estimate the uncertainty in the date of maximum we measured the spread in the derived dates of maximum for 1000 sets of synthetic photometric data, in which each epoch’s photometry near the peak was replaced with a value randomly chosen from a Gaussian-weighted distribution centered on the values given in Table 2 and characterized by a standard deviation equal to the uncertainty listed in Table 2. From this analysis we conclude that mag occurred on HJD 2,451,526.2 (1999 December ), which is days after discovery. For we find mag on HJD 2,451,530.0 (1999 December ), which is days after discovery. The decline in the band over the first 100 days after maximum light is mag, which definitively establishes SN 1999gi as a Type II-P event according to the definition by Patat et al. (1994), used to discriminate SNe II-P ( mag) from SNe II-L ( mag). The average apparent -band brightness during the plateau, defined as the unweighted mean of the values from days after the explosion (determined by the EPM analysis in § 3), is mag.
The photometric behavior of SN 1999gi is extremely similar to that of SN 1999em, with both having plateau durations of days after -band maximum as well as similar -band decline rates (see L02). In fact, once an allowance is made for a small reddening difference ( mag), the color evolution of the two objects is nearly identical (Fig. 4). The optical “double peak” noted by L02 for SN 1999em, in which a second local maximum follows the initial peak ( days later for the -band in SN 1999em), is also discernable in the photometry of SN 1999gi (see Fig. 3). However, the second peak is certainly not as obvious as it was in the photometry of SN 1999em, a situation likely exacerbated by the relatively sparse photometric coverage obtained during this period for SN 1999gi compared with SN 1999em.
2.2 Spectroscopy
Table 3 lists the spectral observations of SN 1999gi. All one-dimensional sky-subtracted spectra were extracted optimally (Horne 1986) in the usual manner. Each spectrum was then wavelength and flux calibrated, as well as corrected for continuum atmospheric extinction and telluric absorption bands (Wade & Horne 1988; Bessell 1999; Matheson et al. 2000). With the exception of the very first spectrum (day 0.61, 300 s observation), all spectra were observed near the parallactic angle (Filippenko 1982), so the spectral shape should be quite accurate.444A direct comparison of the first spectrum with the one taken immediately after it at the parallactic angle (day 0.62, 600 s observation) confirms that the low airmass (1.14) of this observation renders the effects of differential light loss negligible.
![[Uncaptioned image]](/html/astro-ph/0207601/assets/x7.png)
The spectral evolution of SN 1999gi during the first 168 days of its development is shown in Figure 5, and is very similar to that seen for SN 1999em (L02; see also Leonard & Filippenko 2001, Fig. 10). As is typical for SNe II-P, the early-time spectrum is characterized by a smooth thermal continuum with superposed hydrogen Balmer and He I P-Cygni lines. During the plateau phase, numerous metal-line P-Cygni features complicate the spectrum (see L02 for a complete identification of these features). Emission-dominated lines then become prominent as SN 1999gi drops off the plateau and makes the transition to the nebular phase.

To estimate the recession velocity of SN 1999gi we measured the peak wavelength of the narrow H line resulting from the superposed H II region. From this, we determine that km s-1, where the uncertainty is the spread in the velocities derived from the individual spectra. This velocity is to be compared with the value reported for NGC 3184 by Strauss et al. (1992) of km s-1, which was derived from narrow H II emission in the central of the galaxy. Since SN 1999gi is quite far away from the center of NGC 3184 (Fig. 1), our velocity is likely a more accurate estimate of the true velocity of the SN. We therefore use it to derive all photospheric velocities in the EPM analysis in § 3; ultimately, using the larger Strauss et al. (1992) value would result in a final EPM distance that is larger than that derived with our lower recession velocity.
The very early-time H and He I line profiles of SN 1999gi are shown in Figure 6, and warrant special comment. In early-time spectra of SN 1999em, Baron et al. (2000) identify “complicated P-Cygni” profiles, in which the usual P-Cygni absorptions for H and He I are accompanied by a second absorption at much higher velocity. From comparison with theoretical models, Baron et al. (2000) conclude that these high-velocity absorption features result from non-local thermodynamic equilibrium effects that produce two line-forming regions in the expanding atmosphere. Leonard et al. (2001) also identify these high-velocity features in an early spectrum of SN 1999em. In addition, L02 propose that complex P-Cygni profiles of strong lines may also explain a number of previously unidentified absorption features in spectra of SN 1999em at later times, during the photospheric and early nebular phases; detailed modeling, however, is required to confirm these identifications. The early-time absorption features observed in the spectra of SN 1999em were rather subtle, and left open the question of whether they were true P-Cygni features containing both a dip and a peak. As clearly seen in Figure 6, similar high-velocity features are also evident in the early spectra of SN 1999gi. Furthermore, the H profiles from days 3 and 4 reveal that the high-velocity feature is indeed characterized by a true P-Cygni profile.
The earliest spectrum, from day 1, is particularly interesting. In He I there is just a hint of the higher-velocity component in addition to the “normal” line feature. Near the expected location of the high-velocity feature in H (i.e., based on its position in the spectra from days 3 and 4), there is a strong emission feature which, if identified with H, extends out to nearly km s-1. If this association is confirmed by detailed models, it would demonstrate the existence of very high velocity material in the outer envelope of SN 1999gi at these early times. Although the “normal,” lower-velocity component of H is likely present at this early epoch, it is clearly much weaker than the higher-velocity component.555Although not shown in the figure, we note that there is also a strong feature at the expected location of a high-velocity component for H, but the identification is ambiguous since the lower-velocity absorption of H is expected at nearly the same location. Interestingly, near the expected location of H, we find that while the “normal” profile is observed at all epochs (including day 1), a high-velocity feature is not apparent in the spectra from days 1, 3, and 4. At later times, during the photospheric and early nebular phases, the high-velocity absorption features attributed by L02 to H, Na I D, and H in spectra of SN 1999em are also seen in the spectra of SN 1999gi: They are consistently detected in H and Na I D at km s-1 through the spectrum on day 111, and are obvious in H (at km s-1) in the spectra on days 32 and 35. Further detailed modeling is urged in order to better establish the physical mechanism behind these intriguing features.

2.3 The Reddening of SN 1999gi
SN 1999gi has minimal Galactic reddening, = 0.017 mag (Schlegel,
Finkbeiner, & Davis 1998). In order to estimate the total reddening (or
to set limits on how high it can be), we shall compare the results obtained
from the following five independent techniques.
1. Compare the early-time spectral shape with blackbody functions. As discussed by Eastman et al. (1996), an upper reddening limit can be established for an SN II-P by comparing its very early-time spectral shape with an arbitrarily hot blackbody function. The basic idea is that at very high temperatures (i.e., early times for an SN II-P) the optical continuum is on the Rayleigh-Jeans tail of the Planck spectrum, whose slope is quite insensitive to temperature (i.e., in the limit ). If a hot, early-time spectrum (with accurate continuum shape) is available (the earlier, the better, since cooler spectra will result in a less-restrictive upper bound), one can determine the maximum allowable reddening by dereddening the spectrum to the point at which even an unphysically hot blackbody function (say, K) can no longer fit the continuum. As shown in Figure 7, the inability of a blackbody at any temperature to match the continuum shape of SN 1999gi when dereddened by mag effectively establishes this as an upper limit for the reddening of SN 1999gi. The true reddening of the SN, of course, is likely to be substantially lower. For instance, the more reasonable color temperature of K is shown in Figure 7 to correspond with a reddening of mag.

2. Compare the color evolution of SN 1999gi with SN 1999em. Schmidt, Kirshner, & Eastman (1992) demonstrate that the color evolution of the 5 SNe II-P in their study is quite similar, with the observed discrepancies consistent with reddening differences among the objects. Although still limited by the small number of well-studied examples, it is tempting to posit that all SNe II-P undergo similar color evolution, at least through the end of the recombination phase. If this is so, then it should be possible to estimate (and set hard upper limits on) the reddening of SN 1999gi by comparing it with SN 1999em, which was extensively modeled by Baron et al. (2000), who set a firm upper limit of mag and estimated the likely reddening to be mag. (The EPM analyses of Hamuy et al. 2001 and L02 are also consistent with low reddening for SN 1999em.) The similar color evolution shown in Figure 4, where the data for both objects are plotted with respect to the date of -band maximum, suggests a reddening difference between the two objects of mag, implying that mag, with mag serving as a hard upper limit. Of course, this analysis assumes the intrinsic color evolution of the two objects to be identical with respect to the date of maximum brightness. If the analysis is instead done with respect to the explosion date (derived from the EPM analyses), then the best agreement is found for mag, in which case mag then becomes the upper bound. We therefore conclude that the comparison of the color evolution of SN 1999gi with that of SN 1999em implies a reddening of mag for SN 1999gi.
3. Translate observed Na I D interstellar absorption equivalent width into a reddening estimate. The correlations between the Na I D interstellar line equivalent width and reddening found by Barbon et al. (1990) and Munari & Zwitter (1997) are known to have a very large scatter, especially when only low-resolution spectra are available (see Leonard & Filippenko 2001 for a more extensive discussion of the utility of these relations). Nevertheless, it is useful to compare the predictions that these relations make with the results of the other, perhaps more accurate, techniques.
To derive the Na I D equivalent width in the spectrum of SN 1999gi, we first co-added the normalized region around the Na I D lines in the 5 earliest spectra, which had the highest signal-to-noise ratio (S/N) in the region of interest (i.e., we combined the spectra up through and including the one taken on day 31.61; the spectrum from day 34.60 was corrupted by a cosmic-ray spike in the Na I D region, and the high S/N spectrum from day 106.59 could not be used with confidence since the Na I D absorption occurred very near the maximum of an SN feature, making proper continuum placement difficult). From this composite spectrum we measure Å, with Å, and Å; the uncertainty in the measurements represents the spread in the automated measurements of 1000 sets of simulated data characterized by the S/N of the composite spectrum. To solve for the D1 and D2 components separately we used the Levenberg-Marquardt maximization algorithm (Press et al. 1992) with Gaussians constrained to have identical widths (set equal to the spectral resolution), and separated by Å. Note that since the and values are the result of model fits, whereas is measured directly from the (noisy) spectrum, the sum of the equivalent widths of the individual lines does not exactly equal the reported total equivalent width (but is equal within the uncertainty). From these values, the Barbon (1990) relation yields mag, and the Munari & Zwitter (1997) relation gives mag. From a similarly constructed composite spectrum centered on the expected location of the Na I D lines in the Milky Way (i.e., at zero velocity), the absence of detectable absorption implies an upper limit on the total equivalent width due to Galactic gas of Å through Equation 4 of Leonard & Filippenko (2001); this translates into an upper reddening limit of mag from the Barbon (1990) relation, which concurs with the value given by Schlegel et al. (1998). The total reddening predicted by these crude relations is therefore found to be mag, a value that is consistent with the upper limits and values derived by the other methods.
4. Assume the reddening to SN 1999gi to be the same as that derived to the young OB association in which it is situated. From analysis of WFPC2 HST observations of NGC 3184, S01 conclude that SN 1999gi originates in a resolved, young OB association. By comparing the evolutionary isochrones of Lejuene & Schaerer (2001) with the color-magnitude diagram of the stars in the OB association (i.e., those within of SN 1999gi), S01 find mag to give the best fit to the cluster, and note that for reddenings above mag the isochrones fail to match the color of the brightest sources.
5. Assume the reddening to SN 1999gi to be the same as that derived to a nearby H II region. In order to estimate nebular abundances in NGC 3184, Zaritsky, Kennicutt, & Huchra (1994) determined the reddening towards 19 H II regions, one of which is just away from SN 1999gi, and located in the OB association identified by S01 to likely contain the progenitor of SN 1999gi. Assuming (Savage & Mathis 1979), Zaritsky et al. (1994) find mag to this nearby H II region.
None of the techniques that we have used to estimate the total reddening to SN 1999gi is individually unassailable. Potential weaknesses of each technique are as follows (given for each of the techniques, respectively). (1) Early-time SN II-P color may depart slightly from a single-temperature blackbody. (2) All SNe II-P may not evolve in a similar manner, and SN 1999gi and SN 1999em may not have been identical events. (3) Sodium is known to be only a fair tracer of dust, and our low-resolution spectra do not resolve the individual absorption systems that contribute to the Na I D lines, making it impossible to estimate the effect of line saturation. (4 & 5) The reddening along the specific line-of-sight to SN 1999gi may differ from the average reddening to the OB association and/or the reddening to specific association members (see, e.g., Yadav & Sagar 2001). Nonetheless, taken together the general agreement of all the estimates makes a compelling case for low reddening to SN 1999gi, with mag (comparison with SN 1999em); mag (Na I D absorption); mag (reddening to OB association); and (reddening to H II region), and an upper reddening limit of mag coming from the analysis of the early-time continuum shape. If the color evolution of SN 1999gi is intrinsically the same as that of SN 1999em with respect to the time of maximum light, then we can restrict the upper bound even further, to mag. In § 3, we shall see that additional evidence for low reddening to SN 1999gi comes from the EPM analysis itself, which predicts mag. Taking the simple average of the five specific reddening estimates (i.e., including the EPM estimate derived in § 3, but not incorporating the upper limit derived from the blackbody comparison) yields mag, where the uncertainty is the spread of the individual reddening estimates from the mean. We adopt this value as our best estimate of the reddening of SN 1999gi.
3 The EPM Applied to SN 1999gi
To derive the EPM distance to SN 1999gi we follow the procedure detailed by L02. Briefly, an EPM distance is calculated by comparing the linear radius of the expanding supernova photosphere, , with the photosphere’s angular size, , to derive the distance to the SN, (Kirshner & Kwan 1974). The radial velocity of the expanding photosphere, , is found from the Doppler shifting of the spectral lines, so that , where () is the time since explosion and the SN is assumed to be in free expansion. The photosphere’s theoretical angular size, , is calculated by comparing the observed flux with that predicted from theoretical models (i.e., a “dilute” blackbody; Eastman et al. 1996) for a spherical SN photosphere as
| (2) |
where is the Planck function at color temperature , is the flux density received at Earth, is the extinction, and is the color temperature dependent “dilution factor” (or “distance correction factor,” since it “corrects” derived distances such that ; see L02 for a thorough discussion of this term). Since accurate spectrophotometry is generally not available, Equation 2 is typically recast in terms of broadband photometry, with and derived for some subset of . With and known, can be found since in the small-angle approximation. Substituting for and rearranging, we arrive at
| (3) |
A plot of against should therefore result in a line with slope and -intercept .
As discussed by L02, the overall level of the theoretically derived dilution factor, , has long been touted as potentially the largest source of systematic uncertainty in the application of the EPM to SNe II-P, due mainly to the fact that most applications of the EPM have relied on the dilution factors produced by only one modeling group (i.e., Eastman et al. 1996). Since no other independent modeling group has published dilution factors appropriate for SNe II-P,666Eastman et al. (1996) stress that their dilution factors are only appropriate for SNe II-P, and not to peculiar variants of the SN II subclass. Eastman et al. (1996) also note that the models of Montes & Wagoner (1995), while appropriate for SNe II-P, are difficult to directly compare with their results, since Montes & Wagoner (1995) define somewhat differently, and also do not model the effect that line blanketing has on the apparent color temperature. it is difficult to quantify the amount of systematic uncertainty that the reliance on only one group’s dilution factors contributes to EPM distances. However, to get a sense of the possible differences among modeling groups, it is instructive to consider the two unusual (i.e., not SNe II-P) core-collapse events for which independent dilution factors from another group have been derived: SN 1987A and SN 1993J.
Recently, Mitchell et al. (2002) derive a distance to SN 1987A of kpc through detailed modeling of the spectra and the use of the “spectral-fitting expanding atmosphere method” (SEAM; Baron et al. 1993; Baron, Hauschildt, & Branch 1994; Baron et al. 1995). This distance is in excellent agreement with other, independent distance estimates to SN 1987A and the Large Magellanic Cloud (see, e.g., Gibson 2000). SN 1987A was not a classical SN II-P: Its progenitor was a compact blue supergiant and its light curve became powered by radioactivity substantially earlier than is typical for SNe II-P, which result from progenitors with more extended envelopes. Nonetheless, Mitchell et al. (2002) do provide a direct comparison between the dilution factors resulting from their SN 1987A-like models with two of the SN II-P models by Eastman et al. (1996), for dilution factors derived using the bandpasses to estimate the color temperature. While they find quite good agreement between the dilution factors at both high ( K) and low ( K) temperatures, they note some disagreement in the important temperature range of K. In this region, the dilution factors of Mitchell et al. (2002) are larger than those of Eastman et al. (1996). This implies that using the dilution factors of Eastman et al. (1996), then, would result in a shorter distance to SN 1987A (e.g., smaller if only this temperature range were considered) than that found by using the Mitchell et al. (2002) models. Recently, Hamuy (2001) has derived the EPM distance to SN 1987A using the dilution factors of Eastman et al. (1996), as slightly modified for the effects of telluric absorption by Hamuy et al. (2001). As anticipated from the comparison by Mitchell et al. (2002), Hamuy (2001) indeed finds a shorter distance to SN 1987A. Using the dilution factors for the filter combination (while noting that these dilution factors are not entirely appropriate for SN 1987A), Hamuy (2001) finds kpc. The discrepancy between the two results may be due to the unusual nature of SN 1987A, and not to fundamental differences in the modeling results. Further supporting this notion, we note that when Eastman & Kirshner (1989) derived an EPM distance to SN 1987A with models custom-crafted for this unusual event, they found kpc, a value that is quite consistent with the Mitchell et al. (2002) value.
In a similar manner, Baron et al. (1995)777Note that Baron et al. (1995) and Mitchell et al. (2002) both employ the same radiative transfer code, PHOENIX (Baron et al. 1994), whereas the Eastman et al. (1996) values were derived using the radiative transport code EDDINGTON (Eastman & Pinto 1993). derive a SEAM distance to SN 1993J, a “Type IIb” event (Filippenko 1988) thought to arise from a progenitor that exploded with just a low-mass outer layer of hydrogen remaining since the spectrum showed hydrogen at early times but subsequently became helium-dominated (see Matheson et al. 2000, and references therein). Using models customized to match the observed spectra of SN 1993J, Baron et al. (1995) derive a distance of Mpc, which is in good agreement with the Cepheid distance (corrected for metallicity effects) recently reported by Freedman et al. (2001) to its host, M81, of Mpc. Baron et al. (1995) compare the dilution factors derived from their models of SN 1993J with those of Schmidt (1993), in which a preliminary version of the dilution factors ultimately published by Eastman et al. (1996) was presented. Although it was not possible to make a detailed comparison at the time (Schmidt only presents the dilution factors in graphical form), Baron et al. (1995) noted that their values for SN 1993J were generally greater than those of Schmidt (1993) by about . This implies that applying the EPM to SN 1993J with the dilution factors appropriate for an SN II-P should lead to an underestimate of the distance. Indeed, when Schmidt et al. (1993) apply the dilution factors of Schmidt (1993) to SN 1993J, they find Mpc, a value closer than that derived by Baron et al. (1995). As was the case with Hamuy (2001) for SN 1987A, Schmidt et al. (1993) point out the potential danger in applying the dilution factors crafted for SNe II-P to SN 1993J, concluding that “supernova models that more closely match the atypical spectral features of SN 1993J may change the inferred distance.”
Therefore, although discrepancies exist between the dilution factors presented by Eastman et al. (1996) and those provided by one other group for SN 1987A and SN 1993J, we conclude that at least some of the observed difference may be explained by the fact that Eastman et al. (1996) specifically modeled SNe II-P atmospheres, whereas the SNe modeled by the other group were both peculiar SN II events. Lacking a direct comparison between other modeling groups’ values for the dilution factors derived specifically to SNe II-P and those presented by Eastman et al. (1996), it remains difficult to quantify the degree of systematic uncertainty that the dilution factor adds to distances determined to SNe II-P at this time; a direct comparison of the dilution factors between modeling groups for SN II-P atmospheres is urged to help better quantify this potential source of systematic uncertainty in the EPM technique.
For our study of SN 1999gi, by all accounts a “normal” SN II-P, we shall use the dilution factors of Eastman et al. (1996) as slightly modified by Hamuy et al. (2001), for the , , and filter combinations. As recommended by L02, we determine the photospheric velocity of SN 1999gi at each spectral epoch by taking the weighted average of the blueshift of the absorption troughs of the available weak, unblended line features due to Fe II , Sc II , Fe II , and Fe II . These features are not present in the three earliest spectra, so we follow L02 and use the weakest available lines that are found to yield the lowest consistent velocity at these times, namely H, H, H, and He I . The magnitudes of SN 1999gi at each of the spectral epochs were derived through interpolation from the nearby values. Table 4 lists the values of the parameters used in the EPM analysis.
![[Uncaptioned image]](/html/astro-ph/0207601/assets/x11.png)
Because reddening affects the inferred color temperature as well as the apparent SN brightness, the value of (Eq. 2) and, therefore, the derived distance and time of explosion will surely have a reddening dependence. One strength of the EPM technique is that the derived distance should be rather robust to uncertainty in reddening since both and in Equation 2 have similar dependencies: higher reddening decreases both the observed flux and the color temperature in a smooth, regular manner. However, one must also consider the temperature dependence of the dilution factor, , which behaves quite differently for the various filter combinations. For the , , and filter combinations, is rather insensitive to color temperature for K (see Eastman et al. 1996; Hamuy et al. 2001). As the temperature drops below 8000 K, rises for all three filter combinations, and the strength of the temperature dependence varies considerably, from a rather weak dependence in to stronger dependencies in and, especially, .
How might we expect uncertainty in the reddening to affect the derived distances and explosion dates for our data set? Our spectral measurements of SN 1999gi essentially sample two different epochs, one very early ( days after discovery) and the other later during the plateau ( days). At the early times, the color temperatures derived from all three filter combinations is greater than 8000 K; we therefore expect little change in for different assumed reddenings at these times. For the later set of data points, however, K, and will be quite sensitive to reddening changes, especially in the and filter combinations. Now, the slope (distance) and -intercept (time of explosion) of the line described by Equation (3) are affected somewhat differently by changes in . A uniform change in the overall level of at each epoch (i.e., an offset) will only affect the -intercept (). A differential change in , on the other hand, will affect both the the -intercept and the slope (). The rapidly changing values of with in the and filter combinations should therefore lead to a relatively greater dependence on reddening for the derived distances in these filter combinations than for . On the other hand, since all filter combinations are sensitive to the more uniform changes in brought about by changes in and , we might anticipate the derived explosion times to be more equally affected by reddening uncertainty in the 3 filter combinations.
The EPM distances and explosion times derived for , , and as a function of assumed reddening are shown in Figure 8; to calculate the values we have limited the EPM analysis to the first six spectral epochs (see discussion below, and Fig. 9). To give a sense of the formal uncertainty in the distance for each filter combination, (statistical) error bars sampling reddening increments of mag are also shown. These errors represent the spread in the distances derived for each of the filter combinations from 1000 simulated sets of data characterized by the values and uncertainties given in Table 4. As anticipated, distances derived using the and filter sets are more sensitive to changes in reddening than are distances determined using the filter combination. The convergence of the distances derived using the different filter combinations at mag agrees with the conclusion of § 2.3 that SN 1999gi suffers little extinction, and builds further confidence that the EPM technique itself may be used to estimate SN II-P reddenings (e.g., Hamuy et al. 2001). For the purpose of deriving the final EPM distance and its uncertainty, we shall use the reddening value derived in § 2.3, mag, which represents the average of the EPM-derived reddening along with the 4 other reddening estimates discussed in § 2.3.

The value of in Figure 8 also shows somewhat better mutual consistency among the different filter combinations at lower reddenings, but there is no strong preference for a particular reddening value. The inconsistency among the different filter combinations for the derived explosion dates is troubling, and may result from the use of “average” dilution factors rather than a set custom made for SN 1999gi.
We determine the final distance and time of explosion of SN 1999gi by taking the simple means of the values derived from the three filter combinations for mag, and find Mpc and days before discovery ( 10.02, 10.84, and 12.33 Mpc and days, for the , , and bandpasses, respectively). Although it is difficult to assign a precise statistical error bar to this result, there are two identifiable sources that do contribute quantifiable uncertainty to the values of and . First, there is the spread in the values found from the three individual filter combinations for mag, which are Mpc and days. The second source of uncertainty comes from the uncertainty in the reddening estimate of mag. This uncertainty leads directly to an uncertainty in distance of Mpc and an uncertainty in the explosion date of days. The final estimate of the statistical uncertainty is found by taking the quadrature sum of the two sources of error. From this, then, our best estimate of the distance and time of explosion of SN 1999gi is Mpc and days before discovery. Although the uncertainty is somewhat larger than the statistical error associated with the individual distances (especially using the and filter combinations), we feel it more accurately reflects the overall uncertainty in the distance, since we have no a priori preference for any of the filter combinations, and our reddening estimate suffers from uncertainty as well.
To give an idea of the relevant derived parameters, we list the dilution factor, photospheric angular size, and photospheric color temperature for mag in Table 5, and plot the values used in the EPM analysis for this reddening in Figure 9. In Figure 9 we see that the data obtained near the very end of the plateau ( days; open circles) are somewhat inconsistent with the earlier data; this is probably due to the fact that the theoretical models of Eastman et al. (1996) include no spectra with color temperatures as low as those derived for SN 1999gi at these late times (Table 5), and so the inferred dilution factors rely completely on extrapolation. At these low temperatures, the dilution factor, especially in and , is changing very rapidly with temperature. The EPM distance is therefore more securely obtained from the earlier epochs, and we thus have only used the data from the first six spectral epochs to derive the distance to SN 1999gi.
![[Uncaptioned image]](/html/astro-ph/0207601/assets/x13.png)

4 Discussion
4.1 EPM Distance
The distance to NGC 3184 has previously been estimated through a variety of different techniques, and it is useful to compare these with our EPM distance of Mpc. The earliest estimate is that of de Vaucoleurs (1979), who finds Mpc from tertiary indicators (diameters, magnitudes, and luminosity index of spiral galaxies). Pierce (1994) derives a Tully-Fisher (TF) distance to NGC 3184 of Mpc, although he points out that the low inclination () of NGC 3184 makes this distance more uncertain than the statistical error bar alone suggests. Using a similar approach, but with updated models and parameters, Paturel et al. (in preparation; the result is listed in the LEDA database prior to formal publication) derive Mpc.888This distance estimate, given by the “mup” parameter in the LEDA database (i.e., using the TF method for spiral galaxies), may change somewhat in the future when a more sophisticated calculation is implemented, which properly accounts for the effects of statistical bias (G. Paturel, personal communication). From the recession velocity corrected for Virgo infall (Bottinelli et al. 1986; Sandage & Tammann 1990), and assuming km s-1 Mpc -1, LEDA also lists a kinematic distance of Mpc. Finally, although relatively isolated, NGC 3184 is cataloged to be in a small group of four galaxies (Tully 1988; Giuricin et al. 2000), two of which have had Cepheid distances derived by the HST Key Project (see Freedman et al. 2001, and references therein). The final Key Project distances to these two possible group-member galaxies, corrected for metallicity, are Mpc (NGC 3319) and Mpc (NGC 3198).
The distance estimates to NGC 3184 (or galaxies that may be in its group) therefore span a range Mpc. Our EPM distance of Mpc is certainly consistent with this range, and finds best agreement with the updated TF and kinematic distances listed in LEDA. We note, however, that the EPM distance is somewhat inconsistent with the two Cepheid group-member distances, in the sense by for the average of the two Cepheid distances. Since the uncertainty inherent in comparing distances derived among putative group-member galaxies could certainly account for much of the discrepancy, it is not clear how meaningful this comparison is. Along these lines, we point out that the direct comparison between a Cepheid distance to a host galaxy of an SN II-P (the type for which EPM is most securely applied) has only been carried out thus far for one object, SN 1973R (see L02 for a complete listing of Cepheid-EPM distance comparisons), and unfortunately the EPM distance is highly uncertain (). The HST Cycle 10 program to directly compare the Cepheid-based distance to the host galaxy of SN 1999em (D. C. Leonard et al., in preparation) with the EPM distances derived by Hamuy et al. (2001) and L02 will offer one solid test of the consistency of these two primary extragalactic distance indicators. Given the importance of firmly establishing the value of from primary distance indicators, additional direct comparisons between the Cepheid distances of the host galaxies of well-observed SNe II-P and the EPM distances seem warranted.
Knowing the distance to SN 1999gi allows us to compare its absolute brightness with that of previous SNe II-P. For 9 photometrically confirmed SNe II-P with EPM distances, L02 find the mean plateau absolute magnitude to be mag, with SN 1999em itself having mag. Correcting for mag (i.e., adopting mag and [Savage & Mathis 1979]), we measure mag for SN 1999gi, where the uncertainty incorporates both the uncertainty in the EPM distance as well as the uncertainty in the reddening. Again, the similarity between SN 1999gi and SN 1999em argues that these were very similar events. The consistency of for SN 1999gi with previous SNe II-P also strengthens the suggestion by L02 that distances good to () may be possible for SNe II-P by simply measuring , obviating the need for a complete EPM analysis, unless a more accurate distance is desired.999Hamuy & Pinto (2002) refine this technique, showing that a measurement of the plateau magnitude and the ejecta expansion velocity potentially yields a considerably smaller uncertainty in the derived distance.
4.2 Progenitor Mass
Recently, S01 and S02 utilized a relatively new technique to set limits on the progenitor masses of core-collapse SNe. Essentially, the procedure is as follows. (1) Search pre-explosion images of the SN’s host galaxy (either ground-based or, preferably, from HST) to look for a progenitor star at the location of the SN (the use of post-explosion HST images is especially helpful here to pinpoint the exact SN location). (2) If no progenitor is found, determine the detection threshold of the image. (3) Assume a distance to the galaxy and a reddening to the SN (and assume it is the same as the reddening to the progenitor star) and use the appropriate bolometric corrections to translate the detection threshold into an upper bound on the progenitor luminosity. (4) Use H II region studies of the host galaxy to establish a likely metallicity for the progenitor star. (5) Use stellar evolution models to predict the final pre-explosion luminosity and effective temperature of stars spanning the range of initial masses believed to result in core-collapse SNe of the observed type (e.g., for SNe II-P resulting from metallicity stars, S01 eliminate all progenitors with since such stars are expected to undergo significant mass loss, which is deemed to be inconsistent with the observed characteristics of SNe II-P). Finally, (6) determine which progenitor masses would have remained undetected given the detection threshold of the image. Since more massive main-sequence stars generally result in brighter progenitors, it may be possible to set an upper mass limit for an undetected progenitor star through this approach.
The first of two objects examined by these studies is SN 1999gi (the other is SN 1999em), for which two pre-discovery HST WFPC2 images of NGC 3184 exist, one taken through the F606W filter (central wavelength Å) for 160 s, and the other through the F300W filter (central wavelength Å) for 800 s. Using two post-explosion HST images to pinpoint the SN position, S01 are unable to detect a progenitor star in either image. From simulations with synthetic stars, S01 derive the image detection limits as well as the uncertainty in these limits. To turn this into a luminosity limit, they then assume a distance to NGC 3184 of Mpc. This distance is adopted due to the general agreement that they found among three estimates: (1) the kinematic distance using the Strauss et al. (1992) recession velocity of km s-1 and km s-1 Mpc-1, with no correction for Virgo infall (yields Mpc); (2) the TF distance derived by Pierce (1994; Mpc); and (3) the distance estimated by tertiary indicators (de Vaucoleurs 1979; Mpc). From their analysis of the colors of the stars in the OB association to which the progenitor of SN 1999gi presumably belonged, S01 conclude that mag, in good agreement with the values found by our other estimates (§ 2.3). The H II region study of NGC 3184 by Zaritsky et al. (1994) leads S01 and S02 to conclude that the cluster containing SN 1999gi has a metallicity somewhere between solar and twice solar, and so they adopt for the progenitor. They then use the Geneva evolutionary tracks (Meynet et al. 1994; Schaller et al. 1992), which follow stars up to the point of core carbon ignition, to estimate the pre-explosion luminosity of progenitor stars for . Comparing the progenitor star luminosities with the image detection threshold, then, leads S01 to set an upper limit for the progenitor of SN 1999gi of .

In a similar analysis, but for the progenitor of SN 1999em, S02 introduce an improved stellar evolutionary model based on the most recent version of the Eggleton (1971, 1972, 1973) evolution program, which follows stars all the way through their carbon-burning lifetimes. It is shown that the final luminosities predicted for progenitor stars of are significantly affected by the carbon-burning stage, curiously predicting stars of to be more luminous in their final stages than those with . Despite these changes in the evolutionary code, S02 state that a reanalysis of the SN 1999gi data using the new stellar models results in the same upper limit as that previously derived. Since stars less massive than are not expected to undergo core collapse, an upper mass limit of for the progenitor of SN 1999gi is highly restrictive, and narrows the range of possible progenitor masses to be essentially between and . Interestingly, for SN 1999em, S02 find it very difficult to reconcile the lack of a detection with the theoretically predicted final luminosities of the progenitor stars: Given the stated limits, all stars with initial mass should have been detected. It is only by considering the uncertainty on the threshold limit ( dex) that S02 are able to (barely) explain the non-detection, and then only for a very narrow range of possible progenitor masses, .
We now reexamine the progenitor mass limit of SN 1999gi in light of our present study. We note that the distance adopted to NGC 3184 by S01 is significantly shorter than the more recently derived distances (§ 4.1), including our EPM distance to SN 1999gi of Mpc (§ 3). Naturally, a longer distance will result in a brighter intrinsic luminosity detection threshold. Reproducing the analysis of S01, Figure 10 shows the revised detection limits using Mpc and mag for the progenitor of SN 1999gi, along with the Geneva evolutionary tracks of stars for metallicity. From this analysis, the upper mass limit for a non-detection of the progenitor star for SN 1999gi increases to ; following S01, the uncertainty is simply set by the nearest modeled progenitor masses on either side of the observed limit.
Using the more recent stellar evolutionary models of S02 (which are only explicitly done for metallicity, though metallicity changes do not substantially alter the final pre-explosion luminosity at the low masses considered), Figure 11 shows a close-up of the expected pre-explosion position for stars of along with the detection limits of the F606W filter; the uncertainties in the detection limits (taken to be dex) are also shown. From this, we see that only progenitors with masses greater than should have been detected. Moreover, when we consider the uncertainty in the detection threshold itself, as was done by S02, it is possible to include all progenitors among those that could conceivably have avoided detection. Applying the same criterion as the most recent analysis by S02, then, results in an updated upper mass limit for the progenitor of SN 1999gi of .

Hence, using the techniques employed by S01 and S02, but using our revised distance and reddening estimates, we arrive at a consistent value of as the upper mass limit for the progenitor of SN 1999gi, compared with the upper limit of derived by S01 and S02. The increased upper limit results mainly from the larger distance derived through the EPM than was assumed by the earlier analyses. It is unfortunate that the only progenitor stars thus far positively identified for Type II supernovae are for unusual events (§ 1). Clearly, the detection of a progenitor star in a pre-explosion image for an SN II-P would have much to tell us about the late stages of stellar evolution for isolated massive stars, and would serve as a very useful check on the ability of models to accurately predict their final luminosity. However, since the uncertainty in the detection limits for SN 1999gi (and SN 1999em as well) is of the same order as the theoretically derived luminosity differences among the candidate progenitor stars, the ability of the Smartt et al. technique to robustly discriminate among progenitors in the range is questionable.
5 Conclusions
We present 15 optical spectra and 30 photometric epochs of SN 1999gi sampling the first 169 and 174 days since discovery, respectively, and derive its EPM distance. Our main conclusions are as follows.
-
1.
SN 1999gi is a Type II-P event with a photometric plateau lasting until about 100 days after discovery. It reached maximum on 1999 December (HJD 2,451,526.2 , or days after discovery), and achieved peak and magnitudes of and , respectively. Overall, we find the photometric behavior of SN 1999gi to be extremely similar to that of SN 1999em.
-
2.
The very early-time spectra of SN 1999gi confirm the existence of the high-velocity absorption features in the profiles of H and He I that were first identified by Baron et al. (2000) in spectra of SN 1999em. The highest-velocity feature (H, day 1) extends out to nearly km s-1, implying the existence of very high velocity material in the outer envelope of SN 1999gi at early times. These features are verified to be true P-Cygni profiles, consisting of both an absorption trough and an emission peak in early-time spectra. The high-velocity features are not seen, however, in H at early times.
-
3.
By comparing the early-time spectral shape with blackbody functions we derive an upper limit on the reddening of SN 1999gi of mag; comparison with the color evolution of SN 1999em suggests an even lower limit, of mag. Other reddening estimates are consistent with these limits, and imply a somewhat lower reddening, mag, which we adopt as the preferred reddening value.
-
4.
Our best estimate for the EPM distance and explosion time of SN 1999gi is Mpc and days prior to discovery. This distance is consistent with some recent distance estimates to NGC 3184, but is shorter than the average of the Cepheid distances derived to two putative group-member galaxies.
-
5.
The EPM distance implies an average plateau brightness of mag, which is very similar to the value found for SN 1999em and consistent with the average plateau brightness found by L02 of mag for 9 photometrically confirmed SNe II-P with EPM distances.
-
6.
Following the analysis methods of S01 and S02 we derive a new upper mass limit for the progenitor of SN 1999gi of , which is substantially less restrictive than the original limit of found by S01 and S02. The higher limit comes mainly from the longer distance derived through the EPM, than was assumed by the earlier analyses.
References
- (1)
- (2) Aldering, G., Humphreys, R. M., & Richmond, M. 1994, AJ, 107, 662
- (3) Barbon, R., Benetti, S., Cappellaro, E., Rosino, L., & Turatto, M. 1990, A&A, 237, 79
- (4) Baron, E., et al. 2000, ApJ, 545, 444
- (5) Baron, E., Hauschildt, P. H., & Branch, D. 1994, ApJ, 426, 334
- (6) Baron, E., et al. 1995, ApJ, 441, 170
- (7) Baron, E., Hauschildt, P. H., Branch, D., Wagner, R. M., Austin, S. J., Filippenko, A. V., & Matheson, T. 1993, ApJ, 416, L21
- (8) Bessell, M. S. 1999, PASP, 111, 1426
- (9) Bottinelli, L., Gouguenheim, L., Paturel, G., & Teerikorpi, P. 1986, A&A, 156, 157
- (10) Clocchiatti, A., Wheeler, J. C., Barker, E. S., Filippenko, A. V., Matheson, T., & Liebert, J. W. 1995, ApJ, 446, 167
- (11) Cohen, J. G., Darling, J., & Porter, A. 1995, AJ, 110, 308
- (12) Cohen, M. H. 1996, The LRIS Polarimeter (Keck Observatory instrument manual), available at http://www2.keck.hawaii.edu:3636/
- (13) Cousins, A. W. J. 1981, South African Astron. Obs. Circ., 6, 4
- (14) de Vaucouleurs, G. 1979, ApJ, 227, 729
- (15) Eastman, R. G., & Kirshner, R. P. 1989, ApJ, 347, 771
- (16) Eastman, R. G., & Pinto, P. A. 1993, ApJ, 412, 731
- (17) Eastman, R. G., Schmidt, B. P., & Kirshner, R. 1996, ApJ, 466, 911
- (18) Eggleton, P. P. 1971, MNRAS, 151, 351
- (19) Eggleton, P. P. 1972, MNRAS, 156, 361
- (20) Eggleton, P. P. 1973, MNRAS, 163, 279
- (21) Fabricant, D., Cheimets, P., Caldwell, N., & Geary, J. 1998, PASP, 110, 79
- (22) Filippenko, A. V. 1982, PASP, 94, 715
- (23) Filippenko, A. V. 1988, AJ, 96, 1941
- (24) Filippenko, A. V. 1993, IAU Circ., 5737
- (25) Filippenko, A. V. 1997, ARA&A, 35, 309
- (26) Filippenko, A. V., Barth, A. J., Bower, G. C., Ho, L. C., Stringfellow, G. S., Goodrich, R. W., & Porter, A. C. 1995, AJ, 110, 2261 (Erratum: 1996, 112, 806)
- (27) Filippenko, A. V., Li, W. D., Treffers, R. R., & Modjaz, M. 2001, in Small Telescope Astronomy on Global Scales, ed. W. P. Chen, C. Lemme, & B. Paczyński (San Francisco: ASP, Conf. Ser. Vol. 246), 121
- (28) Filippenko, A. V., Matheson, T., & Ho, L. C. 1993, ApJ, 415, L103
- (29) Filippenko, A. V., Porter, A. C., Sargent, W. L. W., & Schneider, D. P. 1986, AJ, 92, 1341
- (30) Freedman, W. L., et al. 2001, ApJ, 553, 47
- (31) Gibson, B. K. 2000, Mem. Soc. Astron. Ital., 71, 693
- (32) Giuricin, G., Marinoni, C., Ceriani, L., & Pisani, A. 2000, ApJ, 543, 178
- (33) Goodrich, R. W., Stringfellow, G. S., Penrod, G. D., & Filippenko, A. V. 1989, ApJ, 342, 958
- (34) Hamuy, M. 2001, Ph.D. Thesis, The University of Arizona
- (35) Hamuy, M., et al. 2001, ApJ, 558, 615
- (36) Hamuy, M. & Pinto, P. A. 2002, ApJ, 566, L63
- (37) Höflich, P. 1991, A&A, 246, 481
- (38) Horne, K. 1986, PASP, 98, 609
- (39) Johnson, H. L., Mitchell, R. I., Iriarte, B., & Wisniewski, W. Z. 1966, Commun. Lunar Plate. Lab., 4, 99
- (40) Kirshner, R. P., & Kwan, J. 1974, ApJ, 193, 27
- (41) Landolt, A. U. 1992, AJ, 104, 340
- (42) Lejuene, T., & Schaerer, D. 2001, A&A, 366, 538
- (43) Leonard, D. C., & Filippenko, A. V. 2001, PASP, 113, 920
- (44) Leonard, D. C., Filippenko, A. V., Ardila, D. R., & Brotherton, M. S. 2001, ApJ, 553, 861
- (45) Leonard, D. C., et al. 2002, PASP, 114, 35 (L02)
- (46) Massey, P., & Gronwall, C. 1990, ApJ, 358, 344
- (47) Matheson, T., Filippenko, A. V., Ho, L. C., Barth, A. J., & Leonard, D. C. 2000, AJ, 120, 1499
- (48) Meynet, G., Maeder, A., Schaller, G., Schaerer, D., & Charbonnel, C. 1994, A&AS, 103, 97
- (49) Miller, J. S., & Stone, R. P. S. 1993, Lick Obs. Tech. Rep., No. 66
- (50) Mitchell, R. C., Baron, E., Branch, D., Hauschildt, P. H., Nugent, P. E., Lundqvist, P., Blinnikov, S., & Pun, C. S. J. 2002, ApJ, in press (astro-ph/0204012)
- (51) Montes, M. J. & Wagoner, R. V. 1995, ApJ, 445, 828
- (52) Munari, U., & Zwitter, T. 1997, A&A, 318, 269
- (53) Nakano, S., et al. 1999, IAU Circ. No. 7329
- (54) Oke, J. B., et al. 1995, PASP, 107, 375
- (55) Oke, J. B., & Gunn J. E. 1983, ApJ, 266, 713
- (56) Pierce, M. J. 1994, ApJ, 430, 53
- (57) Press, W. H., Teukolsky, S. A., Vetterling, W. T., & Flannery, B. P. 1992, Numerical Recipes in C: The Art of Scientific Computing, 2nd ed. (Cambridge: Cambridge University Press)
- (58) Richmond, M. W., et al. 1995, AJ, 109, 2121
- (59) Ryder, S., Staveley-Smith, L., Dopita, M., Petre, R., Colbert, E., Malin, D., & Schlegel, R. 1993, ApJ, 416, 167
- (60) Sandage, A., & Tammann, G. 1990, ApJ, 365, 1
- (61) Savage, B. D., & Mathis, J. S. 1979, ARA&A, 17, 73
- (62) Schaller, G., Schaerer, D., Meynet, G., & Maeder, A. 1992, A&AS, 96, 269
- (63) Schlegel, D. J., Finkbeiner, D. P., & Davis, M. 1998, ApJ, 500, 525
- (64) Schmidt, B. P. 1993, Ph.D. Thesis, Harvard University
- (65) Schmidt, B. P., Kirshner, R. P., & Eastman, R. G. 1992, ApJ, 395, 366
- (66) Schmidt, B. P., et al. 1993, Nature, 364, 600
- (67) Smartt, S. J., Gilmore, G. F., Tout, C. A., & Hodgkin, S. T. 2002, ApJ, 565, 1089 (S02)
- (68) Smartt, S. J., Gilmore, G. F., Trentham, N., Tout, C. A., & Frayn, C. M. 2001, ApJ, 556, L29 (S01)
- (69) Stone, R. P. S. 1977, ApJ, 218, 767
- (70) Strauss, M. A., Huchra, J. P., Davis, M., Yahil, A., Fisher, K. B., & Tonry, J. 1992, ApJS, 83, 29
- (71) Trondal, O., Granslo, B. H., Kushida, R., Nakano, S., Yoshida, S., & Kadota, K. 1999, IAU Circ. No. 7334
- (72) Tully, B. 1988, Nearby Galaxies Catalog (Cambridge: Cambridge University Press)
- (73) Van Dyk, S. D., Filippenko, A. V., & Li, W. 2002, PASP, 114, 700
- (74) Van Dyk, S. D., Peng, C. Y., Barth, A. J., & Filippenko, A. V. 1999a, AJ, 118, 2331
- (75) Van Dyk, S. D., et al. 1999b, PASP, 111, 313
- (76) Wade, R. A., & Horne, K. 1988, ApJ, 324, 411
- (77) Walborn, N. R., Lasker, B. M., Laidler, V. G., & Chu, Y. H. 1987, ApJ, 321, L41
- (78) White, G. L., & Malin, D. F. 1987, Nature, 327, 36
- (79) Woosley, S. E., Pinto, P. A., Martin, P. G., & Weaver, T. A. 1987, ApJ, 318, 664
- (80) Woosley, S. E., & Weaver, T. A. 1986, ARA&A, 24, 205
- (81) Yadav, R. K. S., & Sagar, R. 2001, MNRAS, 328, 370
- (82) Zaritsky, D., Kennicutt, R. A., & Huchra, J. P. 1994, ApJ, 420, 87