address = Center for Astrophysical Thermonuclear Flashes, The University of Chicago, Chicago, IL 60637 ,altaddress = Department of Astronomy and Astrophysics, The University of Chicago, Chicago, IL 60637
Onset of Convection on a Pre-Runaway White Dwarf
Abstract
Observed novae abundances and explosion energies estimated from observations indicate that there must be significant mixing of the heavier material of the white dwarf (C+O) into the lighter accreted material (H+He). Accordingly, nova models must incorporate a mechanism that will dredge up the heavier white dwarf material, and fluid motions from an early convection phase is one proposed mechanism.
We present results from two-dimensional simulations of classical nova precursor models that demonstrate the beginning of a convective phase during the ‘simmering’ of a Nova precursor. We use a new hydrostatic equilibrium hydrodynamics module recently developed for the adaptive-mesh code FLASH. The two-dimensional models are based on the one-dimensional models of Ami GlasnerGlasner et al. (1997), and were evolved with FLASH from a pre-convective state to the onset of convection.
1 Introduction
As a classical nova precursor accretes material from its neighbor, it heats up; by the time its peak temperature becomes roughly – well before the final stages of runaway – the accreted atmosphere becomes convectively unstable. The resulting convective motions may be important for the process of dredging up white dwarf material into the accreted atmosphere.
In this paper, we examine the turn-on of convective motions in a white dwarf atmosphere based on one-dimensional early-time models provided to us by Ami Glasner. This initial model is the same used in other multidimensional studies Glasner et al. (1997); Kercek et al. (1998), but taken at an earlier time – at the last timestep before the onset of convection in the 1-d model code. We map this model into the multidimensional FLASH code Fryxell et al. (2000) using techniques developed in Zingale et al. (submitted), and perturb the models to investigate the onset of convective motions.
2 Simulations
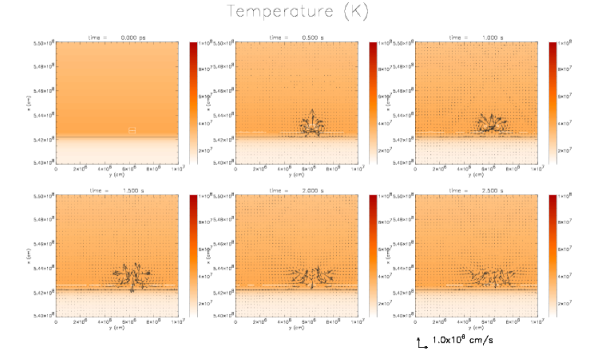
Figure 1 represents early convective motions in the atmosphere. The temperature in a region at the hottest (and least convectively unstable) point in the atmosphere is initially increased by 5%. Sound waves are emitted, and a convective roll begins. This is shown in Figure 1, through approximately one rollover time, at times after the perturbation is imposed. Note that the velocity field extends to the C+O interface.
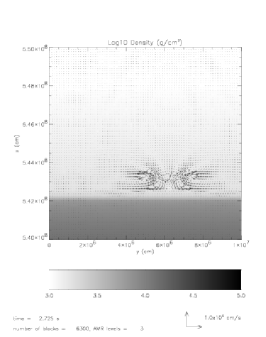
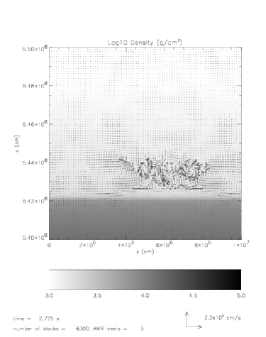
The dynamics of the rolls depend on the initial amplitude of the perturbation. Shown in Figure 2 are the motions in the atmosphere at time with temperature perturbations of 2%, 5%, and 10%, respectively. The velocity vectors in the plots are scaled so that the kinetic energy of the motions are scaled to the thermal energy of the perturbation; note that the sound waves have very similar amplitudes in these plots. Even with these scalings, the 10% perturbation generates considerably more motion.
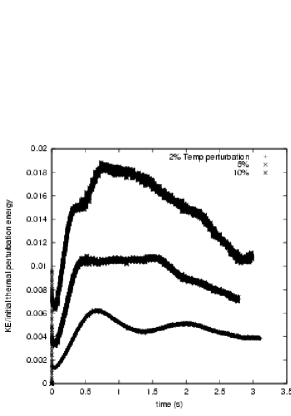
We can quantitatively see the effects of perturbation size on convective motions above. Shown, in Figure 3 are the kinetic energy as a fraction of the initial thermal energy perturbation, and the average of the interfacial shear velocities over the course of the simulation. Larger perturbations produce motions at the interface much more efficiently.


3 Direction of Future Work
Using what we are learning about shear and gravity-wave driven mixing Calder et al. (2002), we can hope to model the unresolved mixing due to the interfacial shear generated by these motions. Shown in Figure 4 is a logarithmic plot of metallicity in the atmosphere at time , where the only source of C+O in the simulation is modelled mixing driven by the velocities at the interface between the white dwarf and the atmosphere. The sub-grid model we have used here is preliminary, based on early results of observed mixing fluxes in small-scale simulations run by A. Alexakis and A. C. Calder described in this volume. As our understanding of the convective motions and the shear-driven mixing improves, we hope to see if this provides a robust dredge-up mechanism. We will incorporate our improved subgrid model into both one-dimensional and multi-dimensinoal simulations, and test our model results with respect to the typical observed levels of enrichment of nova envelopes.

Acknowledgments
This work is supported in part by the U.S. Department of Energy under Grant No. B341495 to the Center for Astrophysical Thermonuclear Flashes at the University of Chicago. LJD is supported by the Krell Institute CSGF. K. Olson acknowledges partial support from NASA grant NAS5-28524. We greatfully acknowledge Ami Glasner for the initial model on which these calculations were based.
References
- Glasner et al. (1997) Glasner, A. S., Livne, E., and Truran, J. W., ApJ, 475 (1997).
- Kercek et al. (1998) Kercek, A., Hillebrandt, A., and Truran, J. W., AAP, 337 (1998).
- Fryxell et al. (2000) Fryxell, B., Olson, K., Ricker, P., Timmes, F. X., Zingale, M., Lamb, D. Q., MacNeice, P., Rosner, R., Truran, J. W., and Tufo, H., ApJS, 131, 273–334 (2000).
- Zingale et al. (submitted) Zingale, M., Dursi, L. J., ZuHone, J., Caceres, A., Calder, A. C., Fryxell, B., Olson, K., Plewa, T., Ricker, P. M., Riley, K., Rosner, R., Siegel, A., Timmes, F. X., Truran, J. W., and Vladimirova, N., ApJ (submitted).
- Calder et al. (2002) Calder, A., Alexakis, A., Dursi, L., Rosner, R., Truran, J., Fryxell, B., Ricker, P., Zingale, M., Olson, K., Timmes, F., and MacNeice, P., “Mixing by Non-linear Gravity Wave Breaking on a White Dwarf Surface,” in Proceedings of the International Conference on Classical Nova Excplosions, edited by M. Hernanz, AIP, 2002.