PROPOSED GRAVITATIONAL WAVE BACKGROUND FROM BLACK HOLE–TORUS SYSTEMS
Abstract
Cosmological gamma-ray bursts may be powered by rotating black holes with contemporaneous emission of gravitational radiation from a surrounding torus. We calculate the resulting stochastic background radiation assuming strong cosmological evolution and a uniform black hole mass distribution of (4–14)M⊙. The predicted spectral flux density corresponds to a peak spectral closure density of (1–2, and has comparable contributions at 450 Hz and over 300–450 Hz from nearby and distant sources, respectively, where refers to an uncertainty factor of order unity in the radius of the torus. For two optimized advanced LIGO-type detectors the proposed gravitational wave background could be detectable within a year of integration.
1 INTRODUCTION
Cosmological gamma-ray bursts are the most enigmatic transient events in the Universe. They show a bi-modal distribution in durations of short bursts around 0.3 s and long bursts around 30 s (Kouveliotou et al., 1993). Based on their GRB fluence and time-variability, their inner engines should be compact and highly energetic. Leading candidates for GRB progenitors are collapsars and mergers of black holes and neutron stars. In particular, long bursts have been associated with core collapse of massive stars (Woosely, 1993; Macfayden & Woosley, 1999), or their hypernova variants, in star-forming regions (Paczyński, 1998; Brown et al., 2000). These, and mergers of compact binaries, are believed to result in black hole plus disk or torus systems — see van Putten (2001) for a review.
A torus around a rapidly rotating black hole converts spin energy into various channels, notably gravitational and thermal radiation, winds and MeV neutrino emissions (van Putten & Levinson, 2002). These emissions last for the life-time of rapid spin of the black hole – the de-redshifted durations of tens of seconds for long bursts from black hole-torus systems in suspended accretion (van Putten & Ostriker, 2001). The single-source spectrum is here described by a horizontal branch in the diagram (van Putten & Sarkar, 2000) within a frequency range in the vicinity of 1 kHz for a 7-M⊙ black hole. GRB energies appear to have a diversity of about one order of magnitude (Frail, 2001; Piran et al., 2001). Black hole-torus systems are expected to have a distribution in black hole mass consistent with the recently proposed association with soft X-ray transients in the hypernova proposal of Brown et al. (2000); i.e., (4–14)M⊙.
In this work, we calculate the gravitational wave (GW) spectra expected from a cosmological distribution of black hole-torus systems, assuming strong cosmological evolution locked to the star-formation rate (SFR). We shall estimate the expected contribution to the stochastic background in GWs from the low- and high-redshift populations. Following Schmidt (2001) and Frail (2001), the total event rate is normalized to a local GRB rate of 0.5 yr-1 Gpc-3 at , assuming a “flat-” cosmology.
2 THE EVOLVING GRB RATE
The SFR can be parametrized according to the model SF2 of Porciani & Madau (2001), wherein the density rises rapidly by an order of magnitude between and , peaks between and 2 and declines gently at higher redshifts:
| (1) |
with denoting the Hubble constant normalized to 65 km s-1 Mpc-1. This model was derived using the Einstein–de Sitter cosmology, so a scaling factor has to be applied for other cosmologies (Porciani & Madau, 2001). We define a dimensionless evolution factor as / and assume a cutoff for star formation at = 5, because active star formation is believed to have begun at that epoch. The variation of the rate of GRB sources with redshift can be expressed by the event-rate equation
| (2) |
where is their present-epoch rate density and is the all-sky event rate, as observed in our local frame, for sources out to redshift . The factor has the dimensions of inverse time, as does the event rate . The denominator in (2) accounts for the time dilation of the observed rate by cosmic expansion, converting a source-count equation to an event-rate equation. The dimensionless function is determined by the cosmological model and can be calculated from the Hubble parameter and the angular size distance (Peebles, 1993, p. 332).
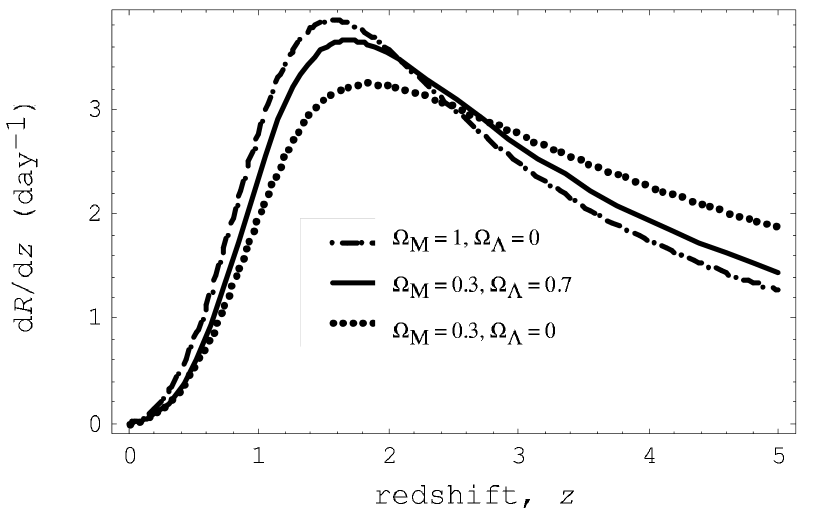
Fig. 1 plots the resulting GRB rate evolution for three standard cosmologies: () (1, 0), (0.3, 0.7) and (0.3, 0), all with , using local GRB rate densities of 0.9, 0.5 and 0.6 yr-1 Gpc-3 respectively; the differing local rate densities reflect the different spatial geometries in the three cosmologies. The steep rise at low reflects a combined increase in sky surface area and star-formation rate. Recent observation-based analysis of GRB jet opening angles indicates a beaming factor of about 500 (Frail, 2001; Piran et al., 2001). This factor increases the above-stated local rates, whereby the corresponding cumulative all-sky rate becomes a few per minute (several thousand per day) after integration of equation (2) out to . We adopt a present-epoch GRB rate density of 250 yr-1 Gpc-3 in the flat- cosmology with .
3 SINGLE-SOURCE SPECTRA: A GENTLE CHIRP
The single-source spectrum of gravitational waves of a black hole-torus system is modeled by the emission of a fraction of about ten percent of the rotational energy of a rapidly spinning black hole (van Putten & Levinson, 2002). These emissions correspond to mass inhomogeneities in the torus on the order of a few permille of the black hole mass, which have recently been identified as Papaloizou-Pringle buckling modes (van Putten, 2002). The lowest frequency emission relevant to the current laser-interferometric gravitational wave experiments is produced by a quadrupole moment of the torus. This frequency equals twice the Keplerian angular velocity of the torus, in this paper normalized to kHz for a 7-M⊙ black hole. A spread as well as a systematic uncertainty presently exists in the radius of the torus, and hence in the expected frequency of gravitational radiation. Because most of the rotational energy is concentrated at high spin-rate, the frequency evolves according to an approximately linear chirp—i.e., a “gentle chirp” in the form of a quasi-periodic oscillation with a bandwidth of about 10% within the de-redshifted duration of mean value 20 s. This is a horizontal branch in the diagram (van Putten & Sarkar, 2000):
| (3) |
for an initial frequency and an approximately constant time rate of change . The sign of is not predicted by the model. In what follows, is assumed; the final results are not expected to change qualitatively for the opposite choice of sign in the frequency sweep.
A scaling for the chirp with the black hole mass obtains, assuming a constant ratio of the kinetic energy to poloidal magnetic energy in the torus (van Putten & Ostriker, 2001). This energy ratio is a major uncertain parameter in accretion disk physics. It holds constant if a disk dynamo process operates which establishes an equilibrium with the driving kinetic energy in response to the powerful competing torques acting on the inner and outer faces of the torus, with no memory of initial conditions. The inner face of the torus receives most of the black hole luminosity for a net energy in the magnetic field, by equivalence in poloidal topology to pulsar magnetospheres (van Putten, 1999). As the rotational energy of a rapidly rotating black hole is proportional to its mass, its life-time of rapid spin prolongs in proportion to , assuming the torus radius to scale linearly with . In the present context, it would be sufficient for this scaling to hold as an ensemble average. This condition is equivalent to the assumption of constant fractions of magnetic flux connected to the horizon of the black hole and in winds to infinity.
The energy in gravitational radiation consists of the above-mentioned fraction of the spin-energy of the black hole, and is proportional to the ratio of torus-to-black hole angular velocities. At constant ratio of the torus radius to the hole mass , the energy output in gravitational radiation is proportional to the latter; this gives
| (4) |
where 1 kHz for a 7-M⊙ black hole and , with durations consistent with the de-redshifted mean duration of long GRB events of about 20 s. The frequency may vary over the life-time of rapid spin of the black hole, by an amount which could reach about 10%. In what follows, a frequency sweep of about 100 Hz is assumed, so Hz s-1, for M⊙.
The single-source spectral time-integrated flux density (or “spectral fluence”), in J m-2 Hz-1, of a quadrupole GW signal at a luminosity distance is expressed as (Ferrari, Matarrese, & Schneider, 1999a, b; Coward, Burman, & Blair, 2001)
| (5) |
Here , which is in m/Hz, is the Fourier transform of the wave amplitude (in meters) at the observed frequency , which is related to the source frequency by the redshift factor: . The factor has dimensions masstime, equivalent to energy/(area frequency).
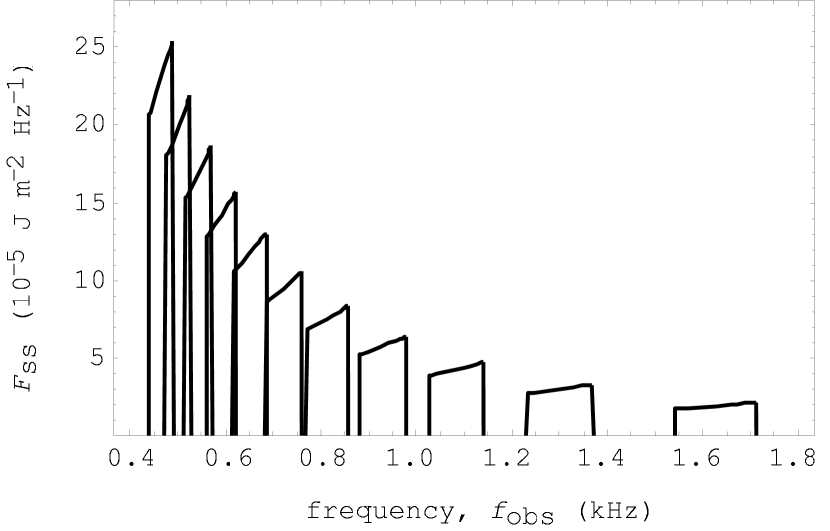
Fig. 2 illustrates the spectral fluence for a selection of black hole masses ranging from 14M⊙ to 4M⊙ in steps of 1M⊙, for negative at a source distance of 100 Mpc ; via (4), the corresponding range over 0.5–1.75 kHz with ranging over 0.625–27 Hz s-1; the bandwidth has been taken to be 10% of in each case, ranging over 175–50 Hz. The figure depicts the decrease of both and , and also the steepening of the spectrum, with increasing .
The scaling of the burst duration follows from (4):
| (6) |
ranging over 44–3.6 s for 14–4)M⊙; we have chosen s for 7M⊙, so that averages to 20 s over the uniform distribution of . The scaling of , the total number of cycles comprising the burst, also follows from (4): for a 10% frequency sweep
| (7) |
with for M⊙.
A single-source dimensionless characteristic amplitude is expressed by (Flanagan & Hughes, 1998)
| (8) |
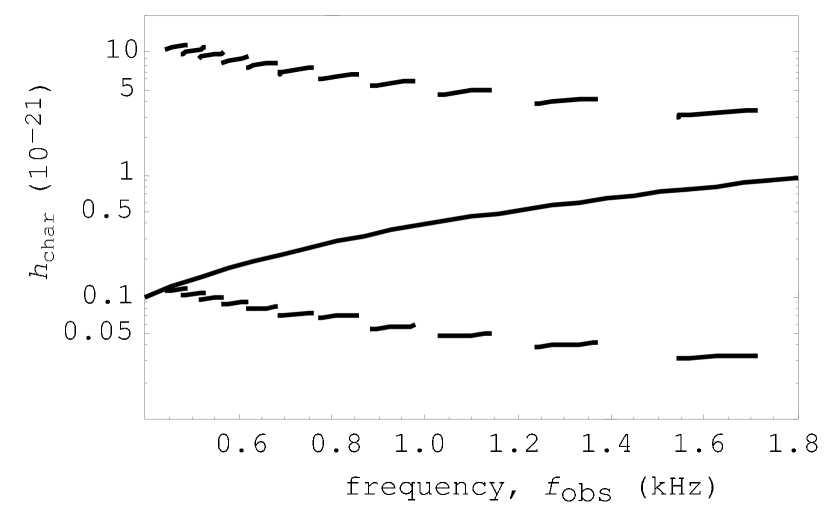
where is the energy spectrum, representing the distribution of GW energy per unit of observed frequency at luminosity distance . Fig. 3 shows for the same sources as in Fig. 2, at the same distance. The top curve assumes optimal matched filtering over the duration of the emission. The bottom curve is for a single cycle of the above emission. Matched filtering will increase the signal-to-noise ratio by a factor . Fig. 3 shows, for example, that the dimensionless strain amplitude of a single burst event is expressed by for M⊙ with 980–880 Hz; for an 11-s emission at a mean frequency of 950 Hz, for a single cycle. For comparison with these predictions, a model for the root-mean-square dimensionless noise amplitude of an advanced LIGO detector (Flanagan & Hughes, 1998) is included in the figure.
4 GW BACKGROUND SPECTRA
The stochastic background produced by the proposed radiation from black hole-torus systems may be expressed by their spectral flux density, in W m-2 Hz-1. The contribution from these sources throughout the Universe obtains by integrating the product over the redshift range to 5:
| (9) |
with and given by (7) and (2). The background spectral strain, in Hz-1/2, is calculated directly from this background spectral flux density (Ferrari et al. 1999a,b):
| (10) |
The spectral energy density of a GW background is conventionally expressed by the dimensionless spectral “closure density”, defined as the energy density of gravitational waves per logarithmic frequency interval normalized to the cosmological critical density . It can be obtained from the background spectral flux density (Ferrari et al. 1999a,b) as
| (11) |
The duty cycle () from events out to redshift is given by
| (12) |
where the typical duration, , of the signal is dilated to by the cosmic expansion. A calculated of unity or greater implies that the signal is continuous. If , then the central limit theorem tells us that the amplitude distribution can be approximated as a Gaussian. If the calculated , then the amplitude distribution can be simulated (Coward et al. 2002a,b) from a random sampling of the probability distribution based on the event rate equation (2).
5 NUMERICAL RESULTS
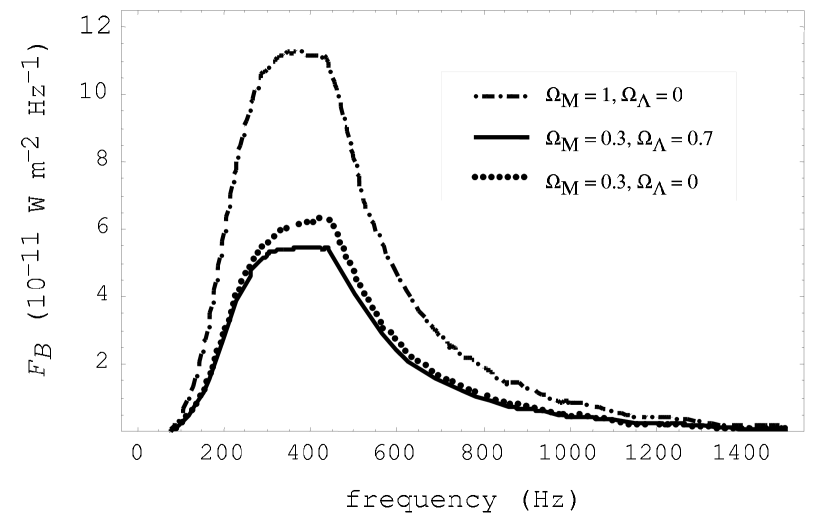
The stochastic background produced by systems with a uniform black hole mass distribution (4–14)M⊙ for three standard cosmologies, expressed in spectral flux density, is shown in Fig. 4. For the flat- cosmology, it exhibits a broad plateau of W m-2 Hz-1 at about 300–450 Hz. At 300 Hz, the main contributions are from cosmologically distant sources at about 0.6–1. The edge at 450 Hz represents contributions from more local sources and is strongly dependent on the single-source fluence. For the EdS cosmology, the plateau is similar in bandwidth but scaled up to W m-2 Hz-1. The open cosmology shows a noticeable peak corresponding to contributions from local higher-mass black holes.
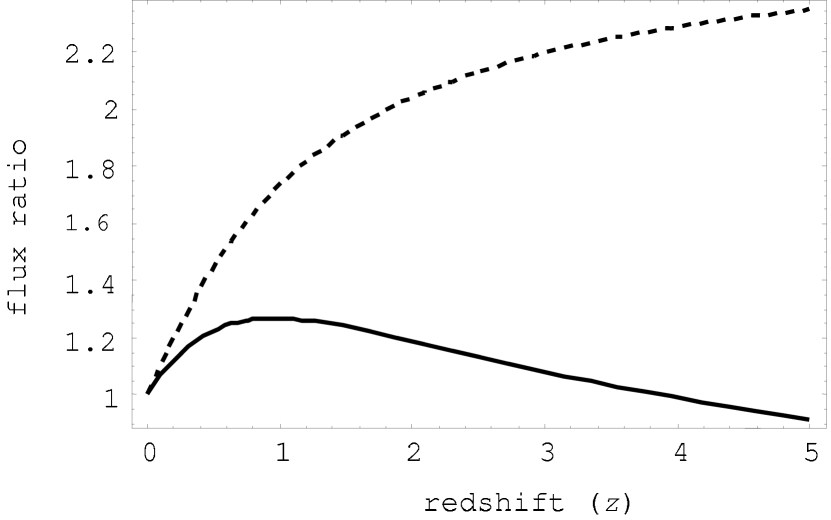
The variation in spectral flux density among the flat-, EdS and open cosmologies can be attributed to the cosmology dependence of the luminosity distance. Fig. 5 plots the ratio of inverse luminosity distance squared for the open and EdS to flat- cosmologies. It shows a maximum of 1.25 at for the open to flat- case, consistent with the ratio of the spectral flux density in Fig. 4 for these cosmologies. For the EdS to flat- case, the ratio in Fig. 5 increases steadily to 2.35 at , which is consistent with the ratio of the plateau heights in Fig. 4 for these cosmologies.
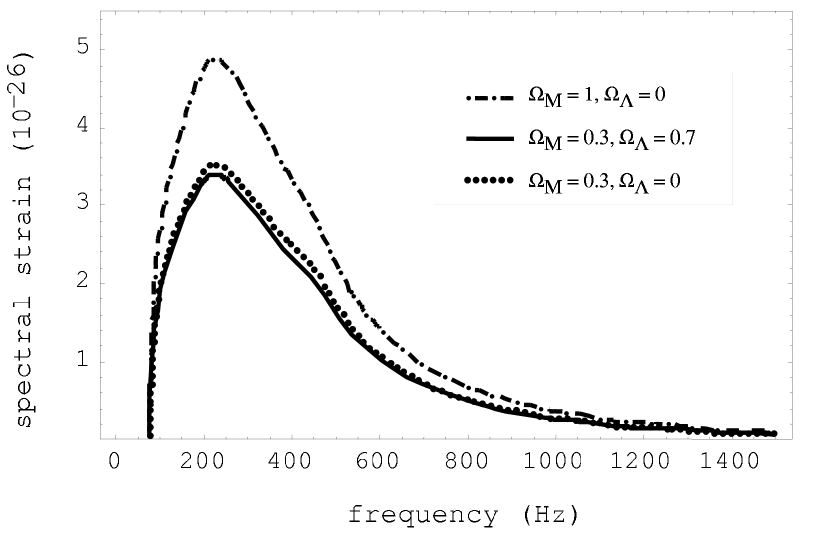
The spectral strain, shown in Fig. 6 for the same cosmologies, exhibits a maximum of (3–5 Hz-1/2 at about 200–250 Hz, and a steep rise at a frequency of about 100 Hz caused by the cutoff at = 5 of the SFR. The SFR may in fact decrease smoothly beyond a redshift of about 5, hence moderating this rather non-physical feature in the spectral strain. Incorporating higher- sources is not expected to affect our results significantly, as sources are likely to be fewer in number than sources at = 1–2 (see Fig. 1) and the increasing luminosity distance of high- sources means that their contribution to the background flux density becomes less significant. The tails at frequencies above 500 Hz in Figs. 4 and 6 represent the contributions from low-mass black holes; evidently, the spectra are dominated by high-mass black holes.
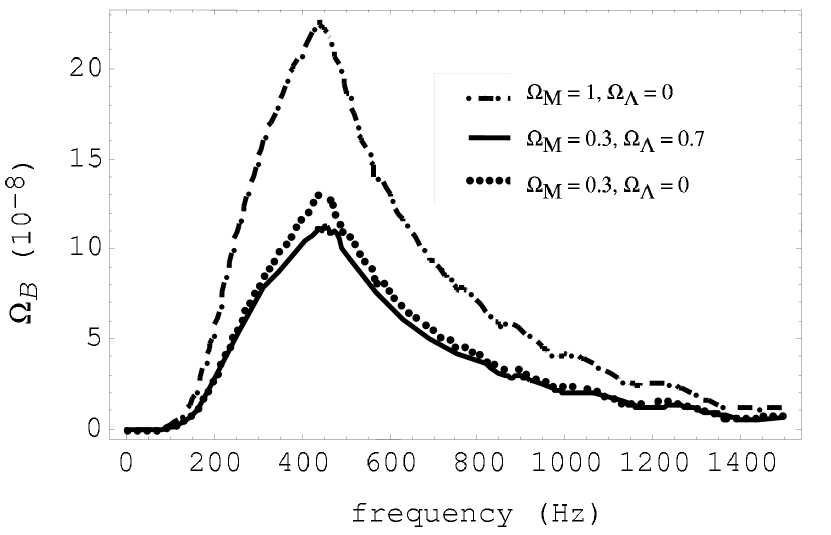
The spectral closure density of this background radiation, shown in Fig. 7, has a sharp maximum of (1–2 at about 450 Hz for the same cosmologies. The broad hump around 300 Hz, visible in the curve for the flat- cosmology, and the sharp peak at about 450 Hz are representative of cosmological and local sources respectively.
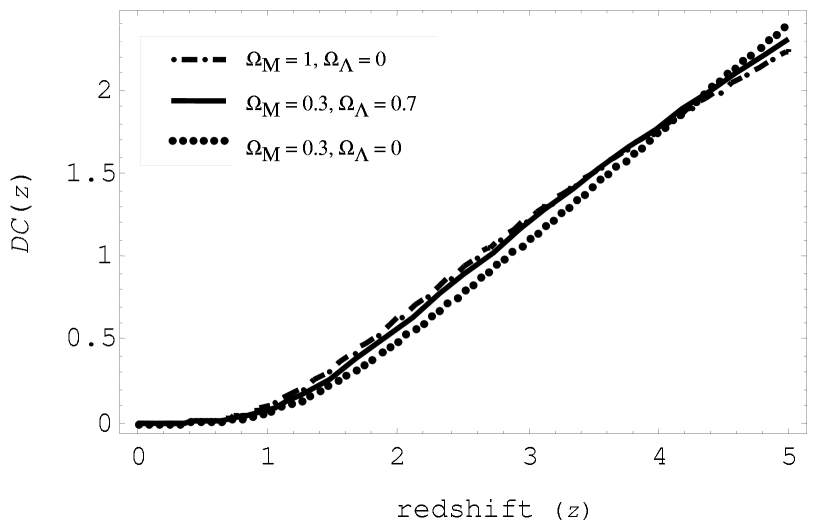
The duty cycle of the burst events throughout the Universe reaches about 2, upon integration of (12) up to . Fig. 8 plots , exhibiting very little variation in form among the three cosmologies. The rate estimate 250 yr-1 Gpc-3 at via Schmidt (2001) and Frail (2001) translates to a net GRB event rate throughout the Universe of a few per minute, as seen in our frame. This signal is comprised of discrete pulses, originating largely from sources at redshifts of 1–3. Since these pulses last typically about 40–80 s (in our frame), they overlap and produce a near-continuous background, to within the approximations made in our treatment.
6 Detectability
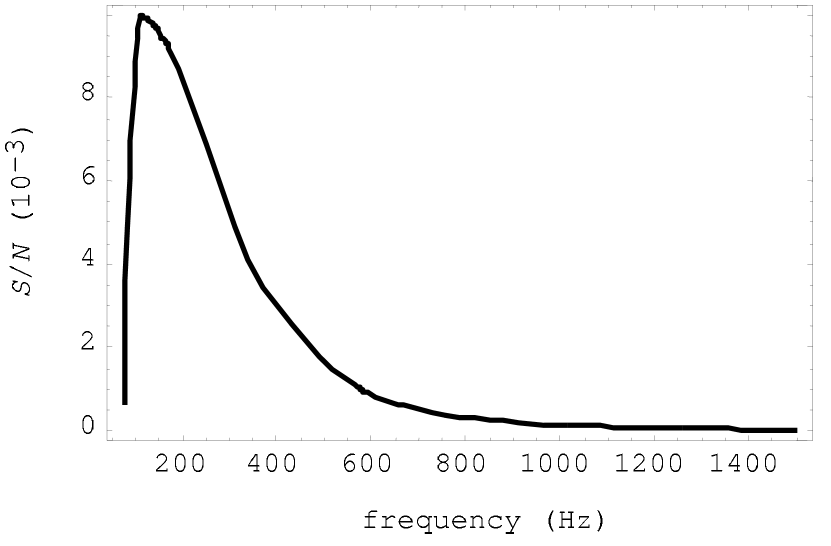
A stochastic background will manifest itself in a single detector as excess noise. The signal from the proposed GRB GW background is expected to be far below the noise level in any single planned ground-based detector. The signal-to-noise ratio in terms of amplitude for either an interferometer or resonant-mass detector is (Maggiore, 2000):
| (13) |
here, is a pattern function, which is a measure of the angular efficiency of the detector, is the signal power spectral density (density in frequency space) and is the noise power spectral density, both in units of Hz-1. Fig. 9 is a plot of the of the proposed background as a function of frequency, using calculated from the flat- spectral strain shown in Fig. 6 and a model for the noise power spectrum an “advanced LIGO” type interferometer (Flanagan & Hughes 1998). The is small, with a sharp maximum of near 100 Hz; the rapid fall to the left of this is due mainly to the absence of signal below about 100 Hz.
The most promising detection strategy is that of cross-correlation of the output of two neighboring detectors, as recently reviewed by Allen & Romano (1999) and Maggiore (2000). For the signals in them to be correlated, the detectors must be separated by less than one reduced wavelength, which is about 100 km for frequencies around 500 Hz where we expect the GRB-generated background to peak. The detectors also need to be sufficiently well separated that their noise sources are largely uncorrelated.
Under these conditions, assuming Gaussian noise in each detector and optimal filtering, a filter function chosen to maximize for two such detectors yields the formula (Allen & Romano, 1999, Eq. 3.75):
| (14) |
Here, is an “overlap reduction function”, which accounts for the separation and relative orientation of the detectors, and and are the noise power spectral densities of the detectors. As the optimal filter depends on , a range of filter functions based on theoretical expectations of this function will need to be used.
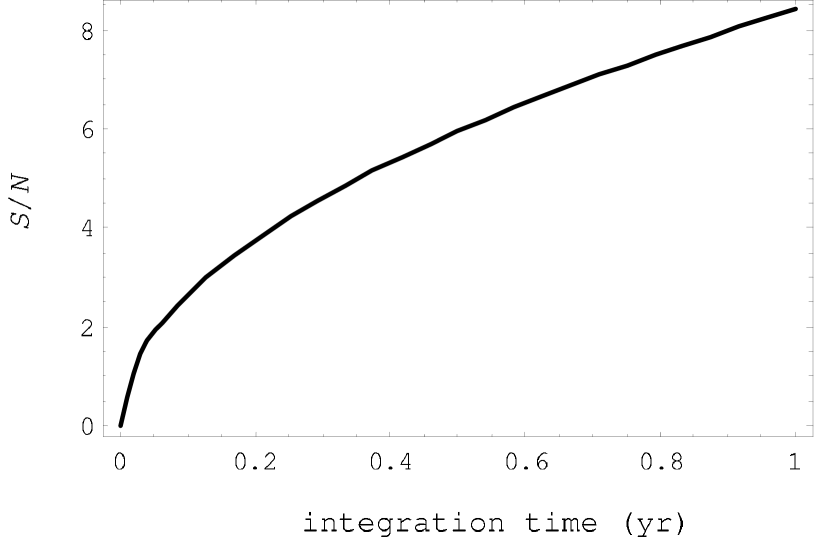
For this preliminary study of the detectability of the GRB-generated background, we assume an optimized value of close to unity for of two detectors situated within several kilometres. We take the flat- as shown in Fig. 7 and use a piecewise parametrized model for and for proposed advanced LIGO detectors (Flanagan & Hughes 1998), assuming a pair of similar detectors. Fig. 10 plots the resulting as a function of integration time, yielding a value of about 8 for 1 yr of integration. This preliminary result suggests that the proposed GRB GW background is potentially detectable given optimized cross-correlation between two advanced LIGO detectors.
We also note that given the uncertainty in the sign of in the single-source emission model, the peak flux may occur at higher frequencies. If so then the the GRB GW background may be detectable using cross-correlation with a resonant-mass interferometer detector pair. The LIGO-WA interferometer and ALLEGRO resonant-mass detector pair, when co-aligned, yield a value for close to unity across the bandwidth 1–1000 Hz (Whelan et al., 2002). Unfortunately this bandwidth is not fully utilized in the ratio of GW power to noise power appearing in the integral in Eq. (14), because ALLEGRO, as a resonant-mass detector, has a narrow bandwidth, centered on a resonant frequency of about 900 Hz in this case.
7 DISCUSSION
We draw several conclusions:
1. Black hole-torus systems associated with GRBs are expected to give a substantial contribution to the stochastic GW background in a frequency window of 300-450 Hz, where denotes an uncertainty factor of order unity in the radius of the torus. If black hole-torus systems exist also as transient sources independent of GRBs, their event rate will be higher with a commensurably more pronounced stochastic GW background.
2. It is instructive to compare the presented results with radiation from rapidly rotating neutron stars. Black hole-torus systems produce spectral flux densities which are similar to the contribution from r-mode instabilities as described in Ferrari et al. (1999b). Here, the large output provided by the spin-energy of the black hole compensates for an event rate which is less than the formation rate of neutron stars by some three orders of magnitude. The frequencies and of the former are markedly higher, respectively, lower than those predicted for radiation from neutron star modes, however. The of the signals from neutron star r-modes may be as high as (Ferrari et al. 1999b) in contrast to our estimate of order unity for the signals from GRB sources. This comparision becomes more favorable with recent understanding of r-modes in more detailed and realistic scenarios. The r-modes are driven by a generally weak gravitational radiation-reaction force and, in the perturbative limit, effectively decoupled from other modes (Schenk et al., 2002). A recent appreciation of various channels for creating viscosity (Owen & Lindblom, 2002; Rezolla et al., 2001; Wu et al., 2001) renders their saturation energies small, and less so than previously thought (Arras et al., 2002).
3. The high output in gravitational radiation powered by the spin-energy of the black hole gives rise to a major contribution to the predicted GW background by a relatively nearby population of sources. This is apparent in the edge at 450 Hz in Fig. 4 to the 300–450 Hz flat- spectral flux density plateau due to sources at higher redshifts. The comparable contributions by the nearby and distant sources is a robust result, depending only on the assumption that the proposed black hole-torus systems are tightly locked to the SFR.
4. As the local GRB rate (assumed in this work) is about 1 yr-1 within a radius of 100 Mpc, the average background spectral flux density should be representative of sources from 0.02–5 for an observation time of one year. One can view the background spectral flux density shown in Fig. 4 as the result of averaging the flux from a discrete number distribution over an infinite observation time. We plan to investigate these issues further in connection with the detectability of this predicted background using advanced LIGO-type detectors.
5. The estimated frequency range of about 200–2000 Hz of the proposed background and foreground radiation in gravitational waves from black hole-torus systems in association with GRBs defines a new source with a well-defined event rate in the high-frequency bandwidth of LIGO/VIRGO detectors as well as for some of the current bar detectors. Cross-correlating the output between pairs of detectors promises to be the optimum detection strategy. For an idealized advanced LIGO pair of detectors, the could be high enough for detection of the proposed background in a year of integration. Using present detector technology and locations, the optimum detector pair combination may be a resonant-mass and interferometric detector, such as the LIGO-WA and ALLEGRO pair.
References
- Allen & Romano (1999) Allen, B., & Romano, J. 1999, Phys. Rev. D., 59, 2001
- Arras et al. (2002) Arras et al., 2002, astro-ph/0202345
- Brown et al. (2000) Brown, G. E., Lee, C-H., Wijers, R. A. M. J., Lee, H. K., Isralean, G., & Bethe, H. A. 2000, New Astron, 5, 191
- Coward, Burman, & Blair (2001) Coward, D. M., Burman, R. R., & Blair, D.G. 2001, MNRAS, 324, 1015
- Coward, Burman, & Blair (2002a) Coward, D. M., Burman, R. R., & Blair, D. G. 2002a, MNRAS, 329, 411
- Coward, Burman, & Blair (2002b) Coward, D. M., Burman, R. R., & Blair, D. G. 2002b, Class. Quantum Grav., 19, 1303
- Ferrari, Matarrese, & Schneider (1999a) Ferrari, V., Matarrese, S., & Schneider, R. 1999a, MNRAS, 303, 247
- Ferrari, Matarrese, & Schneider (1999b) Ferrari, V., Matarrese, S., & Schneider, R. 1999b, MNRAS, 303, 258
- Flanagan & Hughes (1998) Flanagan, E., & Hughes S. A. 1998, Phys. Rev. D, 57, 4535
- Frail (2001) Frail, D. A. et al. 2001, ApJ 562, L55
- Kouveliotou et al. (1993) Kouveliotou, C., Meegan, C. A., Fishman, G. J., Bhat, N. P., Briggs, M. S., Koshut, T. M., Paciesas, W. S., & Pendleton, G. N. 1993, ApJ 413, L101
- Macfayden & Woosley (1999) Macfayden, A. I., & Woosley, S. E. 1999, Astron. Astrophys., 524, 262
- Maggiore (2000) Maggiore, M. 2000, Phys. Rep. (Physics Letters C), 331, 284
- Owen & Lindblom (2002) Owen & Lindblom, 2002, Phys. Rev. D, 65, 063006
- Paczyński (1998) Paczyński, B. P. 1998, ApJ, 494, L45
- Peebles (1993) Peebles, P. J. E. 1993, Principles of Physical Cosmology, Princeton U. P.
- Piran et al. (2001) Piran, T., Kumar, P., Panaitescu, A., & Piro, L. 2001, ApJ, 560, L167
- Porciani & Madau (2001) Porciani, C., & Madau, P. 2001, ApJ, 548, 522
- Schmidt (2001) Schmidt, M. 2001, ApJ, 552, 36
- Schenk et al. (2002) Schenk et al., 2002, Phys. Rev. D, 65, 024001
- Rezolla et al. (2001) Rezolla et al., 2001, Phys. Rev. D., 64, 104013; ibid., 2001, Phys. Rev. D, 64, 104014
- van Putten (1999) van Putten, M. H. P. M. 1999, Science 284, 115
- van Putten (2001) van Putten, M. H. P. M. 2001, Phys. Rep., 345, 12001
- van Putten & Levinson (2002) van Putten, M. H. P. M., & Levinson A. 2002, Science, 295, 1874. Published online 21 February 2002; 10.1126/science.1068634
- van Putten & Ostriker (2001) van Putten, M. H. P. M., & Ostriker, E. C. 2001, ApJ, 552, L31
- van Putten & Sarkar (2000) van Putten, M. H. P. M., & Sarkar, A. 2000, Phys. Rev. D., 62, R041502
- van Putten (2002) van Putten, M.H.P.M., 2002, ApJ(Lett), 575, in press
- Whelan et al. (2002) Whelan, J. T., et al. 2002, Class. Quantum Grav., 19, 1521
- Woosely (1993) Woosley, S. E. 1993, ApJ, 405, 273
- Wu et al. (2001) Wu et al., 2001, ApJ, 549, 1011