Two massive star forming regions at early evolutionary stages
Abstract
We report sensitive ATCA radio continuum observations toward IRAS 155965301 and 162724837, two luminous objects () thought to represent massive star forming regions in early stages of evolution (due to previously undetected radio emission at the 1 level of 2 mJy per beam). Also reported are 1.2 millimeter continuum and a series of molecular line observations made with the SEST telescope.
The radio continuum observations toward IRAS 155965301 reveal the presence of three distinct compact sources, with angular sizes of 2.7″ to 8.8″ (FWHM), all located within a region of 30″ in diameter. Assuming that these are regions of ionized gas, we find that they have diameters of 0.06-0.2 pc, electron densities of cm-3, and that they are excited by early B type stars. The 1.2-mm observations show that the dust emission arises from a region of (FWHM) with a total flux of 5.8 Jy, implying a mass of . The line observations indicate that IRAS 155965301 is associated with a molecular cloud with a FWHM angular size of 37″ ( pc radius at the distance of 4.6 kpc), a molecular hydrogen density of cm-3 and a rotational temperature of K. We suggest that the massive dense core associated with IRAS 155965301 contains a cluster of B stars which are exciting compact H II regions that are in pressure equilibrium with the dense molecular surroundings.
No radio continuum emission was detected from IRAS 162724837 up to a limit of 0.2 mJy. However, the 1.2-mm observations show strong dust emission arising from a region of (FWHM) with a total flux of 13.8 Jy, implying a mass of . The line observations indicate the presence of an elongated molecular cloud with FWHM major and minor axes of 61″ and 42″( pc in radius at the distance of 3.4 kpc), a molecular hydrogen density of cm-3 and a rotational temperature of K. The high luminosity () and lack of radio emission from this massive core suggest that it hosts an embedded young massive protostar that is still undergoing an intense accretion phase. This scenario is supported by the observed characteristics of the line profiles and the presence of a bipolar outflow detected from observations of the SiO emission. We suggest that IRAS 162724837 is a bona-fide massive star forming region in a very early evolutionary stage, being the precursor of an ultra compact H II region.
1 Introduction
The earliest phase of high-mass star formation is possibly one of the least understood stage of evolution of massive stars. Massive stars (M ) are known to be formed in dense molecular cores, however the sequence of processes leading to their formation is not yet well established. In particular, the role of coalescence (Stahler et al. 2000) and accretion (Osorio, Lizano, & D’Alessio 2000) processes in the assembling of a massive star is still under debate. The determination of the physical conditions of the gas during the formation and early evolution of a massive star is difficult because of their scarcity and rapid evolution. In addition, massive stars are usually born in clusters or groups hence their individual studies are usually afflicted by confusion, particularly because they are found located, on the average, at larger distances from the Sun than sites of low-mass star formation. Massive objects in early evolutionary stages, namely in the process of assembling the bulk of their final mass, should be identified by having high bolometric luminosities (), strong dust emission, and very weak or no detectable free-free emission at cm radio wavelengths. The bolometric luminosity has contributions from the accretion of infalling material and nuclear burning. Up to date only a few systematic searches for high mass protostellar objects have been carried out (Molinari et al. 1996, 1998, 2000; Sridharan et al. 2002).
We have recently started a multi-wavelength study of a sample of 18 luminous IRAS sources in the southern hemisphere thought to be representative of young massive star forming regions (Mardones, Garay, & Bronfman 2002). The goal is to understand the physical and chemical differences between different stages of early evolution. The objects were taken from the Galaxy-wide survey of CS(21) emission towards IRAS sources with IR colors typical of compact H II regions (Bronfman, Nyman, & May 1996). We selected sources based primarily on the observed CS(21) line profiles; looking for self-absorbed lines consistent with inward or outward motions (e.g., Mardones 1998), and/or with extended line wings, possibly indicating the presence of bipolar outflows. In addition, the sources were required to have IRAS 100m fluxes greater than Jy and to be in the southern hemisphere (). The luminosity of the IRAS sources, computed using the IRAS energy distribution and the distances derived by Bronfman (2002) are in the range , implying that they contain at least an embedded massive star.
Most of the selected objects are expected to be associated with ultra compact (UC) H II regions which are thought to be manifestations of newly formed massive stars that are still embedded in their natal molecular cloud. This expectation is confirmed by the radio continuum observations of Walsh et al. (1998) which show that 9 of the 12 sources in both samples have detectable radio continuum emission (above a limit of 6 mJy/beam at 8.64 GHz with angular resolution of 1.5″). The objects that were not detected at radio wavelengths are suitable candidates for massive stars in very early stages of evolution in which dense material is still falling toward a massive OB-type protostar. In this accretion phase, the high-mass accretion rate of the infalling material quenches the development of an UC H II region (Yorke 1984; Walmsley 1995), and the free-free emission from the ionized material is undetectable at centimeter wavelengths. The mass accretion rate might also be large enough that the ram pressure of the infalling gas could provide the force to prevent the expansion of an H II region. We note, however, that due to the limited sensitivity of the Walsh et al. (1998) survey, low-density H II regions with emission measures smaller than pc cm-6 were not detectable. Hence, the lack of detection at the above limit does not rule out the presence of an optically thin compact H II region.
In this paper we report sensitive ATCA radio continuum observations toward two sources in our sample, IRAS 155965301 and 162724837, without previously detected radio continuum emission to place stringent limits in their radio flux density. The sensitivity level of 70 Jy at 4.8 GHz achieved in our observations is thirty times smaller than in previous studies and is sufficient to detect the emission measure corresponding to any ionizing OB star within the Galaxy. The main goal was to establish whether or not these objects correspond to very young massive objects; that is massive protostars which have not yet ionized significant amounts of the surrounding gas. Also reported in this paper are millimeter continuum and molecular line observations of IRAS 155965301 and 162724837 made with the Swedish-ESO submillimetre telescope. The latter observations are part of a molecular line survey toward several high-mass star forming regions made in order to determine their physical characteristics and investigate possible chemical differences.
2 Observations
The observations were made using the Australia Telescope Compact Array ATCA 111The Australia Telescope Compact Array is funded by the Commonwealth of Australia for operation as a National Facility managed by CSIRO in Australia, and the 15 m Swedish–ESO Submillimetre Telescope (SEST) located on La Silla, Chile.
2.1 ATCA
The ATCA radio continuum observations were made in 2000 May, 23, using the 6D configuration, which utilizes all six antennas and covers east-west baselines from 77 m to 5.9 km. Observations were made simultaneously at the frequencies of 4.800 and 4.928 GHz, each spanning a bandwidth of 128 MHz. At these frequencies the FWHM primary beam of ATCA is 10′. Total integration time for each source was 270 minutes, obtained from 15-minute scans taken over a wide range of hour angles to provide good (u,v) plane coverage. The calibrator PKS 1600-48 was observed before and after every on-source scan in order to correct the amplitude and phase of the interferometer data for atmospheric and instrumental effects. The flux density was calibrated by observing PKS 1934-638 (3C84) for which values of 5.83 Jy at 4.8 GHz and 5.65 Jy at 4.9 GHz were adopted. Standard calibration and data reduction were performed using MIRIAD (Sault, Teuben, & Wright 1995). Maps were made by Fourier transformation of the uniformly weighted interferometer data using the AIPS task MX. The noise level in each image is 70 Jy, close to the expected theoretical limit of 50 Jy. The synthesized (FWHM) beams were for IRAS 155965301 and for IRAS 162724837.
2.2 SEST
2.2.1 Millimeter continuum
The 1.2 mm continuum observations were made in 2001, September using the SIMBA 37-channel bolometer array. The HPBW of a single element is 24″ and the separation between elements on the sky is 44″. We made the observations in the fast mapping mode, using a scan speed of 80″ s-1. Our observing blocks consisted of 50 scan lines in azimuth of length 800″ and separated in elevation by 8″, giving a map size in elevation of 400″. This block required 15 minutes of observing time. Two blocks were observed for each source. The data were reduced in a standard fashion, applying sky-opacity correction, calibration using a counts-to-flux conversion factor derived from maps of bright planets, baseline subtraction, and rejection of correlated sky-noise using the software package MOPSI. The rms noise level in the final maps is 0.1 Jy with a pixel binning of 8″. Uncertainties in the pointing accuracy are estimated at 1 = 5″.
2.2.2 Molecular lines
The molecular line observations were carried out in two epochs. During June of 1999 we used as backend the high resolution acousto-optical spectrometers which provided a channel separation of 43 kHz and a total bandwidth of 43 MHz. We observed, at the position of the IRAS sources, molecular line emission in ten transitions: CS(21), CS(54), CS(76), C34S(21), SiO(21), SO(), HCO+(10), HCO+(32), H13CO0) and C18O(21), with integration times on source ranging from 3 to 6 minutes. System temperatures were typically K at 3 mm, K at 1 mm, and K at 0.8 mm. In addition we mapped, with angular spacings of 30″, the CS(21) and CS(54) emission within regions of 2.5′ and the SiO(21) emission within regions of 2.5′′ centered on the IRAS positions. These observations were made in order to investigate the kinematics of the molecular gas.
During March of 2000 we made a survey of molecular line emission using as backend the low resolution acousto-optical spectrometers providing a channel separation of 700 kHz and a total bandwidth of 1.0 GHz. The 100/150 GHz and 115/230 GHz pairs of SIS receivers were used to simultaneously observe lines in, respectively, the 3/2 mm and 3/1 mm wavelength ranges. We observed 39 spectral windows, 1.0 GHz wide each, within the 85 to 250 GHz frequency range. System temperatures were typically K at 2-mm and 3-mm, and K at 1-mm. The integration times on source were 5 minutes, resulting in antenna temperature rms noises of typically 20 mK. A detailed description of these observations are given in Garay et al. (2002). All the observations were performed in the dual beam-switching mode, with a beam separation of 11′47″ in azimuth.
3 Results
3.1 Radio continuum emission.
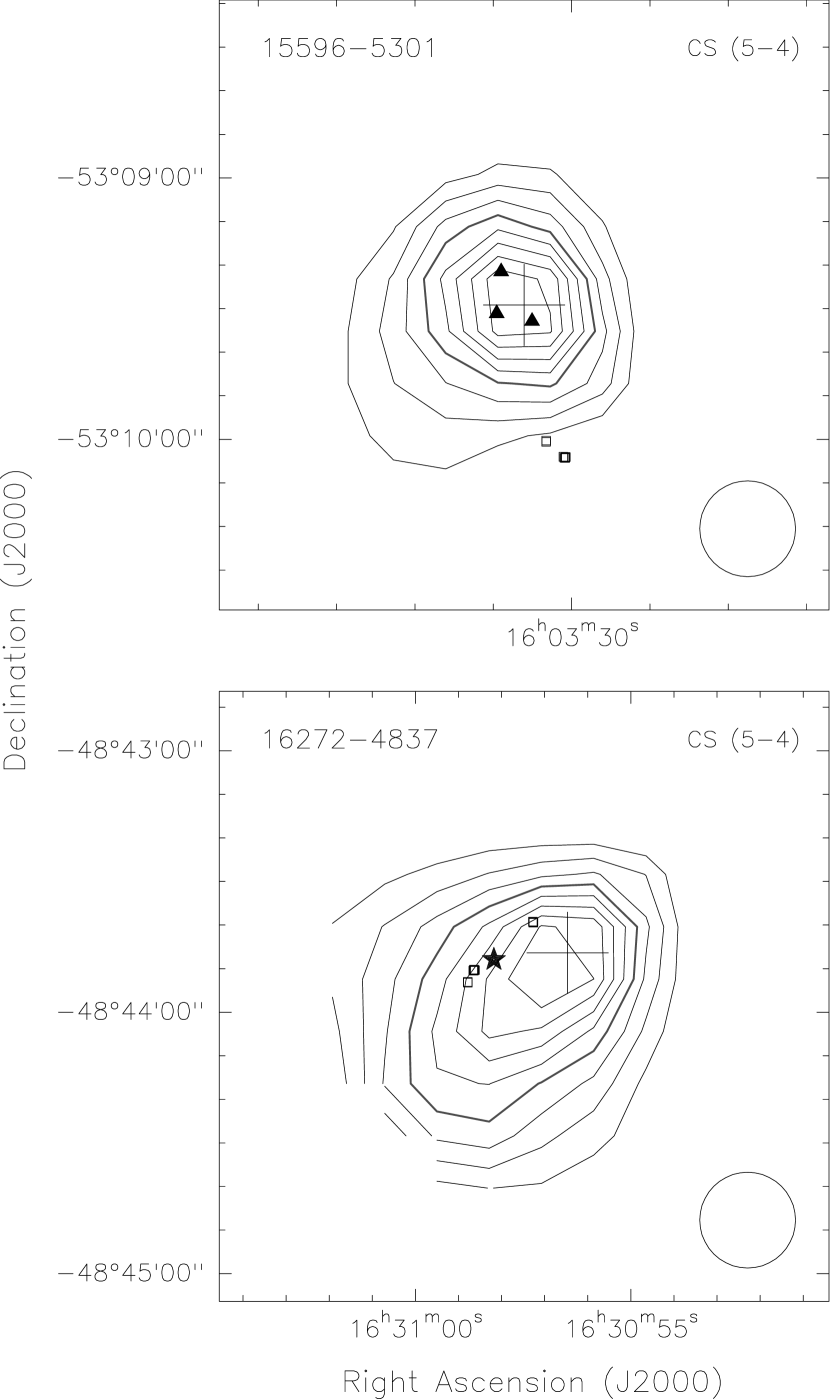
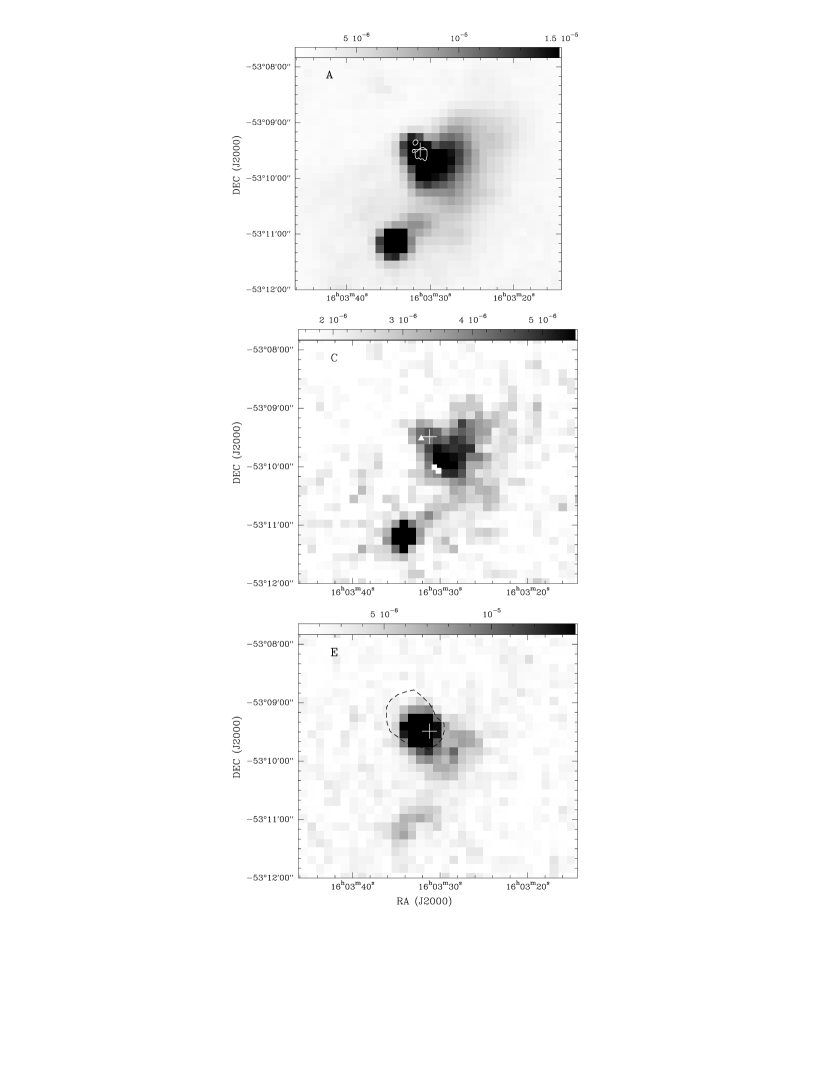
Figure 1 shows a map of the 6 cm radio continuum emission from IRAS 155965301. Three compact radio sources (labeled A, B, and C) were detected within a region of 30″ in diameter. Their positions, flux densities, and sizes are given in Table 1. Their peak flux densities are in the range 1.1 to 2.8 mJy/beam, close to the sensitivity limit in the survey of Walsh et al. (1998). The less compact source (object A) appears to have an irregular shell-like structure.
No radio continuum emission was detected toward 16272- within a region of 3′ in radius centered on the IRAS position. We set a new 3 upper limit for the 6 cm flux density of 16272- of 0.2 mJy, about thirty times smaller than that previously reported by Walsh et al. (1998). We detected, however, emission from a region located about 4′ northwest of the array phase center, with a total flux density (corrected by primary beam) of 122 mJy. The morphology of the emission is complex, showing an elongated bipolar-like structure with a peak located at , .
3.2 Millimeter continuum emission.
Figure 2 presents maps of the 1.2-mm continuum emission observed with SEST, revealing the presence of strong emission towards both IRAS sources. The 1.2-mm emission associated with IRAS 155965301 has a peak position at , , a flux density of Jy and a peak flux density of 2.0 Jy/beam. It shows an elongated morphology, with deconvolved major and minor axes of 42.1″ and 24.6″ at P.A. 46°. The 1.2-mm emission detected towards IRAS 162724837 has a peak position at , , a flux density of Jy and a peak flux density of 4.6 Jy/beam. It has an elongated morphology, with deconvolved major and minor axes of 41.0″ and 24.7″ at P.A. 142°.
3.3 Molecular line emission.
The molecular line survey indicate that IRAS 155965301 and 162724837 have similar chemical characteristics. This is illustrated in Figure 3 which shows rotational diagrams of the emission from selected species (CH3OH, CH3CN, CH3CCH, and HCCCN) with optically thin lines and at least five observed transitions. The average rotational temperature derived from these diagrams is 27 K for both sources. Overall we detected emission from more than 20 species toward both objects. Table 2 summarizes the derived properties of the molecular emission in selected species. Column densities, rotational temperatures, and abundances relative to CO are given in columns 2-4. The column density of optically thick species, such as CO and CS, were determined as follows. The optical depths of a pair of an optically thick line and an optically thin line of an isotopic species are determined, for a given abundance ratio, from the ratio of their observed brightness temperatures. From these opacities and assuming an excitation temperature of 30 K we then computed the total column density assuming that energy levels are populated according to local thermodynamic equilibrium (see Bourke et al. 1997 for a description of the method). For the derivation of CO column densities we used the optically thick 13CO() and optically thin C18O() pair of lines, whereas for CS we used the CS() and C34S() pair of lines. For species with optically thick lines it is also possible to determine the filling factor of the emission within the observed beam. Filling factors of 0.5 for 13CO and 0.13 for CS were estimated for both sources.
Figure 4 shows maps of the CS() line emission from both sources. The morphology of the dense gas from IRAS 155965301 is roughly circular, with a mean angular diameter of 37″. This implies a cloud radius of 0.41 pc at a distance of 4.6 kpc. The spatial distribution of the dense gas from IRAS 162724837 is elongated, with major and minor axes of 61″ and 42″, respectively. This implies radii of 0.50 and 0.35 pc at a distance of 3.4 kpc. From the observed CS size and derived CS column density we estimate that the CS density is cm-3 in IRAS 155965301 and cm-3 in 162724837. Further, assuming a [CS/H2] abundance ratio of (cf. van der Tak et al. 2000), we find that the molecular hydrogen density and the mass of molecular gas are cm-3 and for IRAS 155965301, and cm-3 and for IRAS 162724837. Thus, the molecular observations show that both sources are associated with dense, massive molecular cores. The mass of the cores can, alternatively, be estimated assuming that they are in virial equilibrium (MacLaren et al. 1988). From the observed size and average line width in the CS(5-4) line we derive virial masses of for IRAS 155965301 ( pc; =5.17 km s-1) and for IRAS 162724837 ( pc; =5.44 km s-1).
Figure 5 shows the spectra observed, with the high resolution spectrometer, toward the peak position of the IRAS 162724837 core. The CS(21), HCO+(10) and HCO+(32) spectra show double-peaked line profiles, with a bright blue-shifted peak at the velocity of km s-1 and a weaker red-shifted peak at the velocity of km s-1. On the other hand, the profiles of the C34S(21) and H13CO+(10) lines show a symmetric single component with a peak line center velocity of km s-1. These spectroscopic signatures suggest that the bulk of the molecular gas toward IRAS 162724837 is undergoing large-scale inward motions. Infalling motions traced by optically thick molecular lines are expected to produce line profiles showing blue asymmetry, whereas optically thin lines are expected to exhibit symmetrical profiles (Mardones et al. 1997).
In some species, particularly SiO and SO, the spectra show the presence of strong wing emission indicative of outflow activity. In the SiO() line the wing emission extends up to velocities of km s-1 and 19.5 km s-1 relative to the ambient cloud velocity of km s-1. Figure 6 shows contour maps of the velocity integrated SiO emission in the range of flow velocities from to km s-1 (continuous lines; blueshifted gas) and from to km s-1 (dotted lines; redshifted gas). The flow velocity is defined as , where is the velocity of the emission from quiescent ambient gas. The spatial distribution of the wing emission clearly shows a bipolar structure with redshifted and blueshifted lobes extending in opposite directions of a 22m source detected by MSX (see later discussion). The bipolar structure shows a moderate degree of collimation, with the blueshifted emission seen mainly toward the west and the redshifted emission seen mainly toward the east, suggesting that the underlying wind is a wide angle wind.
3.4 Mid-infrared emission.
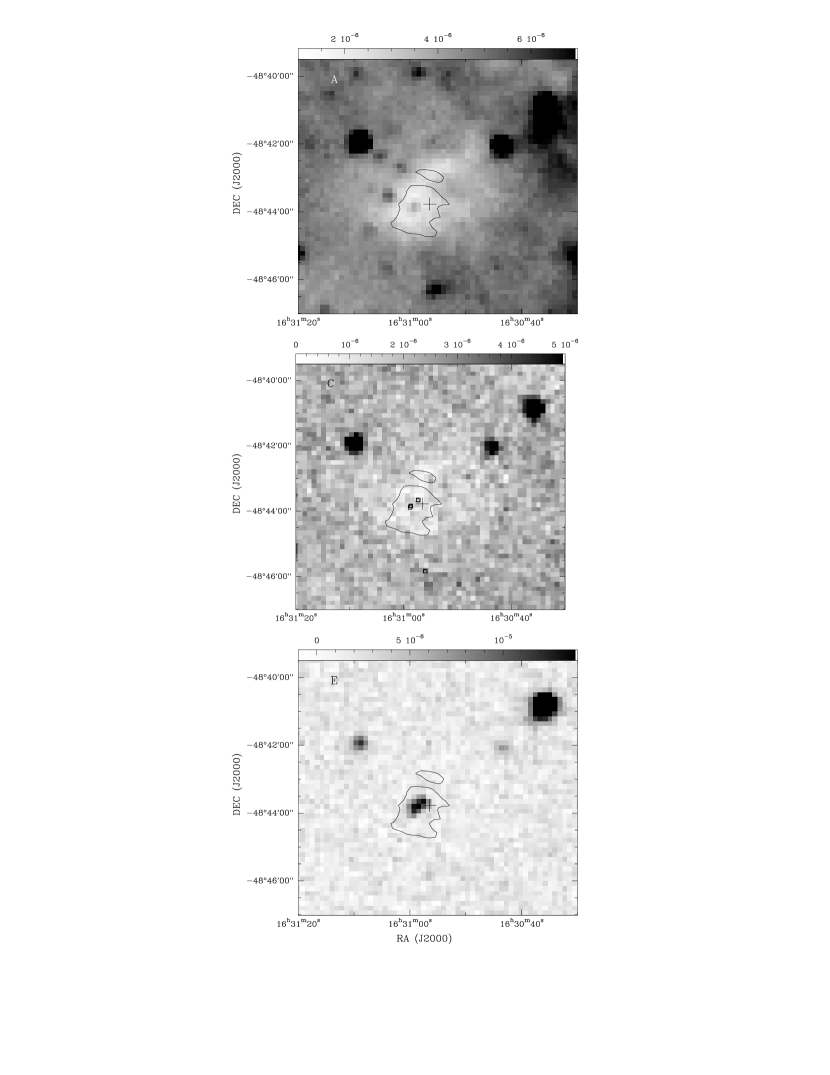
We have used the database from the Midcourse Space Experiment (MSX; Price 1995) survey of the Galactic plane (Egan et al. 1998) to investigate the mid-infrared emission, in the four MSX broad bands (A:6.8-10.8 m, C:11.1-13.2 m, D:13.5-15.9 m, and E:18.2-25.1 m), from both IRAS sources. Figure 7 presents grey scale images of the emission in the A, C, and E bands of a region of about 4′ toward IRAS 155965301. These images show the presence of two sources within the central 1′ region: a compact object, brighter in the E band image, and an extended object, brighter in the C band, with a peak located about 30″ southwest of the former. Both sources are seen in emission in the four MSX bands. The three radio continuum sources detected within this region (delineated by the 0.5 mJy contour level in the upper panel of Figure 7), as well as the peak position of IRAS 155965301 (marked by the cross), lie projected within the face the compact object. Further, the extent of the 1.2-mm dust continuum emission (delineated by the 0.5 Jy contour level in the lower panel of Figure 7) is similar to that of the E-band infrared emission. These results show that the compact MSX object is intimately associated with the 155965301 massive molecular core. We measured flux densities of 5.4, 4.1, and 24.3 Jy in the C, D, and E bands, respectively. The extended object shows strong emission in the A and C bands, which are sensitive to emission from polycyclic aromatic hydrocarbon (PAH) features (7.7 and 8.3 m in A band; 11.3 and 12.6 m in C band). Since no radio emission is detected toward this MSX source, we suggest that it might correspond to a photodissociated region excited by a non-ionizing star.
IRAS 162724837 is associated with an infrared dark cloud seen in absorption against bright mid-infrared emission in the A, C, and D bands. This is shown in the top two panels of Figure 8 which presents grey scale images of the emission in the A, C, and E bands toward IRAS 162724837. There is a good agreement between the molecular, millimeter and mid-infrared morphologies, as illustrated by the contour of the 1.2-mm continuum emission shown in Figure 8. From the molecular hydrogen column density derived from the line observations (of cm-2), assuming a gas-to-dust mass ratio of 110 (Draine & Lee 1984) and a dust opacity at 8m of cm2 gr-1 (Ossenkopf & Henning 1994), we estimate that the optical depth at 8m is , indicating that this cloud is optically thick at MID-IR. Further, the MSX observations in the E-band show the presence, near the center of the infrared dark cloud, of an object seen in emission located at , (see bottom panel of Figure 8). We finally note that the MSX object seen near the top right corner of Figure 8, which is clearly extended in the A-band image, is associated with the IRAS object 16269-4834 and coincident with the radio source detected 4′ northwest of 162724837.
4 Discussion
4.1 Spectral energy distribution
Figure 9 shows the spectral energy distribution (SED) of IRAS 155965301 and 162724837 from 12 m to 1.2 mm, which is mainly due to thermal dust emission. We fitted the SED with modified blackbody functions of the form where is the dust optical depth, is the Planck function at the dust temperature , and is the solid angle subtended by the dust emitting region. The opacity was assumed to vary with frequency as , i.e. , where is the frequency at which the optical depth is unity. Due to the limited number of spectral points we have set the value of equal to 2.0, consistent with tabulated opacities (Ossenkopf & Henning 1994) and derived values for high mass star forming regions (Molinari et al. 2000). A single temperature model produced poor fits, underestimating the emission observed at wavelengths smaller than 25m, and therefore we used a model with two temperature components.
From the fits (long-dashed lines) we derive that the colder dust component (short-dashed lines) toward 155965301 and 162724837 have, respectively, temperatures of 27 and 25 K, angular sizes (assuming a Gaussian flux distribution) of 30″(FWHM), and wavelengths at which the opacity is unity of 90 m and 140 m. The temperature of the hot dust component is 100 K for 155965301 and 115 K for 162724837. The thermal dust emission at 1.2 mm is therefore optically thin (), and thus the observed flux density at 1.2 mm allows to obtain an additional mass estimate of the dense cores. In general, for an isothermal dust source the total gas mass, , is given in terms of the observed flux density, , at an optically thin frequency, , by (e.g. Chini, Krugel, & Wargau 1987)
where is the mass absorption coefficient of dust, is the dust-to-gas mass ratio (assuming 10% He), and is the Planck function at the dust temperature . The main source of uncertainty in the conversion of the observed flux density into gas mass is the factor, or total mass opacity, which is a poorly known quantity (e.g. Gordon 1995). Using a dust opacity at 1.2 mm of 1 cm2 g-1, as computed by Ossenkopf & Henning (1994) for dense and cold protostellar cores, , the fitted dust temperatures, and the observed flux densities, we derive masses of for IRAS 155965301 and for IRAS 162724837. These masses derived from the dust emission are in good agreement with those derived from the molecular line intensities and from the virial assumption.
4.2 Evolutionary stages
4.2.1 IRAS 155965301 (G329.40-0.46)
The radio continuum observations toward IRAS 155965301 indicate the presence, in a region of 0.3 pc in radius, of three distinct H II regions with diameters ranging from 0.06 to 0.2 pc. The multiple structure of the ionized gas is typical of galactic H II regions, and is most likely due to the presence of a cluster of exciting stars. If components A, B, and C are excited by individual ZAMS stars, the rate of UV photons needed to ionize them (see Table 3) imply exciting stars with spectral types of B0, B0.5, and B1, respectively. The total luminosity emitted by this cluster of B stars, as inferred from the radio observations, is 4.1 . On the other hand, the total far-infrared luminosity computed using the IRAS fluxes (see Casoli et al. 1986) is (assuming a distance of 4.6 kpc; Bronfman 2002). The difference between the radio derived luminosity and the IRAS luminosity could be explained by the presence of dust within the H II regions. Garay et al. (1993) found that the fraction of Lyman continuum photons absorbed by dust within H II regions is typically 55%. Alternatively, it could be explained by the presence, in addition to the B stars, of several less massive stars that will contribute to the FIR luminosity but that are not hot enough to contribute to ionization. It is not easy, however, to disentangle which of these effects play the predominant role.
The compact H II regions are found projected toward the peak of the CS() emission map (see Figure 4), suggesting that they are deeply embedded within the dense molecular core. From the observed sizes, and assuming a sound speed in the ionized gas of 11.4 km s-1, we estimate that the H II regions have dynamical ages between 3 to 8 yrs. If these correspond to the actual ages of the compact H II regions, then we should conclude that they are very young objects. The dynamical time-scales, however, may not provide a realistic estimate of the actual age of H II regions. The large number of UC H II regions and their short dynamical ages poses the well known problem that the rate of massive star formation appears to be much greater than other indicators suggest (Wood & Churchwell 1989, Churchwell 1990). Due to the high density of the molecular gas in which they are embedded, we suggest instead that the H II regions within the IRAS 155965301 massive core might be in pressure equilibrium with the surrounding dense ambient medium, and are currently stalled at their equilibrium radius. (e.g. De Pree, Rodríguez, & Goss 1995). The molecular density of the ambient gas needed to stall an H II region at radius, , is given by (e.g. Garay & Lizano 1999)
where is the rate of ionizing UV photons emitted by the exciting star, is the electron temperature of the ionized gas, and is the temperature of the ambient gas. Using the observed radius and the derived ionizing rate of UV photons of the H II regions within IRAS 155965301, we find that molecular densities of cm-3 are needed for them to be pressure confined by the dense environment. These densities are similar to those derived from the molecular observations. The time needed for the H II regions to achieve pressure equilibrium are between yrs to yrs, implying that massive star formation started within this core more than yrs ago. We conclude that the dense massive core is in an advanced stage of early evolution, in which multiple OB star formation have already taken place near its central region.
4.2.2 IRAS 162724837 (G335.58-0.28)
The total far-infrared luminosity of IRAS 162724837 computed using the IRAS fluxes (see Casoli et al. 1986) is (assuming a distance of 3.4 kpc; Bronfman 2002). The luminosity obtained integrating under the fitted curve in Figure 9 is similar to the IRAS luminosity. The high luminosity suggests that the IRAS 162724837 massive core hosts a young massive protostar inside; and the lack of radio emission suggests that it is still undergoing an intense accretion phase. Models of massive envelopes accreting onto a young massive central B type star (e.g. Osorio et al. 2000) require accretion rates in the envelopes yr-1 in order to fit the observed SEDs. The high-mass accretion rate of the infalling material quenches the development of an UC H II region (Yorke 1984), and the free-free emission from the ionized material is undetectable at centimeter wavelengths.
This hypothesis is supported by the characteristics of the line profiles observed toward IRAS 162724837, which suggest that the molecular gas is undergoing infalling motions. From the spectra of the optically thick HCO line we measure a velocity difference between the red and blue peaks of 2.7 km s-1, and brightness temperature of the blue peak, red peak, and dip of 5.4, 3.6, and 2.9 K, respectively. From the spectra of the optically thin H13CO line we measure a FWHM line width of 3.18 km s-1. From these values, using the simple model of contracting clouds of Myers et al. (1996), we derive a characteristic inward speed of 0.5 km s-1. We note that this value is considerably smaller than the free-fall velocity expected for a cloud with a total mass of at its outer envelope radius of 0.4 pc, suggesting that the collapse is not dynamical. Using the derived values of the infall speed, molecular density, and core size, we obtain a mass infall rate, , of yr-1, large enough to prevent the development of an UC H II region. The high value of the mass infall rate rises the question as to which is the fraction of the total luminosity due to accretion. The accretion luminosity, , is
where is the fraction of the large scale mass infall rate that goes into accretion onto the protostar, is the mass of the protostar, and the radius where the shock occurs. None of these three parameters are known for IRAS 162724837. Assuming , cm, and (e.g, Norberg & Maeder 2000) we obtain , about 15% of the total luminosity. We emphasize that this value of the accretion luminosity corresponds only to a rough estimate, particularly because the value of is highly uncertain.
Additional evidence for IRAS 162724837 to be in a collapsing stage is provided by the presence of bipolar outflowing gas, phenomenon which is thought to be closely related to accretion processes. The 22m object lies at the center of symmetry of the SiO outflow, suggesting it is intimately associated with the energy source of the outflow. The early evolutionary stage of this region is also sustained by the presence of 6.67 GHz methanol masers, which are thought to be signposts of young regions of massive star formation (Walsh et al. 1997, 1998). Notice that the 22m source is elongated, with the 6.67 GHz methanol masers being aligned along its major axis. Finally, we mention that the high value of the mass to luminosity ratio of IRAS 162724837, , about 4 times higher than that of IRAS 155965301, is another indicator of its youth, as argued by Sridharan et al (2002).
5 Summary
We undertook sensitive radio continuum observations at 4.8 GHz, using ATCA, and 1.2 millimeter continuum and molecular line observations, using SEST, toward IRAS 155965301 and 162724837, two luminous objects () thought to represent massive star forming regions in early stages of evolution. The main results and conclusions are summarized as follows:
1. The 4.8 GHz radio continuum observations toward IRAS 155965301 show the presence of three distinct compact sources with diameters of 0.06 to 0.2 pc, all located within a region of 30″ in diameter. If they are regions of ionized gas, they have electron densities of cm-3 and are excited by early B type stars. The 1.2-mm continuum observations show that the dust emission arises from an elongated region with major and minor axes of 42.1″and 24.6″, respectively. The observed 1.2-mm flux density, of 5.8 Jy, implies a mass of . The line observations indicate a region of molecular gas with a radius of pc, a molecular hydrogen density of cm-3, and a rotational temperature of K. We conclude that IRAS 155965301 corresponds to a dense massive ( ) molecular core, with a radius of about 0.4 pc, that is in the compact H II region phase of evolution, already hosting a cluster of massive B type stars. Further, we suggest that the regions of ionized gas excited by these stars are in pressure equilibrium with the ambient molecular gas.
2. No radio continuum emission at 4.8 GHz was detected from IRAS 162724837 up to a limit of 0.2 mJy. The 1.2-mm continuum observations show strong dust emission arising from a region with an elongated morphology, with major and minor axes of 41.0″ and 24.7″. The observed flux density at 1.2-mm, of Jy, implies a mass of . The line observations indicate a molecular gas region with a size of pc, a molecular hydrogen density of cm-3, and a rotational temperature of K. We suggest that this object corresponds to a dense massive core in a very early evolutionary stage, distinguished by being luminous but not associated with an UC H II region (eg. Cesaroni et al. 1994; Hunter et al. 1998; Molinari et al. 1998). The core is being heated by a recently formed massive star embedded at its center which is still accreting at high rates, the main heating agent being the accretion luminosity, and have not yet produced a detectable ultra compact H II region. As such, this will become a key object for the study at submillimeter wavelengths with high angular resolution of the earliest stages of the formation of massive stars, and their related accretion and outflow processes.
References
- (1)
- (2) Bourke, T. L., Garay, G., Lehtinen, K. K., Köhnenkamp, I., Launhardt, R., Nyman, L-Å, May, J., Robinson, G., & Hyland, A. R. 1997, ApJ, 476, 781
- (3)
- (4) Bronfman 2002, priv. comm.
- (5)
- (6) Bronfman, L., Nyman, L.Å., & May, J. 1996, A&AS, 115, 81
- (7)
- (8) Casoli, F., Dupraz, C., Gerin, M., Combes, F., & Boulanger, F. 1986, A&A, 169, 281
- (9)
- (10) Cesaroni, R., Churchwell, E., Hofner, P., Walmsley, C.M., & Kurtz, S. 1994, A&A, 288, 903
- (11)
- (12) Chini, R., Krügel, E., & Wargau, W. 1987, A&A, 181, 378
- (13)
- (14) Churchwell, E. 1990, A&A Rev., 2, 79
- (15)
- (16) De Pree, C.G., Rodríguez, L.F., & Goss, W.M., 1995, RMA&A , 31, 39
- (17)
- (18) Draine, B.T., & Lee, H.M., 1984, ApJ, 285, 89
- (19)
- (20) Egan, M. P., Shipman, R. F., Price, S. D., Carey, S. J., Clark, F. O., & Cohen, M. 1998, ApJ, 494, L199
- (21)
- (22) Garay, G., Rodríguez, L.F., Moran, J.M., & Churchwell, E. 1993, ApJ, 418, 368
- (23)
- (24) Garay, G., & Lizano, S. 1999, PASP, 111, 1049
- (25)
- (26) Garay, G., Pineda, J. & Mardones, D. 2002, in preparation.
- (27)
- (28) Gordon, M. A. 1995, A&A, 301 853
- (29)
- (30) Hunter, T. R., Neugebauer, G., Benford, D. J., Matthews, K., Lis, D. C., Serabyn, E., & Phillips, T. G. 1998, ApJ, 493, L97
- (31)
- (32) MacLaren, I., Richardson, K.M., Wolfendale, A.W. 1988, ApJ333,821
- (33)
- (34) Mardones, D., Myers, P.C., Tafalla, M., Wilner, D.J., Bachiller, R., & Garay, G. 1997, ApJ, 489, 719
- (35)
- (36) Mardones, D. 1998, Ph.D. Thesis Harvard University
- (37)
- (38) Mardones, D., Garay, G., & Bronfman, L. 2002, in preparation
- (39)
- (40) Molinari, S., Brand, J., Cesaroni, R., & Palla, F. 1996, A&A, 308, 573
- (41)
- (42) Molinari, S., Brand, J., Cesaroni, R., Palla, F., & Palumbo, G.G.C. 1998, A&A, 336, 339
- (43)
- (44) Molinari, S., Brand, J., Cesaroni, R., & Palla, F. 2000, A&A, 355, 617
- (45)
- (46) Myers, P.C., Mardones, D., Tafalla, M., Williams, J.P., & Wilner, D.J. 1996, ApJ, 465, L133
- (47)
- (48) Norberg, P., & Maeder, A. 2000, A&A, 359, 1025
- (49)
- (50) Osorio, M., Lizano, S., & D’Alessio, P. 1999, ApJ, 525, 808
- (51)
- (52) Ossenkopf, V., & Henning, Th. 1994, A&A, 291, 943
- (53)
- (54) Price, S.D. 1995, Space Sci. Rev., 74, 81
- (55)
- (56) Sault, R. J., Teuben, P. J., & Wright, M.C.H. 1995, Astronomical Data Analysis Software and Systems IV, eds. R.A. Shaw, H.E. Payne, & J.J.E. Hayes, ASP Conference Series, 77, 433
- (57)
- (58) Sridharan, T.K., Beuther, H., Schilke, P., Menten, K.M., & Wyrowski, F. 2002, ApJ, 566, 931
- (59)
- (60) Stahler, S.W., Palla, F., & Ho, P.T.P., 2000, Protostars and Planets IV, ed. V. Mannings, A.P. Boss, & S.S. Russell (Tucson: Univ. Arizona), 327
- (61)
- (62) van der Tak, F.F.S., van Dishoeck, E.F., Evans, N.J. II, & Blake, G.A. 2000, ApJ, 537, 283
- (63)
- (64) Walmsley, C.M. 1995, RMA&A Conf. Ser. , 1, 137
- (65)
- (66) Walsh, A.J., Burton, M.G., Hyland, A.R., & Robinson, G. 1998, MNRAS, 301, 640
- (67)
- (68) Walsh, A.J., Hyland, A.R., Robinson, G., & Burton, M.G. 1997, MNRAS, 291, 261
- (69)
- (70) Wood, D.O.S., & Churchwell, E. 1989, ApJ, 340, 265
- (71)
- (72) Yorke, H.W. 1984, Workshop on Star Formation, ed. R.D. Wolstencroft (Edinburgh: Royal Observatory), 63
- (73)
| H II region | Position | Flux density | Angular size | |
|---|---|---|---|---|
| (2000) | (2000) | (mJy) | (″″) | |
| A | 43.4 | 9.78.0 | ||
| B | 16 03 31.80 | 9.0 | 3.02.5 | |
| C | 16 03 31.91 | 3.0 | 6.12.6 | |
| Molecule | IRAS 15596 | IRAS 16272-4837 | |||||
|---|---|---|---|---|---|---|---|
| N | N | ||||||
| (K) | (cm | (K) | (cm | ||||
| CO | 30aaAssumed excitation temperature. | 1 | 30aaAssumed excitation temperature. | 1 | |||
| 13CO | 30aaAssumed excitation temperature. | 30aaAssumed excitation temperature. | |||||
| C18O | 30aaAssumed excitation temperature. | 30aaAssumed excitation temperature. | |||||
| CS | 30aaAssumed excitation temperature. | 30aaAssumed excitation temperature. | |||||
| C34S | 30aaAssumed excitation temperature. | 30aaAssumed excitation temperature. | |||||
| H2CO | — | — | — | 27.0 | |||
| CH3OH | 19.1 | 18.0 | |||||
| CH3CCH | 26.3 | 31.9 | |||||
| CH3CN | 33.7 | 29.0 | |||||
| CH3CHO | 25.0 | 21.0 | |||||
| SiO | 10.4 | 9.9 | |||||
| SO | 23.0 | 11.7 | |||||
| HCCCN | 28.2 | 27.3 | |||||
| OCS | 37.5 | 28.5 | |||||
| SO2 | 27.6 | 25.9 | |||||
| H II region | Diameter | EM | Nu | S.T. | |
|---|---|---|---|---|---|
| (pc) | (pc cm-6) | (cm-3) | (s-1) | ||
| A | 0.196 | B0 | |||
| B | 0.061 | B0.5 | |||
| C | 0.089 | B1 |


.