Why is it Difficult to Detect a Millisecond Pulsar in Neutron Star X-ray Binaries?
Abstract
We explain why it is possible to detect directly X-ray emission from near the surface of the neutron star (NS) in SAX J1808.4-3658 but not in most other low-mass X-ray binaries (LMXBs), with the exception that emission from the surface can be seen during bursts events. We show that the X-ray emission from SAX J1808.4-3658 mostly originates in the Comptonization process in a relatively optical thin hot region (with an optical depth around 4 and temperature is around 20 keV). Such a transparent region does not prevent us from detecting coherent X-ray pulsation due to hot spots on the NS surface. We give a precise model for the loss of modulation, such suppression of the QPO amplitude due to scattering can explain the disappearance of kHz QPOs with increasing QPO frequency. We also formulate general conditions under which the millisecond X-ray pulsation can be detected in LMXBs. We demonstrate that the observed soft phase lag of the pulsed emission is a result of the downscattering of the hard X-ray photons in the relatively cold material near the NS surface. In the framework of this downscattering model we propose a method to determine the atmosphere density in that region from soft-lag measurements.
1 Introduction
Low-mass X-ray binaries (LMXB) presumably contain a weakly magnetized neutron star (NS). Recently Titarchuk, Bradshaw & Wood (2001), hereafter TBW suggested a new method of estimating B-field strength using the magnetoacoustic oscillation model and found that the B-field strength for a number of NSs in LMXBs is gauss. Near-coherent millisecond X-ray pulsations have been observed in 4U 1728-34 during thermonuclear (type I) X-ray bursts (e.g. Strohmayer et al. 1996). They are interpreted as X-ray intensity modulated at period close to the spin period of the neutron star. Thus these B-field estimates in addition to the detection of the milisecond pulsation give strong arguments for LMXB neutron stars to be progenitors of millisecond radio pulsars (MLP) (see review by Bhattacharya & van den Heuvel 1991). But there is still a question why these coherent pulsations are not found in persistent emission despite careful searches (Wood et al. 1991; Vaughan et al. 1994). The lack of coherent pulsations has been explained as modulation loss from gravitational lensing (Wood, Ftaclas & Kearney 1988; Meszaros, Riffert & Berthiaume 1988) or from to scattering (e.g. Bainerd & Lamb 1987; Kylafis & Klimmis 1987 ). The third explanation for the lack of pulsations is presented by Cumming, Zweibel & Bildsten (2001) who argue that the surface field is weak because of magnetic screening 111The recent discoveries of MLP in XTE J1751-305 (Markwardt et al. 2002) and in XTE J0929-314 (Galloway et al. 2002 ) with extremely low mass transfer rates support the suggestion of the absence of the magnetic screening for the low mass accretion rates.. In this Letter we put forth arguments for smearing out of the pulsar signal due to electron scattering in the optically thick environment typical of most observed LMXBs. In §2 we study the scattering effect and its relation with the observed timing and spectral characteristics for various QPO sources. In §3 we investigate the scattering effects in QPO sources. In §4 we present results of the RXTE data analysis of spectral properties of X-ray radiation in SAX 1808.4-3656. In §5 we analyze the downscattering model and its application to the observed soft lag phenomenon detected in the coherent pulse signal from SAX 1808.4-3656. Conclusions follow in §6.
2 Scattering Effect on QPO Pulse Profile and Pulsar Profile
The transfer problem to be solved is that of a sinusoid, representing either (a) an intrinsic pulsar light curve or (b) a high frequency QPO, but in each case seen through a surrounding medium that reduces the pulse modulation by scattering. The signal whose modulation is affected lies in the range of a few hundred Hz to perhaps 1 kHz. We thus must analyze smearing out of a signal at very high frequencies and investigate the dependence upon both the intrinsic frequency and the optical depth of the scattering environment. The geometry used derives from earlier works (see e.g. Sunyaev & Titarchuk 1980, hereafter ST80; Titarchuk, Lapidus & Muslimov 1998, hereafter TLM98) modeling energy spectra and power density spectra (PDS) of LMXB sources. For the high frequency QPO, [case (b)] the TLM98 model identifies the site where the QPO is generated, which will be at radius substantially larger than that of the star. Thus the effective optical depth of interest in case (b) will not be the full optical depth to the star surface but rather the reduced optical depth appropriate to that site location.
One more consideration completes the problem specification. It is well established from observation that the kHz frequency QPOs in LMXBs are not fixed in frequency but increase or decrease in manner correlated with changes in luminosity. which in turn is believed to vary directly as mass accretion rate, hence as source brightens the OPO site moves both inward in radius and upward in frequency. Consequently, the total change in QPO power as the source varies will be a combination of two effects, namely (i) the intrinsic change in QPO power that results simply from physics of shifting the resonance frequency that gives the QPO and (ii) the further reduction in power that results from its now being observed at higher frequency and through greater optical depth, both of which enhance the effects of scattering. To model the entire process we therefore require a model for the intrinsic change in power. This is provided in the cited transition layer (TL) model (TLM98) by approximating the QPO process itself as a damped harmonic oscillator under the influence of a driving force. Then, the interaction leads to resonance oscillations for which the Q-value can be high. The resonance amplitude varies as the product of the amplitude of the driving force and (see Landau & Lifshitz 1965). The default intrinsic model, in the absence of scattering, is thus that the QPO amplitude falls off as , but scattering contributes additional reduction. In a source such as GX 340+0, where a pair of high frequency QPOs is seen, it is possible to test out these ideas in detail, using the model derived below and applying it to both QPOs, keeping the optical depth the same for both kHz QPOs because they are co-located. Detection of the NS spin period is the crucial further issue at stake here. The typical problem is the following: since the NS spin gives a coherent periodic signal at nearly constant frequency it should be at relative advantage in detectability in comparison with QPOs, yet is not see while the QPOs are seen. The key, obviously, is that the QPO sees the reduced optical depth while the modulation at the spin period experiences the unreduced optical depth. The occasional exceptions where the stellar spin frequency does prove detectable (such as MLPs, plus the transient detections in X-ray bursters) should be explicable in terms of circumstances that reduce scattering effects in those particular cases below values that generally obtain; moreover those exceptional reductions should be confirmed by spectra indicative of the lower optical depth and other supporting context observations.
For a quantitative model of this problem scattering is handled as a diffusion problem in a Green’s function [] treatment. The input pulse is where is the NS spin rotational frequency or the QPO centroid frequency depending on whether it case (a) or (b) and is an initial phase. The resulting pulse affected by the scattering is and is given by a convolution of and :
| (1) |
For times much greater than the scattering time in the Compton cloud the initial pulse emission is calculated as follows
| (2) |
ST80 analyzed the response of the scattering medium (the Green’s function) for various source distributions. They show that for a QPO source embedded in the center of the cloud () the response of the scattering medium (the Green’s function), can be approximated by
| (3) |
where , are optical depth and radius of the cloud respectively, is the light speed. Coefficients and can be estimated as follows (see also Wood et al. 2001) , and . Using formula (3) the integral is analytically calculated by the steepest descent method (see also Prudnikov, Bruchkov & Marichev 1981, formula 2.3.16). We can show that an amplitude of can be obtained as
| (4) |
where and is a weak function of which is a constant and the product of is almost unity for much less than the inverse of crossing time . The amplitude decays exponentially when increases.
3 Consequencies of scattering effects for QPO observations: Evidence of the resonance excitation in the QPO sources
As it is seen from formula (4) the amplitude of the NS pulsations with Hz decreases very rapidly with for
| (5) |
A radius of 60 km was chosen as a typical radius of the Compton cloud derived from the observations in the frameworks of the TL model (see TBW). In Figure 2 we present the rms amplitude of the high frequency QPOs as a function of kHz frequencies for the Z-source GX 340+0 using the results of Jonker et al. (2000). We compare them with the theoretical model presented by formula (4). The amplitude of the lower kHz QPOs is perfectly fitted by dependence (see the dashed line on the left side of Fig. 2). for this fit, but the deviation of due to scattering (the solid line on the right side of Fig. 2) from the law (the dashed line on the right side of Fig. 2) is clearly seen for the higher kHz QPOs. The best fit to the data () by formula (5) with is obtained for with s. For the rms, calculated for low kHz frequencies is almost identical to dependence (). Thus we found that the driving force amplitude is practically independent of frequency for kHz QPOs. One can argue that the driving force power for kHz QPOs can be determined by the observed PDS at kHz frequencies. The PDS power law index typically varies around 1 (see details in Wijnands & van der Klis 1998). The resulting resonance amplitude would be with an assumption that this power continuum is a driving force reservoir for the resonance. As an example we fit this model with to the data for the lower kHz QPOs only, where the scattering effects can be neglected (see inequality 5). We found that for this model . The rms-frequency dependence for the lower kHz QPOs is not affected by scattering; it affects mainly the higher kHz QPOs (see Eq. 5). The scattering effects make the rms-frequency dependence much steeper for the higher kHz QPOs which does not allow us to extract the true driving force amplitude from the data (clearly, it is not feasible to dispense with scattering and fit both QPOs solely with type of driving force model) 222Fits of the rms amplitude vs frequency similar to that presented in Fig. 2 for GX 340+0, have been produced for GX 5-1, Cyg X-2, GX 17-2 and Sco X-1. Thus one can conclude that in all these kHz QPO observations the rms resonance amplitude vs frequency is affected by the photon scattering.. It is well established in the QPO observations that there is a correlation between the QPO frequency and the mass accretion (or the count rate). The high QPO frequency increases with the count rate reaching a certain level and then it disappears as the low frequencies are still detected (Zhang et al. 1998; Mendez et al. 1999). This effect can be explained by the exponential decay of the QPO amplitude with increase of which is a result of the simultanenous rise of and with the mass accretion rate. (see Eq. 4). The high frequency QPOs presumably originate in the outskirts of the Compton cloud and the optical depth of the QPO source location is relatively small (1-3) even in systems with high accretion rate. In contrast, the source of the NS pulsations is deeply embedded in the Compton cloud, whose For high mass accretion it is hardly to expect the detection of the pulsations from the NS surface. The Compton cloud optical depth can be very large. The NS pulsations would be totally smeared out by the scattering if the pulsation frequency is about 300-400 Hz and higher. In the next section we show that in SAX J1808.4-3658 the optical depth of spherical Compton cloud is relatively low allowing detections.
4 X-ray spectra of SAX J1808.4-3658 and of Other LMXBs
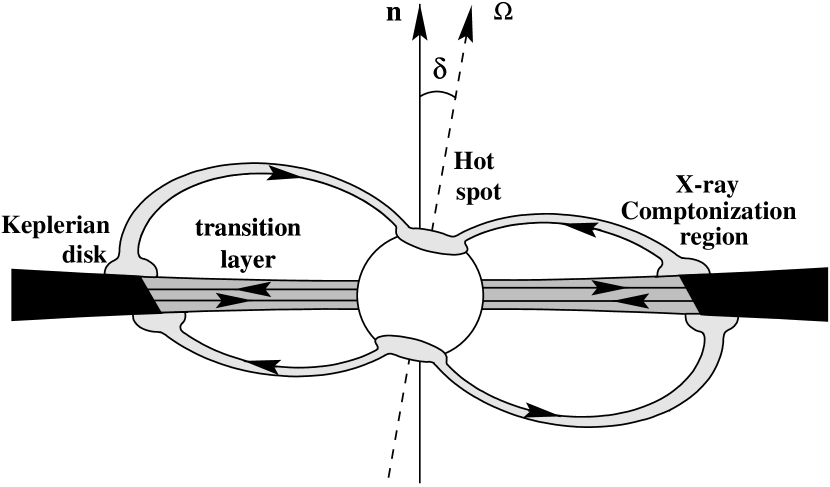
We revisit some RXTE spectral data for SAX J1808.4-3658 (Gilfanov et al. 1998; Heindl & Smith 1998). The spectrum (which was constructed using data from 30411-01-06-00) is well represented by the Comptonization model (CompTT in XSPEC, with spherical geometry; Titarchuk 1994) along with some contribution from a blackbody component and a Fe line. The best-fit parameter of the model are , electron temperature keV, energy is at keV. The temperature of the seed photons for the Comptonization is within keV. The temperature of the blackbody (BB) radiation (presumably from the neutron star surface) is keV. The quality of the fit is high with 333Gierliǹski, Done & Barret (2002), hereafter GDB, also analyzed the X-ray spectrum of SAX J1808.4-3658 and they showed the spectrum can be fitted by a three-component model (BB component, Comptonization component and the Compton reflection). In general, spectral modeling is not unique and it is not by chance that our spectral model and global picture are different from that of the GDB. Because at around 0.7 keV the iron is highly ionized we conclude that the observed (see §4 and GDB) is formed as a result of the disk reflection rather than as the NS reflection. . It is worth noting the relatively small optical depth . This can be the main reason why the NS pulsation is detected from this source (see inequality 5). If this is compared with that for other LMXBs sources (showing QPO features) one can find that optical depths for a number of sources are higher than that for SAX J1808.4-3658. They are 10-11 for Cyg X-2 (Kuznetsov 2002), Sco X-1 and GX 340+0, is around 6 for 4U 1728-34 (TBW). On average the seed photon temperature value . Presumably the photon supply for Comptonization mostly comes from the relatively cold disk and the blackbody emission comes from the NS surface. The Comptonization spectra of the QPO sources where the NS pulsations are not observed is indirect evidence for this. van der Klis (2000) argues that there is a striking similarity between the power spectra of black holes, atoll sources, Z sources and the MLP SAX J1808.4-3658. This would exclude any spectral formation models requiring a material surface and would essentially imply the phenomena are generated in the accretion disk around any low-magnetic field compact object. But in the case of SAX J1808.4-3658 we definitely see coherent pulsations of the hard radiation which originates in the NS surface [Cui, Morgan & Titarchuk (1998), hereafter CMT98] and also we should see the downscattering effect of the hard Comptonized photons when they hit the relatively cold material of the NS star (see Fig.1).
5 Downscattering effect
For SAX J1808.4-3658, the observed characteristics of the pulsed X-ray emission (pulse profiles and phase lags) and the overall energy spectrum provide useful insight into X-ray production processes and the emission environment. Important information regarding the density of the NS atmosphere can be extracted from the time lags between different energy bands. The soft lags have been detected for SAX J1808.4-3658 by CMT98444Galloway et al. 2002 also found the hard X-ray pulses arrived up to 770 s earlier the soft X-ray pulses in XTE J0929-314.. The soft phase lag can be due to reflection (Compton downscattering) of the pulsed hard radiation from the NS atmosphere. In fact, this effect is unavoidable when hot plasma streams converges towards the NS magnetic poles. The hard radiation at the pole illuminates adjoining regions where a significant fraction of the hard radiation is reflected. For simplicity we assume the input hard photons are monochromatic with energy . The photons that emerge from the NS atmosphere with lower energy arrive at distant observer later than those with higher energy . The delay in arrival time, , is given by , where is the number of scatterings undergone by the seed hard photon with energy before emerging with energy and is the Thomson mean free path for the photon. The average fractional energy loss for the photon of energy after each scattering is nearly independent of and it is given by (because ), where is the electron rest mass. Integrating over multiple scatterings, we have (ST80). The measured soft lag scales as as shown in Figure 3, and levels off above 10 keV. In Figure 3 we also show the best fit to the data using the downscattering model
| (6) |
We fit the theoretical as a function of to the measured quantities. The best-fit parameters are keV and s-1 keV-1 for which . Because we find that the NS density near the surface is cm-3. The measured soft-lags in the frameworks of the downscattering models allow us to estimate the optical depth up to what the hard photon can penetrate illuminating the NS atmosphere. It takes more than 70 scatterings for 20 keV photon to reach keV energy band. As it is known from the diffusion theory (see e.g. ST80) a photon in the course of the random diffusion propagation to optical depth undergoes on average scatterings. Thus using (the scattering number of the input photons which finally emerge) one can deduce the penetration optical depth . In other words the thickness of the NS reflection slab is approximately grams cm-2. Photoelectric absorption is suppressed at keV and thus one can estimate neglecting the photoelectic extinction. The deduced leads to estimate of the reflection albedo (see e.g. Sobolev 1975). It means that more than 80% of the input hard photons are reflected by the NS atmosphere.
6 Conclusions
Our analysis of the timing and spectral properties of milisecond pulsar SAX J1808.4-3658 and comparison of them with those for LMXB QPO sources leads us to these conclusions: (1) the detection of the NS pulsations from SAX J1808.4-3658 was possible because of the relatively transparent Compton cloud covering in this source (). For the majority of the analyzed LMXBs the Compton cloud optical depth is at least twice as high as that in SAX J1808.4-3658. The high frequency pulsations with frequencies Hz are strongly wiped out by scattering in the clouds with . SAX J1808.4-3658 is a limiting case for this detection. There is a possibility of finding the NS pulsations in the sources that are much less luminous (than these bright QPO LMXBs), because in them the Compton cloud is more transparent () for the NS pulsed radiation. (2) The kHz QPOs rms vs frequency follows the resonance law are weakened by scattering in the Compton cloud. (3) The soft-lag measurements along with the implementation of the downscattering model can provide a tool for density determination near the NS surface.
We appreciate the fruitful discussions with Paul Ray, Sergey Kuznetsov and particularly, with the referee.
References
- Brainerd & Lamb (1987) Brainerd, C. B. & Lamb, F.K. 1987, 317, L33
- Bhattacharya & van den Heuvel (1991) Bhattacharya, D., & van den Heuvel, E. P.J. 1991, Phys. Rep., 203,1
- Chandler & Rutledge (2000) Chandler, A.M.& Rutledge, R.E. 2000, ApJ, 545, 1000
- Cui et al. (2000) Cui, W., Morgan, E.H. & Titarchuk, L. 1998, ApJ, 504, L27 (CMT98)
- Cumming et al. (2001) Cumming, A., Zweibel, E. & Bildsten L. 2001, ApJ, 557, 958
- Galloway et al. (2002) Galloway, D. K. et al. 2002, submitted to ApJ Letters, astro-ph/0206493
- Gierlinski et al. (2002) Gierliǹski, M., Done, C., Barret, D. 2002, MNRAS, 331, 141 (GDB)
- Gilfanov et al. (1998) Gilfanov, M., Revnivtsev, M., Sunyaev, R. & Churazov 1998, A&A, 338, L83
- Heindl & Smith (1998) Heindl, M., & Smith, D.M. 1998, ApJ, 506, L35
- Jonker et al. (2000) Jonker, P.G., et al. 2000, ApJ, 537, 368
- Kuznetsov (2002) Kuznetsov, S. 2002, Astron. Lett. 28, 73
- Kylafis & Klimmis (1987) Kylafis, N.D., & Klimmis, G.S. 1987, ApJ, 323, 678
- Landau & Lifshitz (1971) Landau, L.D. & Lifshitz, E.M. 1971, Mechanics, New York: Pergamon Press
- Markwardt et al. (2002) Markwardt, C. B. et al. 2002, submitted to ApJ Letters, astro-ph/0206491
- Mendez et al. (1999) Mendez, M. et al. 1999, ApJ, 511, L46
- Meszaros et al. (1988) Meszaros, P., Riffert, H., & Berthiaume, G. 1988, ApJ, 325, 204
- Prudnikov et al (1981) Prudnikov, A.P., Bruchkov, Yu.A.,& Marichev, O.I. 1981, Integrals and Series (Moscow: Nauka)
- Sobolev (1975) Sobolev, V.V. 1975, Light scattering in Atmospheres (Oxford: Pergamon)
- Strohmayer et al. (1996) Strohmayer, T.E., et al. 1996, ApJ, 469, L9
- Sunyaev & Titarchuk (1980) Sunyaev, R. & Titarchuk, L., 1980, A&A, 86, 121 (ST80)
- Titarchuk, et al (2001) Titarchuk, L. G., Bradshaw, C.F., & Wood, K.S. 2001, ApJ, 560, L55 (TBW)
- Titarchuk, et al (2001) Titarchuk, L. G., Bradshaw, C.F., Geldzahler, B.J., & Fomalont, E.B. 2001, ApJ, 555, L45
- Titarchuk, Lapidus & Muslimov (1998) Titarchuk, L., Lapidus, I.,& Muslimov, A. 1998, ApJ, 499, 315 (TLM98)
- Titarchuk, (1994) Titarchuk, L. 1994, ApJ, 434, 570
- Vaughan, et al. (1994) Vaughan, B. A., et al. 1994, ApJ, 435, 362
- van der Klis (2000) van der Klis, M. 2000, ARA&A, 38, 717
- Wijnands & van der Klis (1998) Wijnands, R. & van der Klis, M. 1998, ApJ, 507, L63
- Wood et al. (2001) Wood, K.S., et al. 2001, ApJ, 563, 246
- Wood et al. (1991) Wood, K.S., et al. 1991, ApJ, 379, 295
- Wood et al. (1988) Wood, K.S., Ftaclas, C., & Kearney, M. 1988, ApJ, 324, L63
- Zhang et al. (1998) Zhang, W., Smale, A. P., Strohmayer, T.E., & Swank, J.H. 1998, ApJ, 500, L171