HST, VLT, and NTT imaging search for wide companions to bona-fide and candidate brown dwarfs in the Cha I dark cloud ††thanks: Based on observations obtained with the NASA/ESA Hubble Space Telescope in program GO 8716, ESO programs 64.I-0493, 66.C-0022, and 66.C-0310 as well as data taken from the public VLT data archive
We present results from a deep imaging search for companions around the young bona-fide and candidate brown dwarfs Cha H 1 to 12 in the Cha I dark cloud, performed with HST WFPC2 (R, I, H), VLT FORS1 (VRI), and NTT SofI (JHKs). We find 16 faint companion candidates around five primaries with separations between 1.5′′ and 7′′ and magnitudes in R & I from 19 to 25 mag, i.e. up to 8 mag fainter than the primaries. While most of these companion candidates are probably unrelated background objects, there is one promising candidate, namely SW off the M6-dwarf Cha H 5. This candidate is 3.8 to 4.7 mag fainter than the primary and its colors are consistent with an early- to mid-L spectral type. Assuming the same distance (140 pc) and absorption (AI = 0.47 mag) as towards the primary, the companion candidate has (LL. At the age of the primary (1 to 5 Myrs), the faint object would have a mass of 3 to 15 Jupiter masses according to Burrows et al. (1997) and Chabrier & Baraffe (2000) models. The probability for this companion candidate to be an unrelated fore- or background object is , its colors are marginally consistent with a strongly reddened background K giant. One other companion candidate has infrared colors consistent with an early T-dwarf. In addition, we present indications for Cha H 2 being a close () binary with both components very close to the sub-stellar limit. Our detection limits are such that we should have detected all companions above Mjup with separations ( AU) and all above Mjup at ( AU).
Key Words.:
Stars: binaries: visual – individual: Cha H 1 to 12 – low-mass, brown dwarfs – pre-main sequence1 Introduction: Multiplicity of brown dwarfs
Extrasolar planets were detected by indirect methods, but no direct imaging was presented, yet. Imaging of sub-stellar companions around young very low-mass stars or brown dwarfs (rather than around normal solar-type stars) should be less difficult, because young sub-stellar objects are self-luminous due to ongoing contraction and very low-mass stars and brown dwarfs as primaries are intrinsically faint. Hence, the problem of dynamic range (large magnitude difference at small angular separation) is not that severe. Only a few brown dwarfs were detected directly as companions to normal stars so far, mostly around M-dwarfs, the first of which was Gl 229 B (Nakajima et al. 1995, Oppenheimer et al. 1995), and the youngest of which is TWA-5 B (Lowrance et al. 1999, Neuhäuser et al. 2000).
Brandner et al. (2000) undertook an HST and AO survey for sub-stellar companions around T Tauri stars, which we now extend to the M6- to M8-type objects Cha H 1 to 12 in the Cha I dark cloud. We obtained H as well as R- and I-band images with the Hubble Space Telescope (HST) in order to search for wide visual companions around them. These observations are both deeper and have higher spatial resolution than any previous images of these objects. We complement the HST data with archived VRI data from the ESO 8.2m Very Large Telescope (VLT) and new JHKs data from the ESO 3.5m New Technology Telescope (NTT).
With deep imaging of bona-fide and candidate brown dwarfs as presented here, one can, in principle, find binaries comprised of (i) two low-mass stars (as some of the candidate brown dwarfs in the sample could be very low-mass stars), (ii) one brown dwarf and one low-mass star, (iii) two brown dwarfs, (iv) one giant planet and one low-mass star, (v) or one giant planet and one brown dwarf.
So far, only little is known about multiplicity of brown dwarfs: The first binary brown dwarf found was PPl 15, a spectroscopic binary made up of two brown dwarfs in the Pleiades (Basri & Martín 1999). Then, faint companion candidates were detected directly near a few brown dwarfs, namely DENISJ1228.2 (Martín et al. 1999), 2MASSWJ1146 (Koerner et al. 1999), and 2MASSJ0850 (Reid et al. 2001).
Multiplicity parameters of brown dwarfs (like binary frequency, orbit characteristics, mass functions of primaries and secondaries, etc.) will shed light on their as yet uncertain formation mechanism: Do brown dwarf companions form like stellar companions or like planets in circumstellar disks ? Do they form by fragmentation or core growth ? Do isolated brown dwarfs form in isolation or are they ejected from multiple systems ? If brown dwarfs are ejected in the early accretion phase (Reipurth & Clarke 2000), then one should not find any brown dwarfs as companions at ages Myrs. If low-mass companions are ejected during the pre-main sequence phase (c.f. Sterzik et al. 2001), then young brown dwarf companions should be more frequent than old brown dwarf companions, which we can test with our sample of young objects in Cha I.
It is as yet unknown, whether brown dwarfs can have planets and, if so, what their typical separations from the primary objects would be. With several high-resolution spectra obtained with VLT/UVES, Joergens & Guenther (2001) found evidence for radial velocity variations in some of the Cha H objects, which could be due to giant planets or surface features.
In Sect. 2, we will present the properties of the targets. In Sect. 3, details about the HST observations and data reduction are given. The complementary VLT and NTT observations are presented in Sect. 4. The background contamination is estimated in Sect. 5. Properties of the most promising companion candidate are discussed in Sect. 6. In Sect. 7, we present indications for one of the primaries being a very close binary pair. We conclude with a brief discussion in Sect. 8.
2 Our targets: Cha H 1 to 12
The Cha I dark cloud is a site of ongoing low- and intermediate mass star formation at to 160 pc. Most of the known members are pre-main sequence T Tauri stars, but there is also one known intermediate-mass Herbig A0e star (HD 97048) and several M6- to M8-type bona-fide and candidate brown dwarfs. The latter objects (Cha H 1 to 12) were found in deep infrared (IR), H, and X-ray surveys (Neuhäuser & Comerón 1998, 1999; Comerón et al. 1999, 2000, henceforth C1999 & C2000), e.g. Cha H 1 was the first X-ray detected brown dwarf. With ground-based optical and near-IR data as well as mid-IR data from ISO (C2000, Persi et al. 2000), Natta & Testi (2001) show that Cha H 1, 2, and 9 have IR excess emission indicative for circumstellar material like disks. Also, Wilking et al. (1999) and Muench et al. (2001) found evidence for circumstellar material around young brown dwarfs in Oph and the Trapezium, respectively.
Based on their location in the H-R diagram and comparison with different theoretical isochrones, Cha H 1 to 12 are roughly co-eval, namely Myrs according to Baraffe et al. (1998) and to 10 Myrs according to Burrows et al. (1997). The M7.5-M8 type objects Cha H 1, 7, 10, and 11 are clearly located below the sub-stellar limit and, hence, were classified as bona-fide brown dwarfs, while the other Cha H objects are candidate brown dwarfs (C2000). The brightest of them, Cha H 1 to 8 and 12, are known to show Lithium absorption and radial velocity consistent with membership to the Cha I T association (Neuhäuser & Comerón 1999, Joergens & Guenther 2001), the others were not observed with high resolution, yet, because of their faintness. Previously, none of the bona-fide and candidate brown dwarfs Cha H 1 to 12 observed here were known to be multiple.
3 HST observation and data reduction
In program 8716, we obtained deep imaging with the HST Wide Field Planetary Camera No. 2 (WFPC2) filters F656N (H), F675W (R-band), and F814W (I-band). We performed the HST observations in the optical (rather than in the IR), because NICMOS was not available during the last HST cycle. For our WFPC observations, the two reddest broad-band filters were used (R & I, because substellar objects are red) as well as the H filter; the latter was used, because all the primary objects Cha H 1 to 12 show H emission, so that any additional faint object with H emission would be a good candidate for a hithertoo unknown brown dwarf.
Faint companions to any of the targets would be sub-stellar, because all our (as yet unresolved) targets are located either below or very close to the sub-stellar limit, so that any much fainter, i.e. lower-mass companion would certainly be sub-stellar.
Because of missing guide stars (all targets are located inside the dark cloud Cha I), Cha H 6 could not be observed. All other eleven targets were observed.
Whenever possible, we placed several objects in the field-of-view of the WFPC chips to maximize the efficiency. Isolated objects were placed onto the PC chip for better angular resolution: The PC chip has a 0.0455′′/pixel scale, the WF chips have a scale of 0.0996′′/pixel. In total, we observed in eight HST orbits in 2000 and 2001. See Table 1 for the HST observation log.
| Object | filter | exposure | JD |
| in Cha I | [seconds] | date | |
| H 1 & 7 | F656N (H) | 2 500 | 2451952 |
| F675W (R) | 2 100 | 12 Feb 2001 | |
| F814W (I) | 2 100 | ||
| H 2 & 9 | F656N (H) | 2 500 | 2451842 |
| F675W (R) | 2 100 | 25 Oct 2000 | |
| F814W (I) | 2 100 (**) | ||
| H 3 | F656N (H ) | 2 700 | 2451733 |
| F675W (R) | 300 + 80 | 8 Jul 2000 | |
| F814W (I) | 160 + 40 | ||
| H 4,10,11 | F656N (H) | 4 500 | 2451783 |
| & 8 (***) | F675W (R) | 2(300+100) | 27 Aug 2000 |
| F814W (I) | 2(300+100) | ||
| H 5 | F656N (H) | 2 700 | 2451778 |
| F675W (R) | 300 + 80 | 22 Aug 2000 | |
| F814W (I) | 160 + 40 | ||
| H 8 | F656N (H) | 2 700 | 2451752 |
| F675W (R) | 300 + 80 | 27 Jul 2000 | |
| F814W (I) | 160 + 40 | ||
| H 12 | F656N (H) | 2(260+70) | 2451914 |
| F675W (R) | 2(10+40) | 05 Jan 2001 | |
| F814W (I) | 2(10+40) |
Remarks: (*) There are no other (archived or scheduled) HST observations with any of the targets in the field-of-view (as of Sept. 2001). (**) The observations in the I filter failed due to technical problems, hence no data in I. (***) Cha H 8 and a few of its companion candidates were again in the field of these observations, namely at the edge of chip WF2.
Data reduction was performed with the IRAF111IRAF is distributed by the National Optical Astronomy Observatories, which is operated by the Association of Universities for Research in Astronomy, Inc. (AURA) under cooperative agreement with the National Science Foundation. package stsdas written for HST data. All exposures (for each field and each filter) were split into two to four to facilitate for cosmic ray rejection. After rejection of cosmic rays with crrej, we co-added the data. Mostly, the background was very small ( count), because the targets are in the dark cloud Cha I, while the background was slightly higher near the bright (V=8.5 mag) A0e star HD 97048.
Source detection was done by visual inspection. A faint, non-extended object near any of the targets, i.e. within one or a few arc sec, can in principle be either a real companion or an unrelated fore- or background object. Since we have no information, yet, on the spectra or proper motions of these faint objects, all of them have to be regarded as companion candidates, unless companionship can already be ruled out from color or extension. For the maximum separation between a primary target and a potential companion, we allow for (more or less arbitrarily) 1000 AU, which is at the distance of Cha I ( to 160 pc). Hence, in Table 2, we list only those faint objects, which are found within 7′′ around the Cha H targets, while other faint objects are regarded as unrelated objects most likely located in the background of Cha I. The observed background population is used in section 5 for a rough estimation as to how likely the companion candidates are true companions rather than unrelated objects.
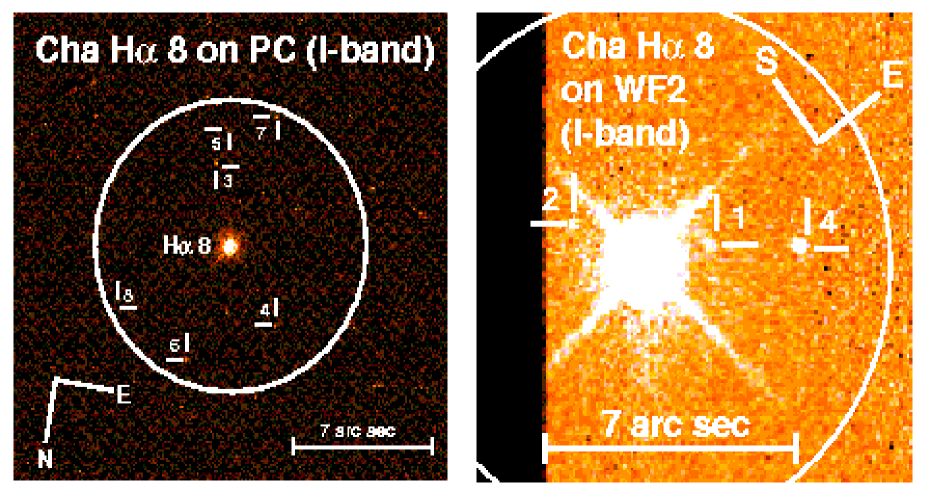
In Figs. 1 and 2, we show the HST I-band images of those Cha H objects, where several companion candidates were detected within 7′′, namely Cha H 4, 10, & 11 (Fig. 1) and Cha H 8 (Fig. 2), while Cha H 5 is shown in Figs. 8 to 10. The faint companion candidates are labeled with their cc numbers given in Table 2 (cc for companion candidate). The companion candidates Cha H 8/cc 1 & 2 are detected only in the observation which mainly aimed at Cha H 4, 10, and 11, where Cha H 8 was located at the edge of chip WF2. Because one of the main targets, Cha H 6, was not observable due to the lack of guide stars, we assigned the extra observing time (one more orbit) for the observation with Cha H 4, 10, & 11 on the chip WF4, because of the large number of primaries observable simultaneously. Only due to the increased exposure time (800 sec compared to 200 sec in the I-band), the faint companion candidates Cha H 8/cc 1 & 2 were detected. They are detected only in I, see Fig. 2. Due to the longer exposure time in this observation, Cha H 4 got saturated in I.
| Object | other name | HST | separation [′′] | |
| designation | chip | |||
| 110717.0-773454 | Cha H 1 | WF4 | primary | M7.5 |
| 110743.0-773359 | Cha H 2 | WF4 | primary | M6.5 |
| 110752.9-773656 | Cha H 3 | PC | primary | M7 |
| 110819.6-773917 | Cha H 4 | WF4 | primary | M6 |
| 110819.7-773918 | H 4/cc 1 | WF4 | 2.0 E | 1.3 S |
| 110819.5-773920 | H 4/cc 2 | WF4 | 1.4 W | 3.3 S |
| 110819.8-773918 | H 4/cc 3 | WF4 | 3.5 E | 1.3 N |
| 110825.6-774146 | Cha H 5 | PC | primary | M6 |
| 110825.5-774147 | H 5/cc 1 | PC | 1.0 W | 1.1 S |
| 110840.2-773417 | Cha H 6 | not observed | M7 | |
| 110738.4-773530 | Cha H 7 | WF2 | primary | M8 |
| 110747.8-774008 | Cha H 8 | PC | primary | M6.5 |
| 110747.9-774007 | H 8/cc 1 | WF2 | 1.4 E | 1.3 N |
| 110747.8-774010 | H 8/cc 2 | WF2 | 0.4 W | 2.3 S |
| 110747.7-774012 | H 8/cc 3 | PC | 1.3 W | 4.0 S |
| 110748.0-774004 | H 8/cc 4 | PC | 2.9 E | 3.5 N |
| 110747.7-774014 | H 8/cc 5 | PC | 0.8 W | 5.8 S |
| 110747.6-774003 | H 8/cc 6 | PC | 3.0 W | 5.3 N |
| 110747.9-774015 | H 8/cc 7 | PC | 1.7 E | 6.7 S |
| 110747.4-774006 | H 8/cc 8 | PC | 6.6 W | 2.4 N |
| 110719.2-773252 | Cha H 9 | WF2 | primary | M6 |
| 110825.6-773930 | Cha H 10 | WF4 | primary | M7.5 |
| 110825.8-773930 | H 10/cc 1 | WF4 | 3.4 E | 0.3 S |
| 110825.7-773927 | H 10/cc 2 | WF4 | 2.2 E | 3.2 N |
| 110825.3-773932 | H 10/cc 3 | WF4 | 5.2 W | 1.7 S |
| 110830.8-773919 | Cha H 11 | WF4 | primary | M8 |
| 110830.6-773915 | H 11/cc 1 | WF4 | 2.7 W | 4.0 N |
| 110637.4-774307 | Cha H 12 | WF4 | primary | M7 |
Aperture photometry was obtained for all objects (detected by visual inspection) with a 0.5′′ radius with a source-free background field annulus located around the measured object. The counts were transformed to magnitudes using
| (1) |
with the number of counts DN, the exposure time exp in seconds, and the zero point ZP; the subtraction of 0.1 mag is to correct from the 0.5′′ radius to the infinite aperture; all according to the HST data reduction manual.222http://www.stsci.edu/documents/dhb/web
Magnitudes obtained with Eq. (1) have still to be corrected for the charge-transfer-efficiency (CTE) loss. This was done according to Whitmore et al. (1999) with the number of counts, the observational date, the background level, and the (x,y) pixel position of the source peak as inputs. The CTE corrections are especially important for weak sources such as the brown dwarf companion candidates expected in our program. The final values are given in Table 3.
| Object | V | RC | m(F675W) | IC | m(F814W) | J | H | Ks | m(F656N) | Wλ(H) |
| (VLT) | (VLT) | (HST RV) | (VLT) | (HST IV) | (HST H) | [Å] | ||||
| Cha H 1 | 21.0 | 18.7 | 18.96 | 16.17 | 16.16 | 13.55 | 12.78 | 12.28 | 17.72 | 35-99 |
| Cha H 2 | 19.8 | 17.60 | 17.42 | 15.08 | n/o | 12.59 | 11.43 | 11.15 | 16.76 | 32-71 |
| Cha H 3 | 19.51 | 17.38 | 17.27 | 14.89 | 14.97 | 12.46 | 11.64 | 11.11 | 16.81 | 5-14 |
| Cha H 4 | 18.52 | 16.70 | 16.68 | 14.34 | sat. | 12.19 | 11.38 | 11.09 | 16.69 | 5-11 |
| H 4/cc 1 | 23.0 | |||||||||
| H 4/cc 2 | 24.1 | 22.2 | 18.5 | 17.4 | 17.3 | |||||
| H 4/cc 3 | 23.0 | 21.6 | 21.7 | 20.4 | 20.2 | 17.7 | 16.7 | 16.2 | ||
| Cha H 5 | 19.18 | 17.14 | 17.03 | 14.68 | 14.67 | 12.14 | 11.21 | 10.56 | 16.62 | 8-11 |
| H 5/cc 1 | 23.1: | 21.1: | 21.22 | 19.0: | 19.20 | 16.8: | 15.0: | 14.4: | ||
| Cha H 6 | 19.75 | 17.60 | n/o | 15.13 | n/o | 12.43 | 11.61 | 11.09 | n/o | 59-76 |
| Cha H 7 | 22.2 | 19.5 | 19.69 | 16.86 | 16.78 | 13.89 | 13.00 | 12.51 | 19.02 | 35-45 |
| Cha H 8 | 20.1 | 17.96 | 17.84 | 15.47 | 15.50 | 12.9 | 12.0 | 11.4 | 17.46 | 8-9 |
| H 8/cc 1 | 23.4 | |||||||||
| H 8/cc 2 | 23.6 | |||||||||
| H 8/cc 3 | 23.2 | 22.7 | 21.3 | 21.3 | 18.8 | 16.7 | 15.8 | |||
| H 8/cc 4 | 22.9 | 22.9 | 21.5 | 21.7 | 19.9 | 17.8 | 17.0 | |||
| H 8/cc 5 | 21.7 | |||||||||
| H 8/cc 6 | 23.1 | 22.6 | ||||||||
| H 8/cc 7 | 22.9 | 22.5 | 21.0 | 21.0 | 18.4 | 16.8 | 15.4 | |||
| H 8/cc 8 | 22.6 | |||||||||
| Cha H 9 | 23.1 | 20.1 | 20.05 | 17.34 | n/o | 13.92 | 12.59 | 11.82 | 20.02 | 16 |
| Cha H 10 | 21.6 | 19.4 | 19.35 | 16.90 | 16.79 | 14.41 | 13.68 | 13.30 | 19.21 | 9 |
| H 10/cc 1 | 23.3 | 21.7 | 21.8 | 19.0 | 17.6 | 17.1 | ||||
| H 10/cc 2 | 24.9 | 22.9 | ||||||||
| H 10/cc 3 | 23.0 | 23.0 | 21.4 | 21.5 | 19.6 | 18.5 | 17.9 | |||
| Cha H 11 | 21.9 | 19.9 | 19.69 | 17.35 | 17.41 | 14.72 | 14.03 | 13.60 | 18.95 | 23 |
| H 11/cc 1 | 23.4 | 22.2 | 22.2 | 21.1 | 19.3 | 18.7 | ||||
| Cha H 12 | 20.6 | 18.3 | 18.34 | 15.58 | 15.72 | n/o | n/o | n/o | 18.03 | 20 |
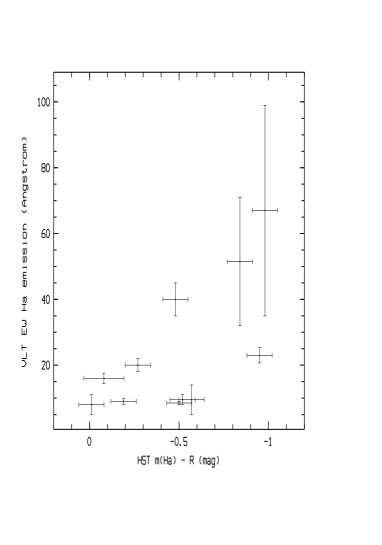
A comparison of the HST H magnitudes with previously known gound-based VLT H equivelent widths (C2000) shows a clear trend (see Fig. 3), with a scatter indicating strong H variability, not unexpected for such young objects. In Fig. 3, we plot the ground based H equivalent width versus the difference between HST H and R-band magnitude, to really compare the H line flux above the continuum with the equivalent width.
4 Ground-based imaging with VLT and NTT
We also used archived VRI data333obtained after commissioning of FORS1 before the start of normal operations; the data can be retrieved from the public VLT data archive; see C2000 for details, where the same data were used to estimate the VRI values of Cha H 1 to 12 obtained with the FOcal Reducer/low dispersion Spectrograph No. 1 (FORS1) at the ESO 8.2m telescope Antu, Unit Telescope 1 (UT1) of the VLT, with a scale of /pixel, during sub-arc sec conditions. See Table 4 for the observations log.
We re-reduced the ground-based images. Some companion candidates were also detected in the VLT VRI images, magnitudes are given in Table 3. Comparison of the HST R & I magnitudes (Vega system) for all the Cha H 1 to 12 objects with the previously known ground-based R & I magnitudes (Cousins bands) from C2000 shows that they agree well ( mag).
| Instr. | Cha H | filter | exp. | date | FWHM |
| FORS1 | 4,5,8,10,11 | V | 60s | 26 Jan 1999 | 0.78” |
| FORS1 | 4,5,8,10,11 | R | 60s | 26 Jan 1999 | 0.87” |
| FORS1 | 4,5,8,10,11 | I | 60s | 26 Jan 1999 | 0.80” |
| SofI | 4,5,8,10,11 | H | 200s | 14 Mar 2000 | 0.68” |
| SofI | 4,5,8,10,11 | Ks | 200s | 14 Mar 2000 | 0.58” |
| SofI | 4,10,11 | J | 600s | 3 Mar 2001 | 0.60” |
| SofI | 4,10,11 | H | 1200s | 3 Mar 2001 | 0.58” |
| SofI | 4,10,11 | Ks | 5400s | 3 Mar 2001 | 0.73” |
| SofI | 5 | J | 600s | 7 Mar 2001 | 0.74” |
| SofI | 5 | Ks | 5400s | 4 Mar 2001 | 0.58” |
| SofI | 8 | J | 600s | 3 Mar 2001 | 0.64” |
| SofI | 8 | H | 1200s | 3 Mar 2001 | 0.72” |
IR images in JHKs were obtained using the IR imager Son of Isaac (SofI) at the ESO 3.5m NTT on La Silla with to 0.7′′ seeing. Images of three fields were taken in March 2001 with the small SofI field to achieve the highest angular resolution possible (/pixel) with 2 sec individual exposure per frame. Two more images (H & Ks) were already taken in March 2000 with the large SofI field (/pixel), so that several Cha H primaries were in the field-of-view, with 3 sec individual exposure per frame. Darks, flats, and standards were taken in the same nights, and we performed standard data reduction with eclipse444see www.eso.org/projects/aot/eclipse/ and MIDAS.555see www.eso.org/projects/esomidas/ See Table 4 for the observations log and Table 3 for the JHKs magnitudes. Our JHKs data for the primaries (Table 3) agree well with those given in C2000, who had obtained their data with IRAC2 at the ESO/MPG 2.2m.
The new IJKs data listed in Table 3 for the primaries also agree well with the DENIS magnitudes listed in Neuhäuser & Comerón (1999) for Cha H 1 to 8. The H-band magnitude of Cha H 8 (Table 3) was not known before, as this object was not observed in the IR by C2000 and as the H-band filter is not used for DENIS. The J & Ks magnitudes for Cha H 8 given in Table 3 (from the March 2000 image) agree with the DENIS magnitudes given in Neuhäuser & Comerón (1999).
Most of our ground-based VRIJHKs magnitudes were determined by normal aperture photometry, with the exception for the VRIJ-band images for the very close companion candidate near Cha H 5, which is discussed in detail in Sect. 6.
Lower limits to the magnitudes for undetected objects are derived from mean background intensity (and its variation) from pixels (for HST images) and pixels (for ground-based images) around the pixel, where the peak of the companion candidate should be located according to its position. The limits given correspond to an intensity of above the mean background. No additonal companion candidates (within 7′′) were detected in the ground-based images.
5 Real companions or background objects ?
A first check, whether or not a companion candidate may be truely bound (hence at the same distance and age as primary), i.e. whether or not it is as cool as expected from the magnitude difference, can be done with the optical and IR colors. For several companion candidates, one can find a solution for the observed magnitudes and colors for either a moderately reddened L- or T-type companion or, alternatively, for a highly reddened background star. In the next section, we go through such an estimate for the companion candidate near Cha H 5.
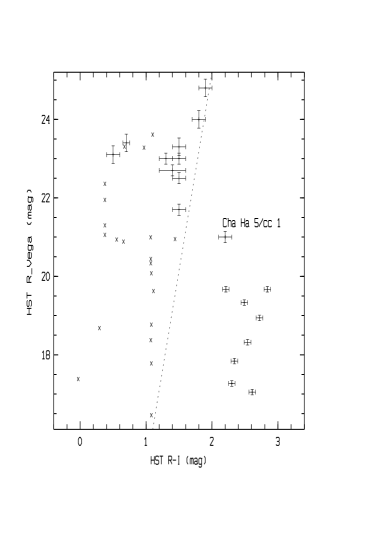
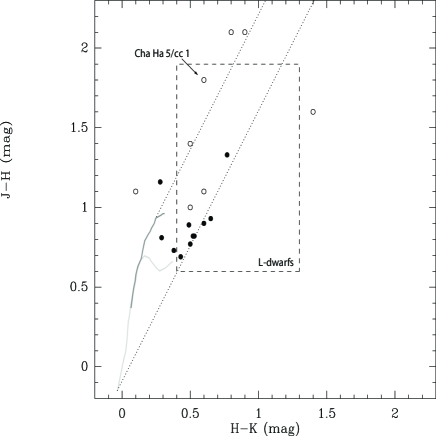
Figs. 4 and 5 show that most companion candidates have colors similar to background giants, while some of them have colors which are (also) consistent with L-dwarfs. Of those, Cha H 5/cc 1 has the smallest separation and is therefore the best companion candidate (see next section for a detailed discussion of this object). Given their faint magnitudes, all these companion candidates would have masses around or below the deuterium burning limit. For such low masses, they should be very faint and red in the optical. However, with the possible exception of Cha H 5/cc 1 and Cha H 4/cc 2, they are all too bright in R & I given their JHKs values, so that they are probably reddened background giants or extragalactic. Cha H 8/cc 7 is located in the area of IR excess (Fig. 5), possibly indicating circumstellar material.
Another possibly interesting object is Cha H 4/cc 2 with JH = and HK mag, the bluest in HKs in Fig. 5. The T3-dwarf SDSSpJ102109.69-030420.1 has similar (2MASS) colors according to Burgasser et al. (2001), namely JH = and HK mag666but somewhat different colors according to Leggett et al. (2002), namely JH and HK mag. If this object would really be an early T-dwarf companion, it would definitely be a planetary mass-object. Its separation, however, is 3.6′′, i.e. AU at 140 pc, larger than expected for planets.
Whether a certain companion candidate really is a bound companion or not, can be checked by spectroscopy (whether the atmosphere is as cool as expected) or proper motion (whether primary and companion are co-moving). For some of the HST companion candidates detected also in the ground-based images, we do have already several epochs. However, in the ground-based images, we cannot measure the separation between the primaries and their faint companion candidates as precise as in the HST images (only to pixels in the ground-based images), so that we cannot yet measure their proper motions. We can only say that the ground-based separations are not inconsistent with those measured in the HST images.
The typical proper motion of other Cha I T Tauri stars is mas/yr and mas/yr (Frink et al. 1998, Teixeira et al. 2000). The proper motions of Cha H 1 to 12 are not known, yet, but we can assume that they are similar to other members, because several other indicators show that Cha H 1 - 12 are members; e.g. they share the typical radial velocity with other Cha I members (Joergens & Guenther 2001). Given the R- & I-band HST PC images, we can measure the separation between primary and companion candidate to mas (see below). Hence, with the HST PC pixel scale (45.5 mas), we can check for common proper motion after a few years.
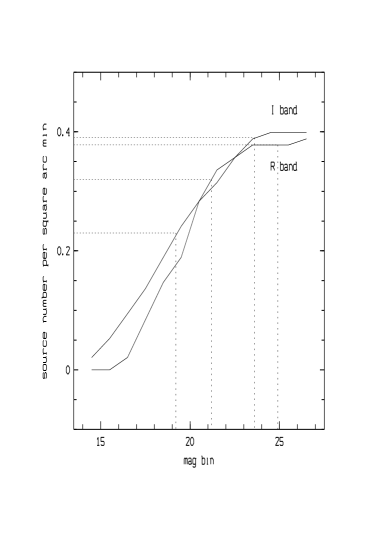
We compiled the R & I magnitudes of all objects detected in the seven HST images. From the number of objects brighter than a particular companion candidate (Fig. 6), we can estimate the background probability.
Lets discuss as example the close companion candidate near Cha H 5: There are in total 0.32 (0.23) objects per square arc minute detected in R (and I, respectively) with magnitude brighter than Cha H 5/cc 1 (R=21.2 and I=19.2), see Fig. 6 for the N- S of all detected HST sources (primaries, companion candidates, and other certainly unrelated objects). Hence, the probability to find one such faint object within around at least one target in an ensemble of eleven Cha H primaries observed is in R (and in I), i.e. quite small. See also Fig. 8, where it is shown that no other faint objects are detected in the whole PC field-of-view around Cha H 5.
In the same way, we estimated the background probabilities for all other companion candidates listed in Table 3. They range from the values mentioned above () for the brightest companion candidate (Cha H 5/cc 1 at 1.5′′ separation) up to (at 7′′ separation) for the faintest detected companion candidates, Cha H 10/cc 2 and Cha H 8/cc 2. Given the whole ensemble with eleven primaries observed with HST and 16 detected companion candidates, we can expect a few real companions.
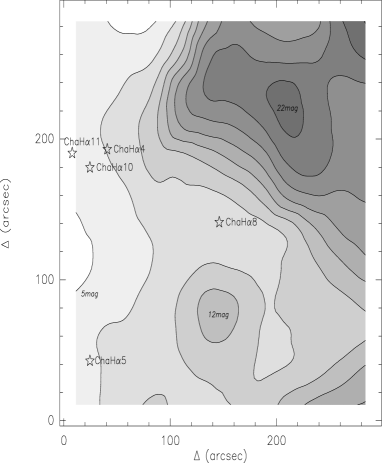
Following the methodology of Lada et al. (1994) we computed the extiction map of the target field making use of the H and Ks band images taken with SofI. The known foreground stars and embedded cloud members (see C1999 and C2000) were not used in computing this map. Because there were no observations of the unreddened background stellar field (necessary for the determination of the zero point of the extinction scale), we adopted a HK color for this background. Regarding this choice, Alves et al. (1998) found HK mag towards a complicated region in Cygnus, essentially at the Galactic plane, while Alves et al. (2001) found HK mag towards a clean line-of-sight towards the Galactic bulge, at . The stellar background towards the Chamaeleon complex is probably even better behaved, because it lies at . On the other hand, the HKs color of the North Galactic pole from 2MASS data is also mag (M. Lombardi, private communication), so we decided to adopt this as the mean Chamaeleon background color. We also adopt a conservative intrinsic dispersion in this measurement of 0.13 mag, i.e. an intrinsic extinction measurement rms of A mag.
We show our map in Fig. 7 for the area around Cha H 4, 5, 8, 10, and 11, where companion candidates were detected. The spatial resolution of the map is 50′′ and the extinction AV ranges from 4 to 22 mag. Each position of this map is associated with a total extinction which includes the whole Cha I dark cloud and its fore- and background.
C2000 derived the individual reddening by comparing the observed colors to intrinsic colors for the known spectral types. Those absorptions range from A to 1.0 mag (C2000) and are smaller than the extinction values towards their immediate background, as measured in the extinction map. The total extinction towards the immediate background of the primaries shown in Fig. 7 range from A 6 to 8 mag. Hence, the primaries are most certainly located near the front edge of the dark cloud.
6 The promising candidate near Cha H 5
Cha H 5 is an M6 dwarf with H and X-ray emission as well as Lithium absorption; no radial velocity variations were detected in UVES spectra, consistent with membership to the Cha I association (C1999, C2000; Joergens & Guenther 2001). Based on a comparison of its location in the H-R diagram with different tracks and isochrones, Cha H 5 has a mass of M⊙ and an age of Myrs, i.e. co-eval with the other M6- to M8-type objects Cha H 1 to 12 (C2000). Hence, it is either a very low-mass T Tauri star or a relatively massive brown dwarf.
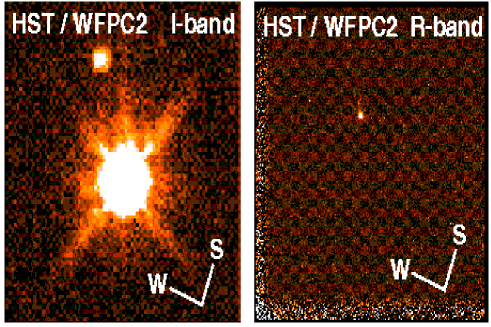
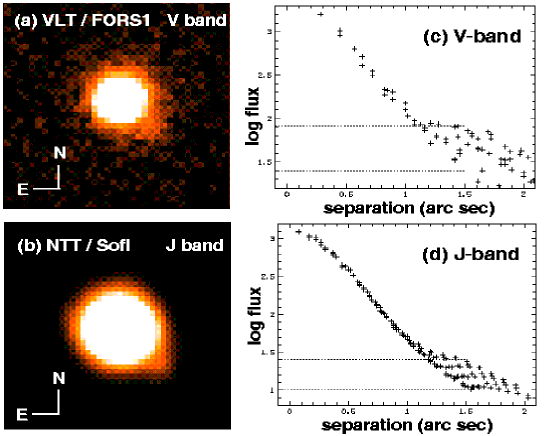
A faint companion candidate is located S and W of Cha H 5, i.e. at a separation of with a position angle of (taking into account an uncertainty of in the N-S alignment of the detector), identical in both the R- and I-band image. The companion candidate is not detected in H, while all primary objects including Cha H 5 are detected. The HST R- and I-band images of Cha H 5 with its faint companion candidate are shown in Fig. 8. The companion candidate is also marginally resolved in the ground-based VRIJHKs images (Figs. 9 and 10). In the ground-based image, where it is resolved best, the SofI Ks-band image from March 2001, the separation measured is at a position angle of , i.e. much less precise than the HST data, but not inconsistent with low differential proper motion.
In the H- and Ks-band images (Fig. 10), we could obtain the magnitude of the companion candidate by normal aperture photometry. However, in the VRIJ images, this was not possible, because of the even higher dynamic range.
In the V- and J-band images, we first obtained the flux in each pixel within 4′′ of the center of the primary, then plotted the flux as a function of the separation to the primary (Fig. 9, right panels). Those functions are a superposition of two Moffat functions (Moffat 1969), one for the bright primary and one for the faint companion candidate located in the wing of the primary’s PSF, both with the same FWHM. The faint companion candidate is detected as a small bump in the primary’s PSF. Then, we derived the peak flux of the companion candidate at 1.5′′ separation from the primary by subtracting the flux value of the upper envelope by the flux value of the lower envelope, both at 1.5′′. From this flux and the peak flux of the primary, we derived the magnitude difference between primary and companion candidate. The same procedure was performed for the VLT R- and I-band images, where the companion candidate is also detected in the PSF wing. The magnitudes derived from these VLT R- and I-band images are consistent with the HST data, where the companion candidate is well detected and well resolved from the primary ( mag in R and mag in I). Hence, we can trust our procedure.
For the line-of-sight absorption in the direction of Cha H 5, we measure A mag (see Fig. 7), i.e. several times more than foreground to Cha H 5 (AV = 0.98 mag, C2000). Appart from the fact that this object could be a true companion, we have to consider several alternatives:
-
•
The VHKs colors of the companion candidate are consistent with a K giant reddened by A mag, which would be located at kpc, i.e. kpc from the galactic plane, but its dereddened JH color is redder than a K giant.
-
•
The unreddened optical colors of the companion candidate are consistent with those of an M5-6 dwarf, which would lie foreground to the extinction. However, the H & Ks flux would be too bright and the VH and VKs colors would be redder than a M5-6 dwarf. The bright H and Ks fluxes could be IR excess due to circumstellar material, but such strong excess ( mag in H and Ks) was never observed for a mid-M type star.
-
•
If the object would be a moderately extincted (A mag) late M-dwarf in the background, its optical colors would be too blue for a late M-dwarf.
Hence, the companion candidate is unlikely to be a background giant or a foreground dwarf. As discussed in the previous section, a background object is very unlikely anyway. Even considering the whole ensemble observed, the probability to find one such object within of one our targets is . The probability for the object being a foreground dwarf will be considered below.
For a companion to Cha H 5, we can assume the same extinction as towards the primary (AI = 0.47 mag, C2000). The error should be mag, as estimated from the errors in R and I. With the Rieke & Lebofsky (1985) extinction law, we can then estimate dereddened colors (Table 5), to be compared with intrinsic colors of late-M and L dwarfs (see e.g. Kirkpatrick et al. 1999 & 2000, henceforth K1999 and K2000). Few V-band magnitudes of L-dwarfs are available so far, so that we could not compare our object to typical L-dwarfs in this regard. The comparison of RIJHKs colors in Table 5 shows that a spectral type of early- to mid-L is most likely for our object. The observed magnitude difference between the M6 primary and its companion of 3.8 to 4.7 mag and also its non-detection in H are consistent with spectral type L (K1999, K2000). As seen in Table 5, neither all the observed nor all the dereddened colors are perfectly consistent with any single spectral type sub-class, but this is not surprising, because all (or most) known L-dwarfs are much older and more massive, and evolutionary effects in the atmosphere are expected. The RIJKs colors of our companion candidate are consistent with those of young early-L dwarfs in Ori (Bejar et al. 1999).
| dereddened | mean | best | possible | ref. | |
|---|---|---|---|---|---|
| color [mag] | L0 | guess | range | ||
| (RI)0 | 2.0 | M7 | M6 - L2 | 5 | |
| (RKs)0 | 6.0 | M8 | M6 - L2 | 5 | |
| (IJ)0 | 2.5 | M8 | M8 - L4 | 1,3 | |
| (IH)0 | 3.5 | L1 | M9.5-L1.5 | 5 | |
| (IKs)0 | 4.2 | L0 | M9 - L4 | 1,5 | |
| (JH)0 | 1.0 | L5 | L4 - L8 | 2-4 | |
| (JKs)0 | 1.4 | L5 | L2 - L8 | 1-4 | |
| (HKs)0 | 0.6 | L1 | L0 - L5.5 | 2,4,5 |
Ref.: (1) K1999, (2) K2000 (3) Leggett et al. 2002, (4) Burgasser et al. 2001, (5) astro.nmsu.edu/~crom/bdwarfs
The Cha H 5 companion candidate could also be an isolated young L dwarf in the Cha I association, rather than a companion of Cha H 5. This is, however, very unlikely: Even if there are 10 times more L-dwarfs in Cha I than M-dwarfs (there are 19 M-dwarfs known in Cha I), then we would expect to find in total 0.01 L-dwarfs within around the eleven Cha H objects observed.
There is an L2.5 dwarf with similar color7772MASS091838.2+213406 with I , K, and HK mag at pc (K1999), so our object could be an old foreground L2.5 dwarf. Reid et al. (1999) expect 4634 L-dwarfs with K mag on the whole sky, so the probability to find one L-dwarf within of the eleven Cha H objects observed is .
With an estimated spectral type of L, the temperature is to 1400 K (K1999, K2000, Basri et al. 2000, Burgasser et al. 2001). For the age, we assume 1 to 5 Myrs, as the age of Cha H 5 according to Burrows et al. (1997) and Baraffe et al. (1998) models, see C2000.
If we use B.C. mag as given by C2000 for M8 also for our companion candidate, then we obtain LL. With B.C. mag as given by Leggett et al. (2002) for L1, we obtain LL. Considering the magnitude difference in VRIJHKs between primary and companion being 3.8 to 4.7 mag and the primary having LL (C2000), the companion has LL to . Hence, we will use (LL.
This luminosity, T to 2200 K, and an age of 1 to 5 Myrs is consistent with a to 15 Mjup mass object according to table 3 and figures 7, 9, and 11 in Burrows et al. (1997). According to figures 6 and 7 in Chabrier & Baraffe (2000), an object with the given Lbol, Teff, and age would have a mass of to 15 Mjup. Hence, the faint object could be a planet or a brown dwarf, if really a companion of Cha H 5. However, all these models may be uncertain at this very young ages, because they start after the formation with assumed thermal structures. Grey dynamical calculations of the formation process locate this candidate between the tracks of a young 10 Mjup and a 1 Msat protoplanet (G. Wuchterl, pers. comm.).
The separation between Cha H 5 and its possible companion is corresponding to a projected physical separation of 210 AU (at 140 pc), i.e. larger than expected for planets, but not larger than typical circumstellar disks. Such a large separation should not be excluded, not even for planetary companions, because of possible dycamical interaction between proto-planets (by which one gets kicked out) and also, because some of the radial velocity planet candidates have large eccentricities, i.e. are located at large separations most of the time.
Confirmation of this candidate as true companion can be done best and soon by spectroscopy, which is scheduled for the VLT for early 2002. If confirmed as true companion, this object may be the lowest-mass companion ever detected by direct imaging.
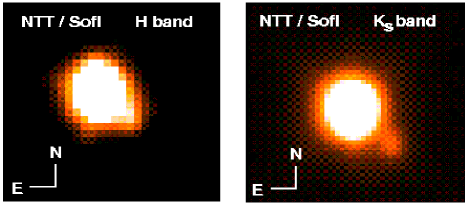
7 Is Cha H 2 a close binary ?
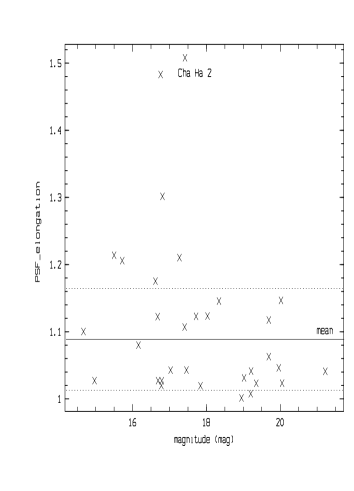
In the previous sections, we investigated wide companions, which were clearly resolved, at least in the HST images. To search for very close companions, we determined possible elongations of the point-spread-functions (PSF) of the primaries, measured as ratio between the Full Width at Half-Maximum (FWHM) in the direction of the strongest elongation and the FWHM in the direction perpendicular to the elongation. In Fig. 11, we plot the observed PSF elongation versus the magnitude for all measurements in R, I, and H.
While most PSFs are consistent with a single point source (elongation ), there is one notable outlyer, namely Cha H 2, where the PSF for both the R- and H observation is elongated by a factor of towards the NE-SW direction (not observed in I due to technical problems with WFPC2 shutter). All three other sources detected on chip WF4 (like Cha H 2) as well as Cha H 9 (on WF2 chip in the same observation) are consistent with point sources. The Cha H 2 PSFs are deviant from the other Cha H primaries. Hence, we do have an indication for Cha H 2 being a close binary.
Cha H 2 is elongated in the same direction in both R and H. Investigating the R-band image of Cha H 2 in more detail shows that the SW component is a factor of brighter than the NE component, where the flux of the fainter component still includes the flux of the brighter one at that separation. After subtracting the PSF of the brighter (SW) component, the NE component is fainter by mag. The position angle of the NE companion candidate relative to the SW primary is (measured as usually from N to E), and the separation between the close pair is almost , i.e. slightly less than two pixels. As unresolved object, Cha H 2 has R mag (Table 3), so that the two components would have and mag in RV. The probability to find an R mag object with separation by chance around 11 primaries observed is only (obtained from Fig. 6).
Even though the PSF elongation of Cha H 2 is cleary larger than in all other objects, we regard it as candidate binary. See Fig. 12 for the HST image of this object. We cannot completely exclude that the apparent elongation could be due to, e.g., bad pixels. Further obvervations are needed to confirm the apparent elongation. The ground-based FORS1 and SofI images do not have sufficient resolution to detect this elongation.
Cha H 2 is located close to the sub-stellar limit, i.e. either a very low-mass star or a relatively massive brown dwarf, according to both Burrows et al. (1997) and Baraffe et al. (1998) tracks, see C2000. As approximately equal-brightness and, hence equal-mass binary, both components would still be very close to the sub-stellar limit, i.e. either low-mass stars or brown dwarfs. More precise imaging photometry (e.g. with the PC or with NICMOS) and resolved spectroscopy may resolve this issue. A separation of only would correspond to only AU at 140 pc, so that one could hope to see orbital motion within a few decades.
8 Discussion
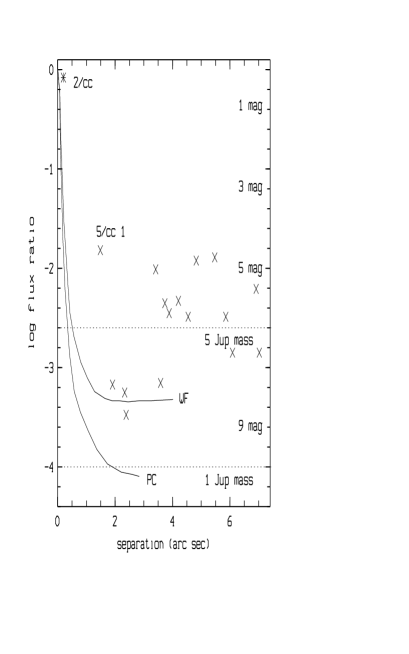
From the images of Cha H 5 and 8 and their companion candidates observed on the PC chip, we determined the dynamic range achieved on the PC chip. From the deepest exposures with Cha H 4, 10, & 11 on WF4 and Cha H 8 on WF2, we determined the dynamic range achieved on the WF chips. In Fig. 13, the dynamic range is plotted as flux ratio versus separation, with flux ratio being the ratio between either a companion or the background level and the particular primary (I-band).
From the mean (and faintest, respectively) I-band magnitude of the primaries (being 16.0 mag and 17.5, respectively) and the dynamic range limit (log flux ratio being 4, i.e. a magnitude difference of 10 mag outside of 2′′ with the PC), we can then obtain the magnitude limit for detectable companions, namely 26 mag (27.5 mag), or one mag brighter at 1′′ separation (and 2 mag brighter for the WF chips). For an assumed IKs color index of mag for an L- or T- dwarf, this would correspond to a limit of 21.5 mag (23.0 mag) in Ks. This limiting magnitude at a distance of 140 pc and an age of 2 Myrs would correspond to a limiting companion mass of Mjup according to table 1 in Burrows et al. (1997) with B.C.K=2 mag (as for Gl 229 B, Leggett et al. 1999).
Hence, we should have been able to have detected all companions with mass above Mjup outside of 2′′ (320 AU) and all companions down to a few Mjup at AU. Outside of (50 AU), we should have detected all companions with masses above Mjup (K mag).
If isolated brown dwarfs are ejected early in the accretion phase (Reipurth & Clarke 2001) or some time during the pre-main sequence evolution (Sterzik et al. 2001), one should expect more high-mass-ratio binaries among very young stars than among old stars, which we can check with our sample. We observed 11 M6-M8-type primaries with HST and found 16 clearly resolved wide companion candidates around five of them plus one additional very close () candidate binary. From the background population, we estimated the probability for each candidate to be a true companion, so that we can expect a few real companions among the candidates. From the optical and IR colors, only two of the candidates could be L- or T-type objects (Cha H 5/cc 1 and Cha H 4/cc 2). Up to two true sub-stellar companions around 11 primaries correspond to a percentage of . All these detected companion candidates (as well as un-detected, but detectable companions) would have separations in the range from AU (resolution limit) to 1000 AU (somewhat arbitrary upper limit) and high mass-ratios of 10 to 100 (with the ratio being the mass of the primary devided by mass of the companion). If Cha H 2 is a close binary (Sect. 7), then the secondary could also be a sub-stellar companion, so that we would then have sub-stellar companions around 11 primaries, i.e. .
This should be compared to the frequency and orbit characteristics of other high-mass-ratio binaries with large separations, i.e. brown dwarfs in orbit around a star. Recently, Gizis et al. (2001) estimated the frequency of wide, visual, old L- and T-type brown dwarf companions to normal stars to be . This number is consistent with our estimate given above, so that we find no evidence for the ejection scenario. However, because of the large error bars due to small-number-statistics, we do not have sufficient evidence to make a strong statement in this regard. In addition, the surveys discussed by Gizis et al. (2001) and our survey have different dynamical ranges and detection limits.
We also have to refrain from comparing our results with previous surveys for companions around young low-mass stars in Chamaeleon (Reipurth & Zinnecker 1993, Brandner et al. 1996, Ghez et al. 1997, Köhler 2002), because our sample of primaries (M6- to M8-type bona-fide and candidate brown dwarfs) is different from the previously surveyed samples (G- to early M-type T Tauri stars) and because the previous surveys were restricted to smaller dynamical ranges, up to a magnitude difference of 5 mag between primary and companion candidate, while all but one (Cha H 5) or two (Cha H 2) of our companion candidates have larger magnitude differences.
In our observations, we found one promising companion candidate (Cha H 5/cc 1), which could be a brown dwarf (or even giant planet) companion. The other candidates are all fainter and often detected only in I. If they were true companions, they would all be giant planets, given their magnitudes, assuming the same age and distance as towards the primaries. However, they are all at physical separations AU, which is not expected for planets, but should not be excluded. Follow-up 2nd epoch imaging and/or spectroscopy will show, whether and which of our companion candidates are truely cool and bound.
Acknowledgements.
We would like to thank the support staff at VLT, NTT, and STScI, especially our program coordinator Galina Soutchkova, as well as Günther Wuchterl, Eike Guenther, and Eduardo Martín for useful discussion. RN and WB acknowledge the hospitality and support from the Institute for Astronomy at the University of Hawai’i, where part of the work was carried out. RN acknowledges financial support from the BMBF through DLR grant 50 OR 0003. VJ acknowledges financial support from the DFG Schwerpunktprogramm Sternentstehung.References
- (1)
- (2) Alves J., Lada C.J., Lada E.A., Kenyon S.J. & Phelps R., 1998, ApJ 506, 292
- (3)
- (4) Alves J., Lada C.J. & Lada E.A., 2001, Nat 409, 159
- (5)
- (6) Baraffe I., Chabrier G., Allard F. & Hauschildt P.H., 1998, A&A 337, 403
- (7)
- (8) Basri G. & Martín E.L., 1999, ApJ 118, 2460
- (9)
- (10) Basri G., Mohanty S., Allard F., et al., 2000, ApJ 538, 363
- (11)
- (12) Bejar V., Zapatero-Osorio M. & Rebolo R., 1999, ApJ 521, 671
- (13)
- (14) Bessel M.S. & Brett M.J., 1988, PASP 100, 1134
- (15)
- (16) Brandner W., Alcalá J.M., Kunkel M., Moneti A. & Zinnecker H., 1996, A&A 307, 121
- (17)
- (18) Brandner W., Zinnecker H., Alcalá J.M., et al., 2000, AJ 120, 950
- (19)
- (20) Burgasser A.J., Kirkpatrick J.D., Brown M.E., et al., 2001, preprint, astro-ph/0108452
- (21)
- (22) Burrows A., Marley M., Hubbard W.B., et al., 1997, ApJ 491, 856
- (23)
- (24) Chabrier G. & Baraffe I., 2000, ARA&A 38, 337
- (25)
- (26) Comerón F., Rieke G. & Neuhäuser R., 1999, A&A 343, 477 (C1999)
- (27)
- (28) Comerón F., Neuhäuser R. & Kaas A.A., 2000, A&A 359, 269 (C2000)
- (29)
- (30) Frink S., Röser S., Alcalá J.M., Covino E. & Brandner W., 1998, A&A 338, 442
- (31)
- (32) Ghez A., McCarthy D.W., Patience J.L. & Beck T.L., 1997, ApJ 481, 378
- (33)
- (34) Gizis J.E., Kirkpatrick J.D., Burgasser A., et al., 2001, ApJ 551, L163
- (35)
- (36) Joergens V. & Guenther E.W., 2001, A&A 379, L9
- (37)
- (38) Kirkpatrick J.D., Reid I.N., Liebert J., et al., 1999, ApJ 519, 802 (K1999)
- (39)
- (40) Kirkpatrick J.D., Reid I.N., Liebert J., et al., 2000, AJ 120, 447 (K2000)
- (41)
- (42) Köhler R., 2002, AJ, in press, astro-ph/0109103
- (43)
- (44) Koerner D.W., Kirkpatrick J.D., McElwain M.W. & Bonaventura N.R., 1999, ApJ 526, L25
- (45)
- (46) Moffat A.F.J., 1969, A&A 3, 455
- (47)
- (48) Lada C.J., Lada E.A., Clemens D.P. & Bally J., 1994, ApJ 429, 694
- (49)
- (50) Leggett S.K., Toomey D.W., Geballe T.R. & Brown R.H., 1999, ApJ 517, L139
- (51)
- (52) Leggett S.K., Golimowski D.A., Fan X., et al., 2002, ApJ, in press, astro-ph/0108435
- (53)
- (54) Lowrance P.J., McCarthy C., Becklin E.E., et al., 1999, ApJ 512, L69
- (55)
- (56) Martín E.L., Brandner W. & Basri G., 1999, Sci 283, 1718
- (57)
- (58) Muench A.A., Alves J., Lada C.J. & Lada, E.A., 2001, ApJ 558, L51
- (59)
- (60) Nakajima T., Oppenheimer B.R., Kulkarni S.R., et al., 1995, Nat 378, 463
- (61)
- (62) Natta A. & Testi L., 2001, A&A 376, L22
- (63)
- (64) Neuhäuser R. & Comerón F., 1998, Sci 282, 83
- (65)
- (66) Neuhäuser R. & Comerón F., 1999, A&A 360, 612
- (67)
- (68) Neuhäuser R., Guenther E.W., Petr M.G., et al., 2000, A&A 360, L39
- (69)
- (70) Oppenheimer B.R., Kulkarni S.R., Matthews K. & van Kerkwijk M.H., 1995, Sci 270, 1478
- (71)
- (72) Persi P., Marenzi A.R., Olofsson G., et al., 200, A&A 357, 219
- (73)
- (74) Reid I.N., Kirkpatrick J.D., Gizis J.E., et al., 1999, ApJ 521, 613
- (75)
- (76) Reid I.N., Gizis J.E., Kirkpatrick J.D. & Koerner D.W., 2001, ApJ 121, 489
- (77)
- (78) Reipurth B. & Zinnecker H., 1993, A&A 278, 81
- (79)
- (80) Reipurth B. & Clarke C., 2001, AJ 122, 432
- (81)
- (82) Rieke G.H. & Lebofsky M.J., 1985, ApJ 288, 618
- (83)
- (84) Sterzik M.F., Durisen R.H. & Pickett B.K., 2001, Dynamical decay of young few-body clusters and the origin of isolated T Tauri stars. In: Jayawardhana R. & Greene T.P. (eds.) Young stars near Earth, ASP Conf. Ser. 244, 116-120
- (85)
- (86) Teixeira R., Ducourant C., Sartori M.J., et al., 2000, A&A 361, 1143
- (87)
- (88) Whitmore B., Heyer I. & Casertano S., 1999, PASP 111, 1559
- (89)