Dark halo densities, substructure, and the initial power spectrum
Abstract
Although the currently favored cold dark matter plus cosmological constant model for structure formation assumes an scale-invariant initial power spectrum, most inflation models produce at least mild deviations from . Because the lever arm from the CMB normalization to galaxy scales is long, even a small “tilt” can have important implications for galactic observations. Here we calculate the COBE-normalized power spectra for several well-motivated models of inflation and compute implications for the substructure content and central densities of galaxy halos. Using an analytic model, normalized against N-body simulations, we show that while halos in the standard () model are overdense by a factor of compared to observations, several of our example inflation+LCDM models predict halo densities well within the range of observations, which prefer models with . We go on to use a semi-analytic model (also normalized against N-body simulations) to follow the merger histories of galaxy-sized halos and track the orbital decay, disruption, and evolution of the merging substructure. Models with predict a factor of fewer subhalos at a fixed circular velocity than the standard case. Although this level of reduction does not resolve the “dwarf satellite problem”, it does imply that the level of feedback required to match the observed number of dwarfs is sensitive to the initial power spectrum. Finally, the fraction of galaxy-halo mass that is bound up in substructure is consistent with limits imposed by multiply imaged quasars for all models considered: even for an effective tilt of . We conclude that, at their current level, lensing constraints of this kind do not provide strong limits on the primordial power spectrum.
1 Introduction
The cold dark matter plus cosmological constant (LCDM) model of structure formation is the most successful and popular current theory for the origin of universal structure. The theory is highly predictive, and given that observations constrain the universe to be nearly flat (with , and ) a crucial unknown is the primordial spectrum of density fluctuations. It is usually assumed that the initial fluctuation spectrum is scale-invariant, with , . This choice is motivated by the fact that slow-roll inflation models predict nearly scale-invariant spectra. However, generic models of inflation do not predict primordial power spectra that are exactly scale-invariant and almost all models have some small, often non-negligible, “tilt” () and “running” of the spectral index (). In this proceeding we report on our work to model the small-scale implications of reasonable initial power spectra, and demonstrate that the substructure content and central densities of dark halos should be very sensitive to small deviations from scale-invariance. Our models are semi-analytic, but they are normalized and tested against N-body simulations. As we discuss below, our results may be important for interpreting galaxy rotation curves, dwarf galaxy counts, and substructure mass fractions as measured from multiply imaged quasars.
In Zentner & Bullock [18] (hereafter ZB1 and ZB2) we chose several well-motivated and representative inflation models and calculated the implied power spectra to second order in slow-roll using the method of Stewart and Gong [14]. Adopting , , , and (LCDM), we calculated P(k) using the results of Eisenstein & Hu [5] and normalized to COBE on the pivot scale, h-1Mpc. In the interest of brevity, we report on only three models here:
-
•
IPL: , ,
-
•
RM: , ,
-
•
: , ,
.
The tilt and running are evaluated at and is the rms fluctuation amplitude within spheres of Mpc implied by the COBE normalization. Observational constraints on have historically favored a value near unity; however, some recent estimates indicate surprisingly low values of [9]. Roughly speaking, spans the range of recently reported values (for ).
2 Central Densities
The theory of CDM has survived remarkably well since its creation roughly twenty years ago [12], but lingering for nearly half this time has been a possible problem with galaxy central densities [6], which seem to be much less dense than the standard CDM model typically predicts. One part of this problem — the cusp vs. core question — concerns the precise inner slope of galaxy rotation curves and whether they match the “cuspy” predictions of CDM theory. This particular question is highly debated, and some argue that observational errors and/or theoretical uncertainties make the comparisons inconclusive. But even among those who believe there may be no problem with the shapes of rotation curves (the authors included), it is almost universally agreed upon that the data do prefer halos that are less centrally concentrated than typical halos in the standard () LCDM model.
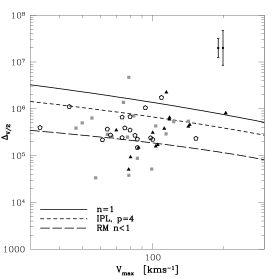
One way to see the problem is by comparing rotation curve data to theory using the following, non-parametric measure of the density [1]:
| (1) |
This is the mean dark matter density within the radius where the galaxy rotation curve falls to half its maximum, . In practical units, .
In Figure 1, we plot measured from several dark matter-dominated galaxy rotation curves (data from [15], see ZB1 for details) and compare to predictions for typical halo densities in our models with different power spectra (lines). Notice that the model overpredicts the galactic densities by a factor of , while our inflation-motivated models with do much better.
The predictions were made using the semi-analytic model of Bullock et al. [2], which was shown to reproduce the halo densities measured in N-body simulations for and LCDM power spectra as well as a variety of power-law models (see ZB1 for an extensive discussion). The model is similar to that originally proposed in [11] (see also [17]), although modified in order to reproduce the redshift dependence seen in N-body halos. Qualitatively, it embodies the fact that halo densities reflect the density of the universe at their characteristic collapse redshift. Halos in models with less small-scale power collapse later, when the universe is less dense, and therefore have more diffuse cores. Interestingly, even the “IPL” case, with only a moderate tilt and mild running, does significantly better than the standard model. If we adopt the criterion that a ”good” fit to the data has at kms-1 then the data prefer , assuming that the primordial spectrum is the only element of the solution.
3 Substructure
As mentioned briefly in the previous section, the input power spectrum greatly affects the typical merger history of galaxy-sized halos. Halos formed in models with less power on galactic scales typically form later, and accrete a larger fraction of their substructure at later epochs. Similarly, the “subhalos” that are accreted also form later, are less dense, and therefore are more easily tidally disrupted. In order to explore how different initial power spectra affect the substructure content of halos quantitatively, we developed a semi-analytic model that tracks halo accretion histories using the extended Press-Schechter formalism [13] and follows subhalo orbital evolution in a semi-analytic fashion.
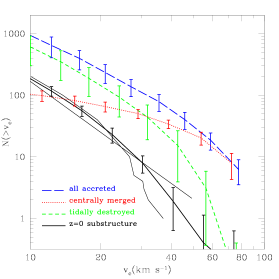

Described in detail in ZB2, our model expands on the calculations presented in Bullock, Kravtsov & Weinberg [3] and includes some modifications similar to those advocated by Taylor and Babul [16]. Briefly, after each merger event, we follow the subhalo orbital evolution as it decays due to dynamical friction and loses mass via tidal interactions with the host halo. Dynamical friction dominates for large subhalos, which typically merge with the central object soon after accretion. Low mass substructures are efficiently stripped by the host potential, and a large fraction of them become completely tidally destroyed. The results of our model for an ensemble of Milky Way-like host halos in an LCDM cosmology are displayed in Figure 2. Shown as a function of are the total number of objects that have been accreted compared to the number that eventually merge with the central object, the number that are tidally destroyed, and the number that survive as distinct substructures at . It is clear that our model for the number of surviving structures is in good agreement with the results of N-body simulations (thin solid lines) [8]. We use this model to estimate the sensitivity of the substructure population at to the primordial power spectrum.

Shown in Figure 3 are the cumulative subhalo velocity functions for each of our models compared to two different estimates of dwarf galaxy counts within kpc of the Milky Way and M31 [8, 7]. That LCDM overpredicts the number of small satellites by roughly an order of magnitude is expected. This is the well-known dwarf satellite problem (e.g. [8]). Interestingly, the number of subhalos is reduced by as much as a factor of for the inflation-derived power spectra that we consider. Although all of these cases would require some degree of feedback to match dwarf counts (e.g., ionization [3]), the amount of feedback needed will depend sensitively on the input power spectrum.
Related to the dwarf satellite problem are recent efforts to measure the substructure content in halos using the flux ratios in multiply imaged quasars [10]. For example, Dalal and Kochanek used this technique to constrain the fraction of the host halo mass bound up in substructure to be (90 % confidence). They went on to use this result to try to limit the tilt of the primordial spectrum using a simplified model for the abundance of substructure and obtained at 95% confidence. Our results on substructure differ from those of Dalal and Kochanek, as illustrated in Figure 4. We find that for a host halo of the relevant mass, the total mass fraction in subhalos is typically larger than the their lower limit () even for our most tilted primordial spectrum, . Since this model is on the edge of what is acceptable by constraints, it seems that strong lensing does not yet serve as a significant probe of the primordial power spectrum. (Using a version of our model, Dalal and Kochanek are in the process of revising their limits, and now find results more in line with those reported here [4].)
References
- [1] Alam, S. M. K., Bullock, J. S., & Weinberg, D. H. 2002, ApJ, 572, 34
- [2] Bullock, J. S., Kolatt, et al. 2001, MNRAS, 321, 559
- [3] Bullock, J. S., Kravtsov, A. V., & Weinberg, D. H. 2000, ApJ, 539, 517
- [4] Dalal, N., 2002, private communication
- [5] Eisenstein, D. J. and Hu, W. 1999, ApJ, 511, 5
- [6] Flores, R. & Primack, J.R., 1994, ApJL, 427, L1; Moore, B. 1994, Nature, 370, 629
- [7] Hayashi, E., Navarro, J.F. et al. ApJ, submitted, astro-ph/0203004
- [8] Klypin, A., Kravtsov, A. V. et al. 1999, ApJ, 522, 82; Font, A. S., Navarro, J. F. et al. 2001, ApJL, 563, L1
- [9] Melchiorri, A. & Silk, J. astro-ph/0203200; Seljak, U., astro-ph/0111362; Viana, P. T. P., Nichol, R. C. & Liddle, A. R., astro-ph/0111394; Bahcall, N.A. et al., astro-ph/0205490.
- [10] Metcalf, R. B. & Madau, P. 2001, ApJ, 563, 9 ; Chiba, M. 2002, ApJ, 565, 17; Dalal, N. & Kochanek, C. S. 2002, ApJ, 572, 25; Dalal, N. & Kochanek, C. S. 2002, PrD, submitted, astro-ph/0202290; Moustakas, L.A. & Metcalf, R.B. 2002, MNRAS, submitted, astro-ph/0206176
- [11] Navarro,J.F., Frenk, C. S. & White,S.D.M., ApJ, 1997, 490, 493
- [12] Peebles, P. J. E. 1982, ApJL, 263, L1 ; Blumenthal, S. M. Faber, J. R. Primack, and M. J. Rees, 1984, Nature 311, 517
- [13] Somerville, R. S. & Kolatt, T. S. 1999, MNRAS, 305, 1
- [14] Stewart, E. D. & Gong, J. O. 2001, Phys. Lett. B, 510, 1
- [15] Swaters, R. A., PhD Thesis, University of Groningen (1999); de Blok, W. J. G., McGaugh, S. S., & Rubin, V. C. 2001, AJ, 122, 2396; de Blok, W. J. G. & Bosma, A. A. 2002, astro-ph/0201276
- [16] Taylor, J. E. & Babul, A. 2001, ApJ, 559, 716
- [17] Wechsler, R.H., Bullock, J.S., et al. 2001, ApJ 568, 52
- [18] Zentner, A. R. & Bullock, J. S. 2002, PrD, accepted, astro-ph/0205216 (ZB1); Zentner, A. R. & Bullock, J. S. 2002, in preparation (ZB2).