Morphological Classification of the OSU Bright Spiral Galaxy Survey
Abstract
To quantify the distribution of bar shapes in spiral galaxies, we have analysed 113 H-band and 89 B-band galaxy images from the Ohio State University Bright Spiral Galaxy Survey. Parameters measuring bar shape and position along the Hubble sequence were obtained in each waveband. Evidence was found for a bimodality in the distribution of bar shape, implying that barred and unbarred galaxies are not just the extrema of a single distribution, and that any evolution between these two states must occur on a rapid timescale. Objective bar shapes measured in the H-band were found to be more closely related to visual classifications than B-band bar strengths, as the B-band images are somewhat compromised by localised star formation, especially in later-type systems. Galaxies were found to be more centrally concentrated in the infrared. Later type galaxies showed greater asymmetry in the optical than the infrared, presumably again due to localised star formation, but on average the bar strengths in the two bands were found to be the same.
keywords:
galaxies: morphology, classification1 Introduction
For over 75 years, bright galaxies have been classified using Hubble’s (1926) Tuning Fork. Modifications and refinements have been made, but the original scheme, defining “early” to “late” types by the size of the bulge, and the smoothness and pitch angle of the spiral arms, has proved to be a remarkably robust starting point. Hubble’s second parameter, whether or not a galaxy contains a central bar, has also proved a useful defining feature in describing galaxies’ morphologies. However, the existence of galaxies with differing degrees of “barriness” led de Vaucouleurs (1959) to introduce an intermediate category, SAB, between strongly-barred SB galaxies and unbarred SA galaxies. This finer gradation raises the natural question of whether galaxies really are naturally divided into barred and unbarred systems, or whether some continuum exists. This issue is clearly of significance in trying to understand the still-disputed origins of the bars found in a large fraction of galaxies [see, for example, Sellwood (1999)].
In an attempt to address this question, Abraham & Merrifield (2000) made a quantitative assessment of the morphologies of galaxies in the Frei et al. (1996) catalogue. They discovered that if these galaxies are plotted in a two parameter “Hubble Space,” with a measure of position along the Hubble sequence on the axis and barriness on the axis, then the galaxies naturally split into the classical bifurcated tuning fork seen in Hubble’s original work, with the barred galaxies forming a remarkably tight sequence in this space. The bimodal nature of the barriness parameter then implies that barred and unbarred galaxies do form distinct populations. However, there were two significant shortcomings in this analysis.
First, the Frei et al. (1996) catalogue was not selected in a manner well-suited to this type of analysis. Indeed, since it was chosen to contain a broad range of galaxy types, one might well imagine that the most strongly barred galaxies were included to represent this type of system, while galaxies with no central distortion in their isophotes were selected to represent unbarred systems. Thus, one could imagine that the criteria upon which the catalogue was selected could introduce exactly the type of bimodal distribution observed.
Second, the observations for the Frei et al. (1996) catalogue were all at optical wavelengths. Light in this part of the spectrum can be dominated by relatively small amounts of recent star formation, so the perceived morphology may not be representative of a galaxy’s underlying structure. Hackwell & Schweizer (1983), and more recently Block et al. (1994), have shown that a galaxy’s optical appearance can be totally different from its infrared morphology, which is more representative of the bulk of the galaxy’s stellar distribution. Thus, even such basic properties as whether or not a galaxy contains a bar may be difficult to establish at optical wavelengths. Indeed, it is notable in Abraham & Merrifield’s (2000) analysis that unbarred late-type galaxies, where contamination by recent star formation is more of an issue, have tended to be classified as intermediate “SAB” galaxies, perhaps reflecting the difficulty in classifying the barriness of these systems. A further indication of the potentially misleading nature of optical classifications of barriness comes from the simple statistic that at visible wavelengths only of galaxies are classified as barred (Sellwood & Wilkinson 1993), whereas at infrared wavelengths the fraction is (Mulchaey & Regan 1997; Knapen et al. 2000; Eskridge et al. 2000).
In this paper, we address these issues by carrying out a morphological analysis of data from the Ohio State University Bright Spiral Galaxy Survey111 The subset of the OSUBSGS used was the Early Data Release, available online at http://www.astronomy.ohio-state.edu/survey/EDR/.. The galaxies in this sample have well defined selection criteria, and should prove representative of bright spiral galaxies in the local Universe, removing the first concern expressed above. Further, galaxy images are available at both near infrared and optical wavelengths, so the morphological properties can be determined using the more robust infrared data, and tested against the morphologies derived in the optical.
2 The OSU Bright Spiral Galaxy Survey
The sample of galaxies used in this investigation were taken from the Ohio State University Bright Spiral Galaxy Survey (OSUBSGS). 205 galaxies were observed in B,V,R,J,H, and K bands at five different observatories, using 1.2m - 2.4m telescopes. A full description of the survey can be found in Eskridge et al. (2002). The spiral galaxies were selected for the survey from Third Reference Catalogue of Bright Galaxies (RC3) (de Vaucouleurs et al. 1991) subject to the constraints that they have a B-band magnitude and a diameter .
In this paper a total of 196 H-band, and 166 B-band galaxy images were investigated. However before the classification parameters could be measured, the foreground stars in each image had to be removed. Stars were replaced with an average of the surrounding pixels. All images were closely examined for suitability and were rejected if they had too many foreground stars; had bright stars near the centre; or had large bright stars elsewhere causing saturation over a significant portion of the galaxy image.
As it is almost impossible to determined whether a galaxy that lies close to edge-on is barred on the basis of photometry alone, we follow Abraham et al. (1999) and only use galaxies whose axis ratios imply an inclination . In the B-band images, galaxies with strong dust or star formation features (e.g. NGC 2442), could not be satisfactorily fitted by any kind of ellipse-fitting model, and were therefore also rejected. In total 89 B-band and 113 H-band images were found to be suitable, with a total of 72 galaxies having images in both bands. Fig. 1 shows that the sub-sample is slightly deficient of very late-type systems (due to the rejection of heavily dust-obscured galaxies), but is otherwise representative of the nearby bright spiral galaxy population found in the RC3.
3 Classification Parameters
In order to classify the galaxies, we adopt the framework described in detail in Abraham & Merrifield (2000). This methodology defines a two-dimensional Hubble Space where the -coordinate measures position along the early-to-late sequence, while the -coordinate measures, in a quantitative way, the degree to which a galaxy is barred. This parameter space provides a quantitative framework for investigating Hubble’s Tuning Fork: if the original scheme were strictly valid, we might expect to find galaxies separated into one-dimensional barred and unbarred sequences, with weakly barred galaxies perhaps lying at the lower edge of the barred distribution.
We assume that the distribution of light corresponds to a thin disk that is intrinsically axisymmetric at large radii, and define the centre of galaxy as the pixel with the maximum flux. A quantitative measure of asymmetry, , was obtained by subtracting the image of the galaxy from a version that had been rotated through 180 degrees (Abraham et al. 1996). We define the early-to-late () axis using the central concentration parameter, , defined in Abraham et al. (1994) and closely related to the parameter defined by Doi, Fukugita, & Okamura (1993). This parameter closely tracks bulge-to-disk ratios and has been shown to provide a quantitative substitute for more orthodox visual classifications of position along the Hubble Sequence (Abraham et al. 1996). The concentration parameter is simply the flux ratio between an inner and a outer ellipse. The outer ellipse is selected using second order moments obtained by a 2 cut above the sky noise, . The inner ellipse is calculated by a similar moment analysis, but at a radius of only 30% of the outer ellipse.
Assuming that the galaxy is intrinsically axisymmetric at large radii, the axis ratio of the outer ellipse can be used to define the galaxy inclination, which is also important for determining the bar shape () axis. Following Abraham & Merrifield (2000) we define the bar strength as;
| (1) |
where is the intrinsic axis ratio of the putative bar, calculated from its apparent axis ratio and the galaxy’s inclination using equation (2) of Abraham et al. (1999). To make sure that we do not miss any small high surface brightness or large low surface brightness bars, the whole range of radii is searched starting with the outer isophote (defined as for C) and working inwards. The inner ellipse is then defined as the isophote with the minimum (i.e. the maximum value of ). Figure 2 shows several examples of the ellipse fits.
In order to discriminate between barred and unbarred galaxies, Abraham et al. (1999) proposed that systems with could be classified as barred. This corresponds to , which we will use to determine the fraction of barred galaxies in the OSUBSGS. It should be stressed that this cutoff does not represent any underlying physical process within spiral galaxies, but merely provides a useful visual criterion for defining a galaxy as barred.
4 Results
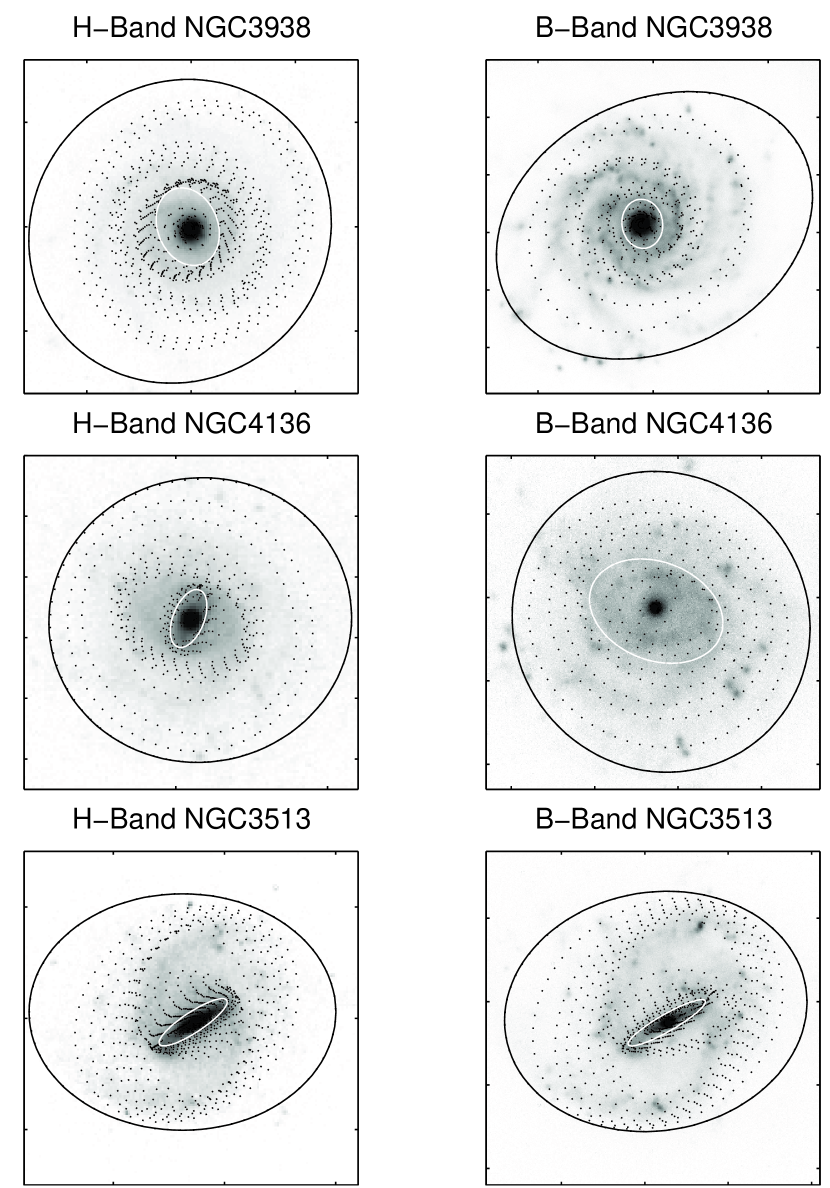
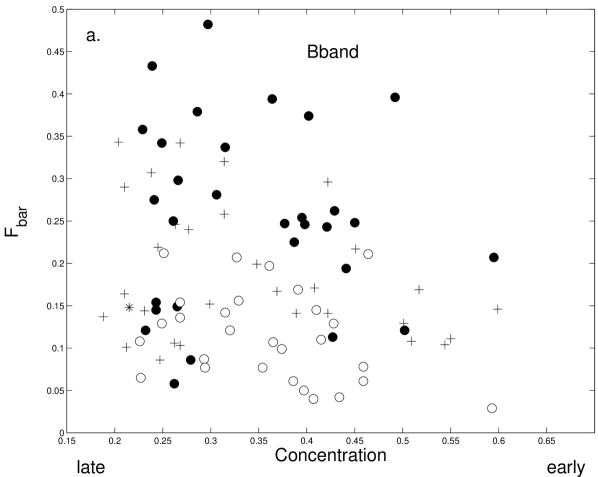
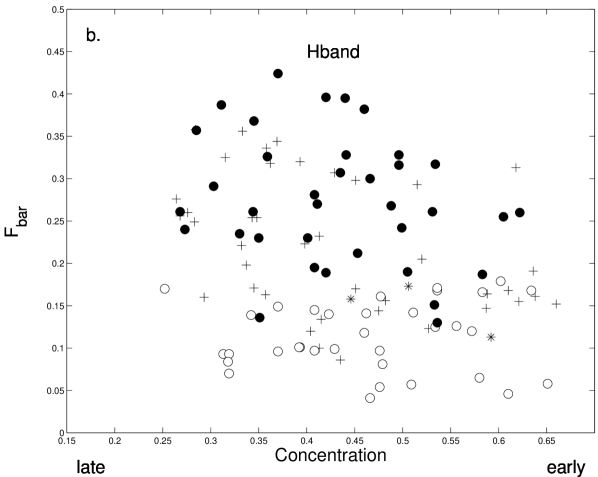
Figure 3 displays the distribution of the optical and near infrared samples in the two dimensional Hubble Space. A slight anticorrelation is observed between and in both infrared and optical bands. As discussed in Abraham & Merrifield (2000), such a trend occurs naturally as the presence of a strong bulge (and hence large value of ) will tend to wash out any bar signature, whereas in galaxies with weak bulges even quite modest bars will still be strongly detected.
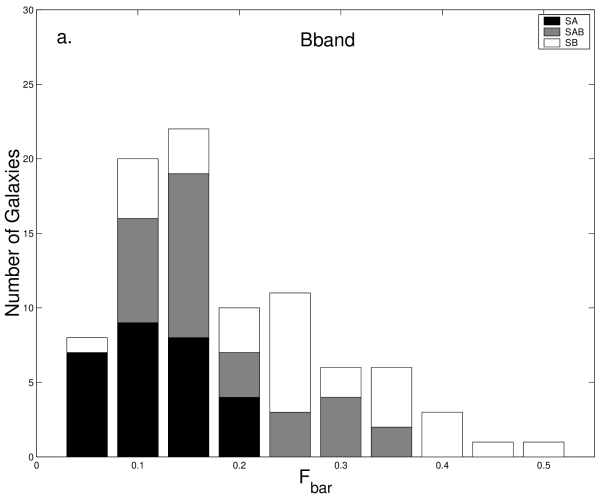
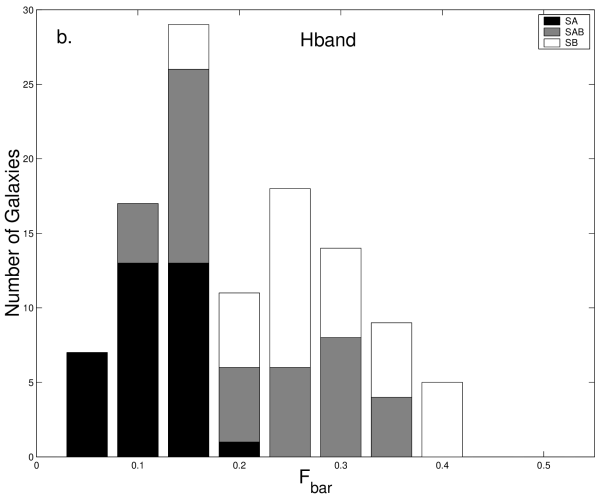
In terms of their qualitative bar classifications, the galaxies are reasonably well divided in both optical and near infrared Hubble Space, with SA galaxies distributed across the bottom, SB galaxies across the top, and SAB galaxies bridging the gap between the two. The bimodal split between barred and unbarred galaxies is far less apparent in these figures than was found by Abraham & Merrifield (2000). However, there is still evidence for such a split even in this more objectively defined sample. The histograms of in Fig. 4 show a dip in the number of galaxies at , the same value as the gap found in Abraham & Merrifield’s (2000) analysis of the Frei sample. The dip is at a greater significance level () in the infrared data than in the optical, which suggests that the optical bar shapes are more compromised by the effects of star formation, dust obscuration, etc.
This impression is borne out by the fact that there is a tighter grouping of the visual classifications, particularly the SB galaxies, in the infrared data than in the optical (despite the fact that the visual classifications were based on optical images). The of cases where the visual and automated classifications disagree strongly were inspected individually. In almost all cases the discrepancy arises because the automated fit is being compromised by bright star-forming features. In some cases, these features are localised regions, but in others (such as NGC4136, see Fig. 2) the fit is drawn to tightly wrapped spiral arms, which are identified as the strongest non-circular features, rather than the bar that we seek. It should be noted that for galaxies with two or more bars, the automated process would pick out the most elliptical bar, not necessarily the primary outer bar (although no such cases were found in this sample). We could have intervened in the bar analysis to prevent such misfits, but such subjective judgements are contrary to the ethos of this approach, as they could easily introduce subjective biases in the analysis.
There are thus at least two non-physical sources of scatter in the distribution of . First, the intrinsic limitations of the automated fitting process (particularly at optical wavelengths) mean that there is an uncertainty introduced in the derived value of bar shape. Second, the correlation between and means that a projection of this two-dimensional space onto the axis will tend to smear out intrinsically sharp features in Hubble space when viewed in one dimension. Hence, the true divide between barred and unbarred galaxies is likely to be rather more dramatic than we see in Fig. 4.
In order to compare the fraction of barred galaxies in the optical and infrared, only the 72 galaxies for which images in both bands were available were used. We find that of galaxies are barred in the optical, with this fraction increasing to in the near infrared. Visual classification of the entire OSUBSGS sample, preformed by Eskridge et al. (2000) found only of galaxies to be either strongly or weakly barred in the H-band, while only 64% were classified as barred in the RC3 (B-band). Overall there is a good correlation between optical and NIR bar shape. Obscuration from dust and star-formation did cause some late-type galaxies to appear more barred in the NIR than the optical. A few galaxies did appear to be significatly more barred in the optical than NIR, as isophotes fitted around HII regions can occasionally give the appearance of a bar.
Automated classification finds a slightly higher fraction of barred galaxies in both bands than visual classification. This could mean that smaller bars are occasionally overlooked when visual classifications are made. However the difference in fractions in this case is probably due to the value of selected to separate barred from unbarred galaxies. Indeed, if we increase the proposed value of to , we find that 61% of galaxies are barred in the B-band and 71% in the H-band. These fractions are in good agreement with those found by Eskridge et al. (2000).
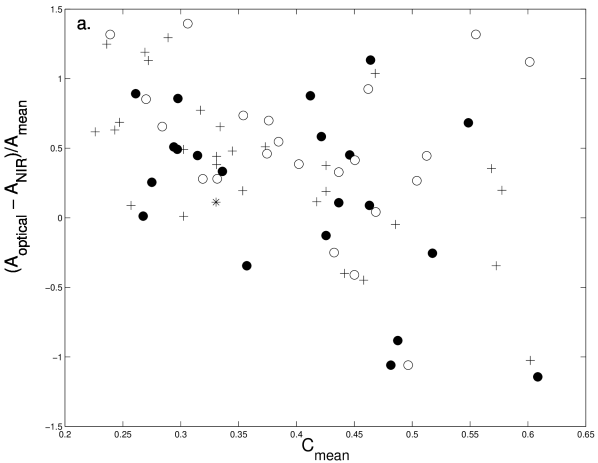
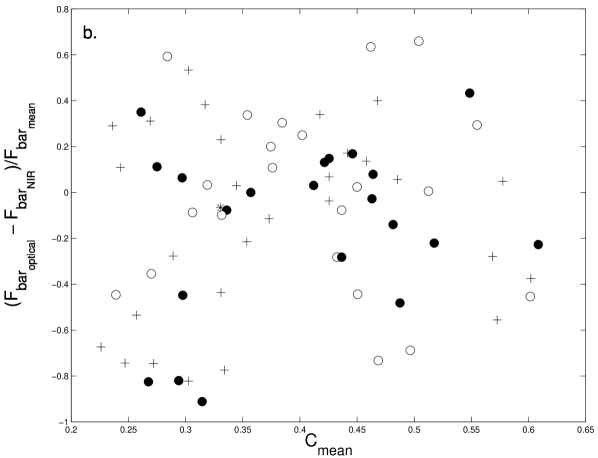
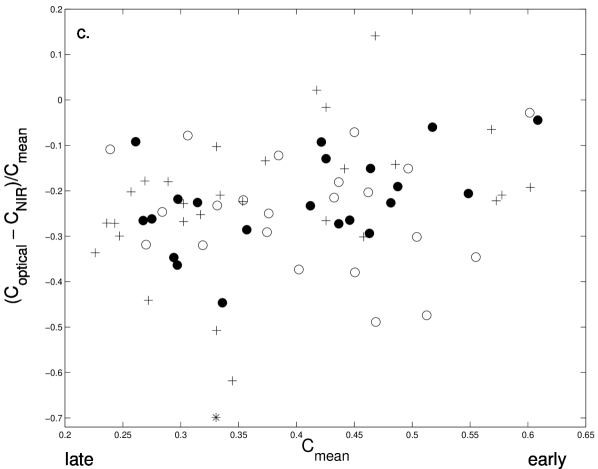
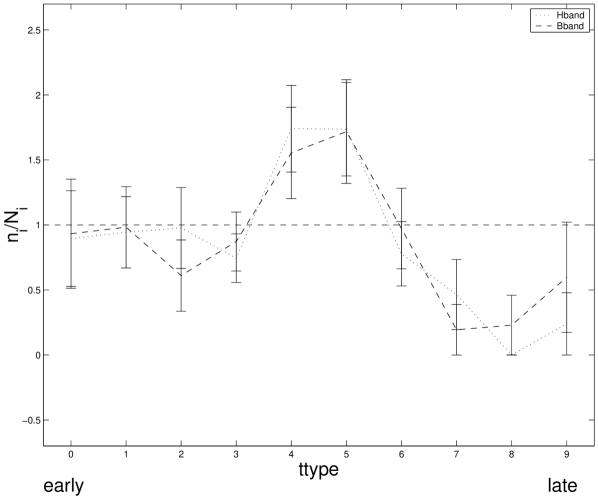
Having established that the optical properties of galaxies introduce more dispersion in their objective classifications than occurs in the infrared, we now look briefly at possible systematic differences between the two data sets. Figure 5 shows the fractional variation in asymmetry, bar shape and central concentration between the optical and infrared data as a function of mean concentration (the average of the concentrations in the two bands). There is a clear trend in asymmetry in the sense that although high concentration (early type) galaxies have similar asymmetries, the low concentration (late type) galaxies are systematically more asymmetric in the optical than the infrared. Patchy, asymmetric star formation occurs more commonly in later-type galaxies, so this result again reflects the fact that optical data are more affected by star formation than infrared observations. Bar shape does not seem to be systematically affected in the same way. Although patchy star formation increases the scatter in bar shape in low concentration galaxies, it only marginally lowers the bar shapes in the optical compared to their infrared values. Concentration, on the other hand, does change systematically between the optical and infrared in the sense that galaxies are on average more centrally concentrated in the infrared. This variation could be an indicator of opacity in the central regions of these galaxies, which suppresses the optical emission – as recently discussed in White, Keel & Conselice (2000), this remains a controversial issue. However, it could also simply reflect the star formation in the disks of these galaxies, which will augment the optical emission at large radii, lowering the concentration observed in this band.
5 Discussion
This study has placed a well-defined sample of spiral galaxies in the Hubble Space of early-to-late type and bar shape. The main conclusion is that there are significant signs of bimodality in the bar shape parameter, similar to those found by Abraham & Merrifield’s (2000). Since the current analysis is based on a sample with more objective selection criteria, this bimodality is unlikely to be attributable to selection effects. This therefore suggests that barred and unbarred galaxies exist as distinct populations, rather than as the extremes of a continuum.
Barred and unbarred galaxies are remarkably similar in all their other properties such as size, luminosity, Tully-Fisher relation, etc, (e.g. Debattista & Sellwood 2000). Therefore it seems unlikely that barred and unbarred galaxies are two separate types of system with no evolution between the two. Further, a variety of mechanisms have shown up in numerical simulations that may cause bars to form and dissolve in real disk galaxies (e.g. Athanassoula 2002). Thus, there are good reasons to believe that evolution should occur between these two populations. The existence of a gap between them then implies that such evolution must occur on a timescale that is short compared to the cosmological lifetimes of the galaxies (just as the Hertzsprung gap in the stellar colour-magnitude diagram indicates the haste with which stars evolve through this region of parameter space).
The comparison between optical and near-infrared morphologies is also instructive. Some measures of galaxy morphology, such as central concentration and asymmetry, vary systematically between the optical and near infrared. However the bar shape parameter remains approximately the same, albeit with greater scatter in the optical due to localised star formation, etc. This discovery has an important implication for studies of bar shape as a function of redshift, which indicate that barred galaxies are extremely rare for (Abraham et al. 1999; Van den Bergh et al. 2000). One possible explanation for this rarity is that it might be attributed to bandshifting effect, since the I-band images used in these studies correspond to B-band rest-frame emission for . Thus, if bars were systematically weaker in the B band than at red wavelengths, then one would expect to see such a decrease in bar fraction with redshift. This matter is discussed in greater detail by Van den Bergh et al. (2002). Since there is no such systematic variation in bar shape with waveband, this explanation now seems unlikely; it would appear that bars are intrinsically rarer at higher redshifts.
These conclusions have been drawn from a relatively small sample of galaxies, necessarily limiting their confidence. However, with the advent of large surveys like the Sloan Digital Sky Survey (York et al. 2000), much larger samples of galaxies are becoming available. Since the morphological parameters used in this analysis are reasonably robust, they can be applied to rather more distant galaxies than traditional classifications, opening up a larger region of space to such studies, and hence allowing much larger samples to be gathered. With these larger samples, objective morphological analysis should provide definitive answers to many of the questions where this study has only been able to scratch the surface.
6 acknowledgements
This work made use of data from the Ohio State University Bright Spiral Galaxy Survey, which was funded by grants AST-9217716 and AST-9617006 from the United States National Science Foundation, with additional support from the Ohio State University.
References
- [1] Abraham, R.G., Valdes, F., Yee, H.K.C., Van Den Bergh, S., 1994, ApJ, 432, 75
- [2] Abraham, R.G., Tanvir, N.R., Santiago, B.X., Ellis, R.S., Glazebrook, K., Van Den Bergh, S., 1996, MNRAS, 279, L47
- [3] Abraham, R.G., Merrifield, M.R., Ellis, R.S. Tanvir, N.R., Brinchmann, J. 1999, MNRAS, 308, 569
- [4] Abraham, R.G., Merrifield, M.R., 2000, AJ, 120, 2835
- [5] Athanassoula, L., 2002, in ”Disks of Galaxies: Kinematics, Dynamics and Perturbations,” to be published in the ASP Conference Series
- [6] Bershady, M.A., Jangren, A., Conselice, C.J., 2000, AJ, 119, 2645
- [7] Block, D. L., Bertin, G., Stockton, A., Grosbol, P., Moorwood, A. F. M., Peletier, R. F., 1994, A&A, 288, 365
- [8] Brinchmann, J. et al., 1998, ApJ, 499, 112
- [9] de Vaucouleurs, G., 1959, in S. Flugge (ed.) Handbuch der Physik LIII, Astrophysik IV, Sternsysteme, Springer-Verlag, Berlin, 275.
- [10] de Vaucouleurs, G., de Vaucouleurs, A., Corwin, H.G., Jr., Buta, R.J., Paturel, G., Fouque, P., 1991, Third Reference Catalogue of Bright Galaxies Volume 1-3, XII, Springer-Verlag, Berlin, Heidelberg, New York
- [11] Debattista, V. & Sellwood, J., 2000, ApJ, 543, 704
- [12] Doi, M., Fukugita, M., Okamura, S., 1993, MNRAS, 264, 832
- [13] Eskridge, P.B., Frogel, J.A., 1999, Astrophysics and Space Science, 269, 427
- [14] Eskridge, P.B., et al. 2000, AJ, 119, 536
- [15] Eskridge, P.B., Frogel, J.A., Pogge, R.W., Quillen, A.C., Berlind, A.A., Davies, R.L., DePoy, D.L., Gilbert, K.M., Houdashelt, M.L., Kuchinski, L.E., Ramírez, S.V., Sellgren, K., Stutz, A., Terndrup, D.M., & Tiede, G.P. 2002, ApJS, 143 in press [astro-ph/0206320]
- [16] Frei, Z., Guhathakurta, P., Gunn, J. E., & Tyson, J. A. 1996, AJ, 111, 174
- [17] Hackwell, J.A. & Schweizer, F., 1983, ApJ, 265, 643
- [18] Hubble, E., 1926, ApJ, 64, 321
- [19] Knapen, J.H., Shlosman, I., Peletier, R.F., 2000, ApJ, 529, 93K
- [20] Mulchaey, J.S. & Regan, M.W., 1997, ApJ, 482, L.135
- [21] Sellwood, J.A., 1999, in F Combes, G.A. Mamon, V. Charmadaris (eds), Dynamics of Galaxies: from the Early Universe to the Present, ASP Conference Series 197
- [22] Sellwood, J.A., Wilkinson, A., 1993, Rep. Prog. Phys. 56. 173
- [23] Van den Bergh, S., Cohen, J.C., Hogg, D.W., Blanford, R., 2000, AJ, 120, 2190
- [24] Van den Bergh, S., Abraham, R.G., Whyte, L.F., Merrifield, M.R., Eskridge, P., Frogel, J.A., Pogge, R., 2002, AJ, 123, 2913
- [25] White, R.E., Keel, W.C., Conselice, C.J., 2000, ApJ, 542, 761
- [26] York, D.G., et al. 2000, AJ, 120, 1579