Evolution of the cluster X-ray scaling relations since
Abstract
We derive correlations between X-ray temperature, luminosity, and gas mass for a sample of 22 distant, , galaxy clusters observed with Chandra. We detect evolution in all three correlations between and the present epoch. In particular, in the , cosmology, the luminosity corresponding to a fixed temperature scales approximately as ; the gas mass for a fixed luminosity scales as ; and the gas mass for a fixed temperature scales as (all uncertainties are 90% confidence). We briefly discuss the implication of these results for cluster evolution models.
1 Introduction
Correlations between the X-ray properties of galaxy clusters are useful statistical tools which allow to study the cluster physics. The best-studied correlation for the low-redshift clusters is that of the X-ray luminosity with the temperature (e.g., Mushotzky 1984, David et al. 1993, Markevitch 1998, Arnaud & Evrard 1999). The mass of the intracluster gas correlates with both temperature (Mohr, Mathiesen & Evrard 1999, Vikhlinin, Forman & Jones 1999) and X-ray luminosity (Voevodkin, Vikhlinin & Pavlinsky 2002b). The observed tightness of these correlations indicates a similar formation history for all clusters and is consistent with the predictions of the self-similar models of the cluster formation.
However, the details of these scaling relations are different from the predictions of the self-similar theory. The best-known example is the slope of the correlation: it is observed that for hot clusters (e.g., Markevitch 1998), while theory predicts (e.g., Kaiser 1981). Such deviations may be due to non-gravitational processes such as preheating (e.g., Cavaliere, Menci & Tozzi 1997) or radiative cooling and feedback from star formation (Voit & Bryan 2001). Observing the evolution of scaling relations can provide useful constraints on such models. The scaling relations at high redshift also are of great value for cosmological studies based on cluster evolution. They provide the means to convert an easily observed X-ray luminosity function into the more cosmologically useful temperature or mass functions (e.g., Borgani et al. 2001).
Most of the previous high redshift studies have focused on the relation. Mushotzky & Scharf (1997) analyzed a large sample of distant clusters observed with ASCA (most at , with a few at ) and found no evidence for evolution in the relation. Several results for a small number of distant cluster observed by Chandra have been published recently. Borgani et al. (2001) analyzed a sample of 7 clusters at and concluded that the data allow at most a very mild evolution — if the luminosity for the given temperature is , then . A similar conclusion has been reached by Holden et al. (2002) from an analysis of 12 clusters at .
The relation at both low and high redshifts has a large intrinsic scatter, comparable to the expected evolutionary effects. The scatter in the low-redshift relation is significantly reduced when the central cooling regions of the clusters are excised from both the luminosity and temperature measurements (Fabian et al. 1994, Markevitch 1998). Therefore, it is desirable to exclude the cooling cores in the distant clusters because this too may reduce the scatter and thus more easily expose any evolution. This task is feasible only with the Chandra’s arcsecond angular resolution.
As of Spring 2002, Chandra had observed 22 clusters at with sufficient exposure for accurate temperature measurements. Most of this sample is derived from flux-limited X-ray surveys: 7 clusters from the EMSS (Henry et al. 1992), 11 from the ROSAT serendipitous surveys, 160 deg2 (Vikhlinin et al. 1998), RDCS (Rosati et al. 1998), WARPS (Ebeling et al. 2000), and 2 from the ROSAT All-Sky Survey. We use these Chandra observations to derive correlations between the X-ray luminosity, temperature, and gas mass at .
We use km s-1 Mpc-1 throughout.
| Name | |||||
|---|---|---|---|---|---|
| (keV) | |||||
| MS 0016+1609 | 0.541 | 22.8 | 113.3 | ||
| MS 0302+1658 | 0.424 | 4.7 | 10.6 | ||
| MS 0451–0305 | 0.537 | 20.7 | 91.7 | ||
| MS 1054–0321 | 0.823 | 16.5 | 70.9 | ||
| MS 1137+6625 | 0.782 | 8.4 | 32.4 | ||
| MS 1621+2640 | 0.426 | 6.3 | 27.0 | ||
| MS 2053-0449 | 0.583 | 3.5 | 10.8 | ||
| CL 1120+2326 | 0.562 | 3.7 | 12.5 | ||
| CL 1221+4918 | 0.700 | 7.0 | 28.7 | ||
| CL 1416+4446 | 0.400 | 4.2 | 8.9 | ||
| CL 1524+0957 | 0.516 | 4.5 | 15.7 | ||
| CL 1701+6421 | 0.453 | 4.9 | 15.9 | ||
| CL 0848+4456 | 0.574 | 10.6 | 38.8 | ||
| WARPS 0152–1357 | 0.833 | 1.2 | 3.1 | ||
| RDCS 0848+4452 | 1.261 | 1.8 | 6.0 | ||
| RDCS 0910+5422 | 1.100 | 2.0 | 5.9 | ||
| RDCS 1317+2911 | 0.805 | 0.8 | 2.0 | ||
| RDCS 1350.0+6007 | 0.805 | 4.2 | 13.2 | ||
| RASS 1347–114 | 0.451 | 60.1 | 260.4 | ||
| RASS 1716+6708 | 0.813 | 7.2 | 28.8 | ||
| 3C295 | 0.460 | 9.1 | 16.3 | ||
| CL0024+17 | 0.394 | 3.1 | 9.2 |
a — Total X-ray luminosity in the 0.5–2 keV band within the 2 Mpc radius, erg s-1. b — Bolometric luminosity within the 2 Mpc radius excluding the central cooling regions, erg s-1. All quantities are computed for the , cosmology.
2 Data Analysis
Chandra data were reduced in a standard manner (see Markevitch & Vikhlinin 2001 for a fuller description of our procedures). Spectral analysis was performed in the 0.8–10 keV band, to minimize the calibration uncertainties due to time-dependent decrease in the low energy quantum efficiency111cxc.harvard.edu Calibration ACIS April HEAD Meeting. The effective area below 1.8 keV in the front-illuminated CCDs was corrected by an empirical factor of 0.93 to improve the cross-calibration with the back-illuminated CCDs (see Markevitch & Vikhlinin 2001 for details). Background maps were generated using the prescriptions of Markevitch (2002). Cluster spectra were fit with the MEKAL model, with absorption fixed at the Galactic value, and abundance fixed at Solar unless the quality of the data allowed a direct measurement.
The imaging analysis was performed in the 0.7–2 keV energy band, but we also checked 2–7 keV images to excise hard, self-absorbed sources which may contaminate the spectral analysis of the faintest clusters.
Our aim was to compare the high-redshift relation with the low-redshift one from Markevitch (1998), and so we followed this analysis as closely as possible. Temperatures were measured by fitting a spectrum integrated within a radius of 0.5–1 Mpc with a single-temperature MEKAL model; this region contained at least 75% of the total cluster flux. The bolometric X-ray luminosity was computed by normalizing the best-fit spectral model by the observed total 0.7–2 keV count rate within 2 Mpc. The extrapolation of a typical -model profile shows that at most 4% of the X-ray flux originates outside this radius, which we ignore. The clusters with sharply peaked surface brightness profiles are likely to contain cooling cores, and so we excluded the central 100 kpc regions in such clusters from both the spectral analysis and count rate computations, multiplying the measured count rates by 1.06 to account for the flux within kpc in a typical -model cluster.

It is important to verify that there is no systematic difference between our Chandra and earlier ASCA temperature measurements. Using the procedure outlined above, we derived temperatures for a number of nearby clusters from the ASCA samples of Markevitch (1998) and White (2000) and confirmed that on average, the agreement between Chandra and ASCA measurements is at a level of 5% or better (Fig. 2).
3 Results
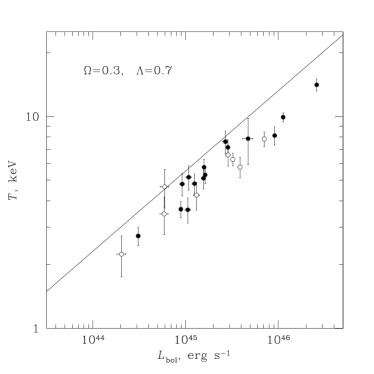
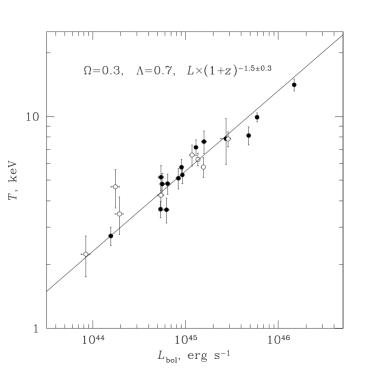
The resulting correlation in the , cosmology is shown in Fig. 2. The scatter in the correlation is very small — it is almost consistent with the measurement uncertainties. The slope is consistent with the low-redshift relation, but the normalization is significantly different — for the same temperature, clusters at high redshift are more luminous. If the -dependence of the correlation is parameterized as with fixed at its local value of 2.64, then (90% confidence) for this cosmology. For , , evolution of the relation is weaker, but still significant (Table 3).
Let us now consider correlations involving the gas mass. Assuming spherical symmetry, the radial profile of the gas mass in a cluster is trivially derived from the observed X-ray surface brightness profile. The main question is: within which radius to measure the gas mass? We chose the radius defined by the mean gas overdensity over the average baryon density in the Universe , where is the gas mass within the radius , and is the average baryon density from Big Bang nucleosynthesis theory (Burles, Nollett, & Turner 2001). This choice is motivated by two considerations. First, if the mass fraction of baryons in clusters is representative of that for the Universe as a whole, then at large distances from the cluster center, should equal the mean total mass overdensity, , and at the same time is easily determined from the X-ray imaging data (our procedure is described in Vikhlinin et al. 1999). Strictly speaking, the baryon mass should include the stellar material but we ignore this minor contributor. Second, Jenkins et al. (2001) developed a universal model for the cluster total mass function for masses corresponding to at the redshift of observation, therefore our values can be readily compared to theoretical predictions.
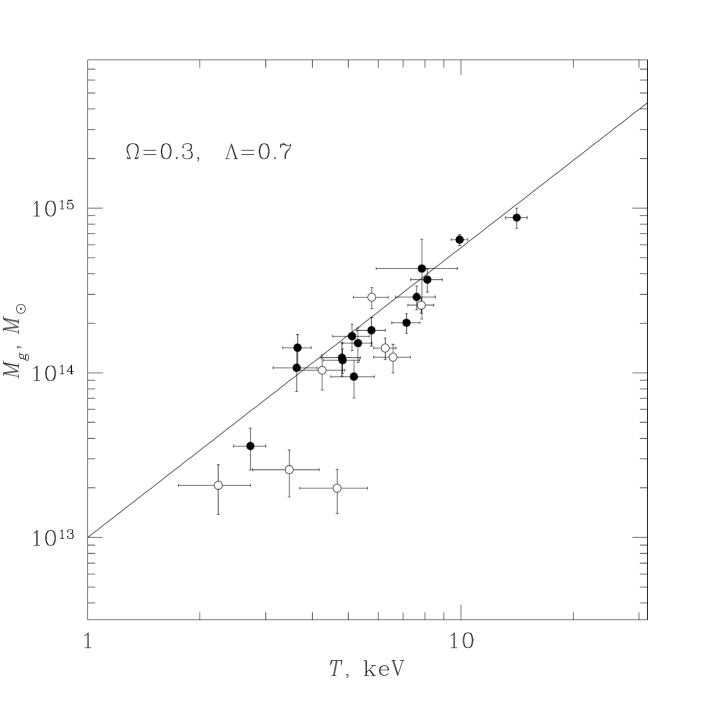
Figure 3 shows the correlation of with the cluster temperature. The solid line shows this relation for a sample of low-redshift clusters (Voevodkin et al. 2002a). For the , cosmology, the evolution is very weak. If the -dependence in the correlation is parameterized as with fixed on its local value of 1.76, then . For , , the derived gas masses are significantly smaller and there is a strong evolution in the relation, .
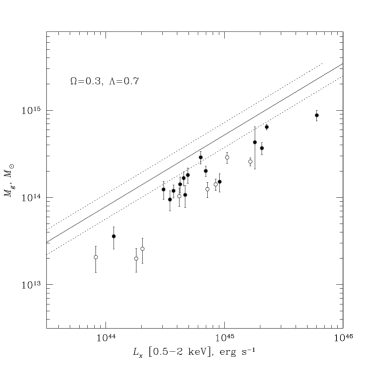
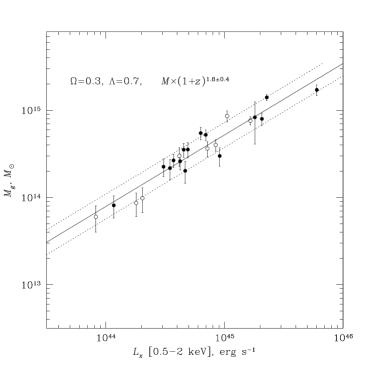
Figure 4 shows a correlation of with the X-ray luminosity. This relation is potentially useful for estimating the mass function from the X-ray luminosity function for distant clusters. Therefore, we used in this case the total cluster luminosity (i.e. not excluding the central regions) in the 0.5–2 keV energy band — the quantity commonly measured in the serendipitous ROSAT cluster surveys. The solid line in Fig. 4 shows the correlation for low-redshift clusters (Voevodkin et al. 2002b). The relation shows a strong evolution in all cosmologies. If its -dependence is parameterized as a power law, with fixed at its local value of , then (Table 3).
| Cosmology | ||||
|---|---|---|---|---|
| , | ||||
| , |
For other cosmologies, the power law slopes in the relations , , can be approximated by interpolating over . Uncertainties are at the 90% confidence level for a single parameter.
4 Discussion and conclusions
We have used Chandra observations of a sample of 22 distant, , clusters to show that the correlations between the cluster temperature, luminosity, and gas mass evolve significantly with respect to the low-redshift relations.
Our detection of significant evolution in the relation appears to contradict some other recent Chandra studies (Borgani et al. 2001, Holden et al. 2002). The difference between their and our results can be traced mostly to a more consistent comparison of the high- and low-redshift samples, such as exclusion of the cool cores and extraction of the luminosities in the 2 Mpc aperture. Note that the results of Novicki et al. (2002) who self-consistently use ASCA data for the nearby and distant clusters, agree well with our evolution.
It is theoretically expected that within clusters, the baryon contribution to the total mass, , should be close to the average value in the Universe (e.g., White et al. 1993). This notion continues to gain observational support (most recently, Allen, Schmidt & Fabian 2002). If is indeed constant, the evolutions in the and relations involving the gas mass or total mass should be identical.
The observed evolution of the cluster correlations indicates that clusters at high redshift were systematically denser than at present — hotter and more luminous for a given mass, as expected in a theory of the hierarchical self-similar formation. However, the details of the observed evolution contradict the self-similar predictions. For example, the standard theory (e.g., Bryan & Norman 1998) predicts that for a given temperature, the product should be constant, where is the mass measured within the radius of the overdensity with respect to the critical density at redshift , and is the Hubble constant. For the realistic cluster density profiles, this implies that approximately in almost any cosmology, where corresponds to the mean overdensity relative to the average density at redshift . However, we observe little evolution in the relation for the currently favored , cosmology, seemingly at odds with the theoretical prediction. This possibly indicates the importance of non-gravitational processes for heating the intracluster gas that would change but are unlikely to modify , just as is inferred from the scaling relations for low-redshift clusters.
References
- (1)
- (2) Allen, S. W., Schmidt, R. W., & Fabian, A. C. 2002, MNRAS, in press (astro-ph/0205007)
- (3)
- (4) Arnaud, M. & Evrard, A. E. 1999, MNRAS, 305, 631
- (5)
- (6) Borgani, S. et al. 2001, ApJ, 561, 13
- (7)
- (8) Bryan, G. L. & Norman, M. L. 1998, ApJ, 495, 80
- (9)
- (10) Burles, S., Nollett, K. M., & Turner, M. S. 2001, ApJ, 552, L1
- (11)
- (12) Cavaliere, A., Menci, N., & Tozzi, P. 1997, ApJ, 484, L21
- (13)
- (14) David, L. P., Slyz, A., Jones, C., Forman, W., Vrtilek, S. D., & Arnaud, K. A. 1993, ApJ, 412, 479
- (15)
- (16) Ebeling, H. et al. 2000, ApJ, 534, 133
- (17)
- (18) Fabian, A. C., Crawford, C. S., Edge, A. C., & Mushotzky, R. F. 1994, MNRAS, 267, 779
- (19)
- (20) Henry, J. P., Gioia, I. M., Maccacaro, T., Morris, S. L., Stocke, J. T., & Wolter, A. 1992, ApJ, 386, 408
- (21)
- (22) Holden, B. P., Stanford, S. A., Squires, G. K., Rosati, P., Tozzi, P., Eisenhardt, P., Spinrad, H., 2002, AJ, in press (astro-ph/0203474)
- (23)
- (24) Kaiser, N. 1991, ApJ, 383, 104
- (25)
- (26) Markevitch, M. 1998, ApJ, 504, 27
- (27)
- (28) Markevitch, M. 2002, astro-ph/0205333
- (29)
- (30) Markevitch, M. & Vikhlinin, A. 2001, ApJ, 563, 95
- (31)
- (32) Mohr, J. J., Mathiesen, B., & Evrard, A. E. 1999, ApJ, 517, 627
- (33)
- (34) Mushotzky, R. F., Phys. Scr., T7, 157
- (35)
- (36) Mushotzky, R. F. & Scharf, C. A. 1997, ApJ, 482, L13
- (37)
- (38) Novicki, M. C., Sornig, M., & Henry, J. P. 2002, ApJ, submitted
- (39)
- (40) Rosati, P., della Ceca, R., Norman, C., & Giacconi, R. 1998, ApJ, 492, L21
- (41)
- (42) Vikhlinin, A., McNamara, B. R., Forman, W., Jones, C., Quintana, H., & Hornstrup, A. 1998, ApJ, 502, 558
- (43)
- (44) Vikhlinin, A., Forman, W., & Jones, C. 1999, ApJ, 525, 47
- (45)
- (46) Voevodkin, A., Vikhlinin, A., & Pavlinsky, M. N. 2002a, Astronomy Letters, 28, 366.
- (47)
- (48) 2002b, Astronomy Letters, submitted.
- (49)
- (50) Voit, G. M. & Bryan, G. L. 2001, Nature, 414, 425
- (51)
- (52) White, D. A. 2000, MNRAS, 312, 663
- (53)
- (54) White, S. D. M., Navarro, J. F., Evrard, A. E., & Frenk, C. S. 1993, Nature, 366, 429
- (55)