Chandra Observations of the Evolving Core of the Starburst Galaxy NGC 253
Abstract
Chandra observations of the core of the nearby starburst galaxy NGC 253 reveal a heavily absorbed source of hard X-rays embedded within the nuclear starburst region. The source has an unabsorbed, 2 to 10 keV luminosity of erg s-1 and photoionizes the surrounding gas. We observe this source through a dusty torus with a neutral absorbing column density of cm-2. The torus is hundreds of pc across and collimates the starburst-driven nuclear outflow. We suggest that the ionizing source is an intermediate-mass black hole or a weakly accreting supermassive black hole, which may signal the beginnings or endings of AGN activity.
1 Introduction
In recent years, there has been increasing speculation about the connection between circumnuclear starbursts and active galactic nuclei (AGN). Such speculation is due mostly to the fact that, as our instruments allow us to probe closer to the cores of nearby galaxies, we find that an an increasing number contain starbursts and AGN in close proximity (Levenson, Weaver and Heckman 2001, and references therein). It is not clear whether proximity implies a physical connection, but a circumnuclear starburst could easily provide a pathway toward forming a supermassive black hole (and subsequent AGN), since it can processes as much as M☉ of material in years (Norman and Scoville 1988). To date, however, there has been little direct evidence for this scenario.
X-rays can penetrate the dense cores of nearby galaxies and are thus crucial for probing the possible links between starburst and AGN activity. For this purpose, we have obtained Chandra observations of the nearby ( Mpc) starburst galaxy NGC 253. This galaxy possesses a strong circumnuclear starburst (Strickland et al. 2000) and evidence for a weak AGN (Turner & Ho 1995, Mohan, Anantharamaiah & Goss 2002). Chandra, with its resolution of ( pc at NGC 253) allows us to untangle the X-ray emission processes due to stellar and non-stellar activity for the first time at the core of the galaxy.
2 Data Analysis
The Chandra data were obtained with the CCD Imaging Spectrometer (ACIS) on 1999 December 16 (see Strickland et al. 2000). The absolute astrometric accuracy of the nuclear pointing is rms. We used CIAO version 2.1.3 and HEASOFT version 5.1 for data analysis. In addition, we reprocessed the data with gain-correction files optimized for the actual focal-plane temperature of C (acisD2000…gainN0003.fits), as opposed to C (Strickland et al. 2000).
The X-ray spectrum of the galaxy core contains photons, which is adequate for fitting spectral models if the data are binned as a function of energy. On the other hand, the narrow spectral features are better seen in the unbinned data. We therefore examine the binned and the unbinned spectrum, using the statistical techniques of and the c-statistic, respectively.
3 The ACIS Image
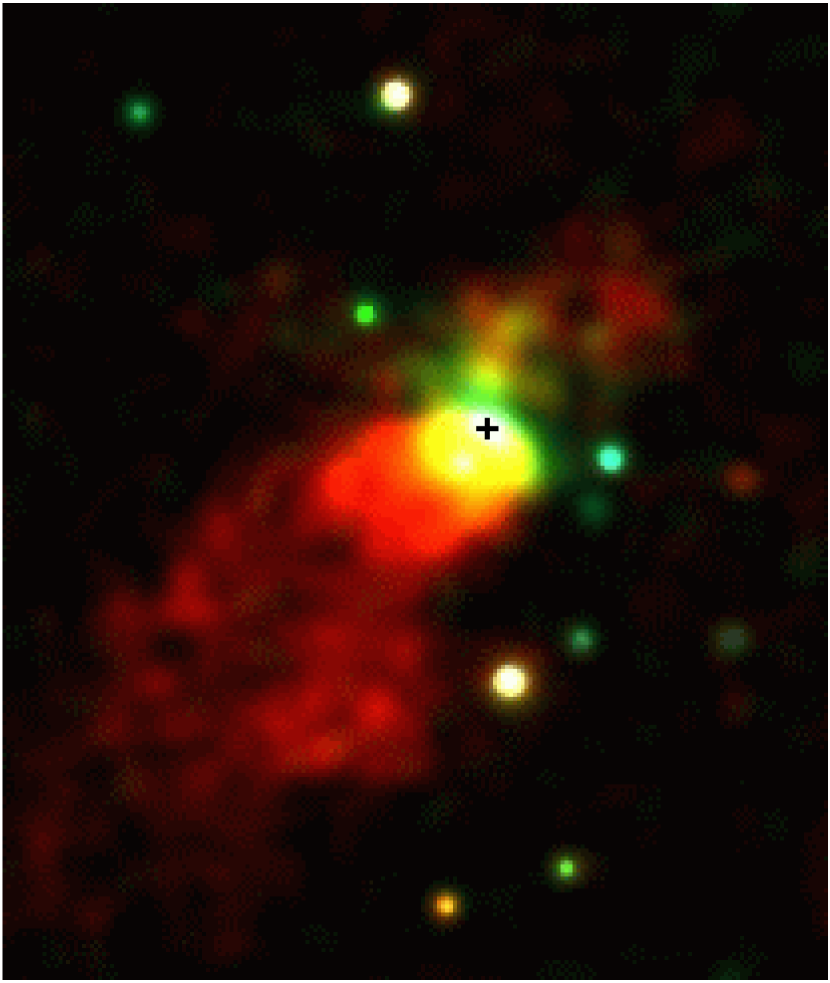
A three color composite Chandra image of the central (1.4 x 1.6 kpc) region of NGC 253 is shown in Figure 1. The cross marks the position of the compact radio nucleus (Turner and Ho 1985), which is assumed to lie at the core of the galaxy. The colors have been optimized with energy to best show the hard X-ray, arc-shaped feature (seen in green) that lies along the plane of the galaxy. The arc is approximately by (60 pc by 300 pc); its color indicates significant foreground absorption of soft X-rays.
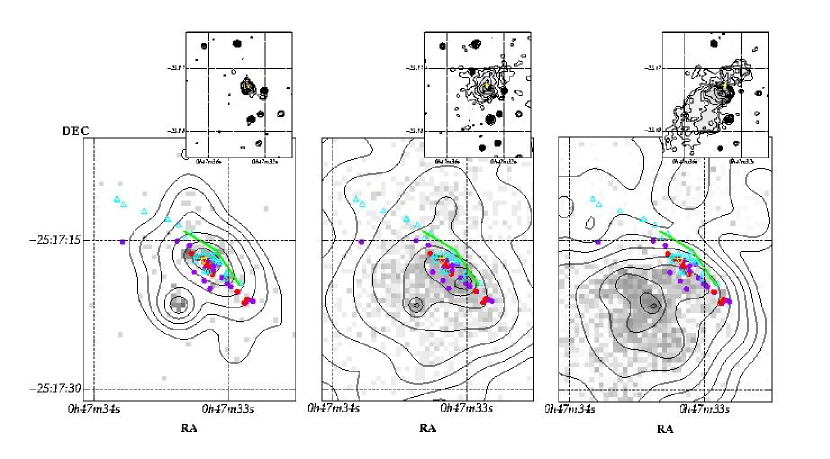
Figure 2 shows a closer view (26′′ by 37′′) in the three energy bands that make up Figure 1. The solid green line marks the location of an extended region of radio emission, which is interpreted as a pc rotating, dusty torus (Israel, White and Baas 1995, Dahlem et al. in prep.). The X-ray spectrum of the galaxy core indicates cm-2 through the torus, which is consistent with the H2 column densities deduced from the interferometer maps of this region (Frayer, Seaquist and Frail 1998, Peng et al. 1996). The position of the arc with respect to the outflow suggests that the torus is the collimating mechanism for the outflow, and so we will refer to it throughout the rest of the paper as the collimating torus. The inner edge of the collimating torus is defined by a loop of optical/IR sources while OH maser and compact radio sources mark the nuclear ridge of star formation in the dense regions where the gas piles up as it orbits in the bar potential (Peng et al. 1996).
The hard X-ray emission is partly extended along the nuclear ridge, coincident with the radio and maser sources and confined to a relatively small, 5′′ ( pc) area. It is not clear whether the peak in hard X-ray emission is point like, but it is coincident with the compact synchrotron source at the center of the galaxy, which has a flat radio spectrum () and a brightness temperature of T K. This temperature is too high to be due to free-free emission from H II regions, but is within the upper limit for the brightness temperature in starbursts (Condon et al. 1991). On the other hand, hints of a non-starburst origin are found from observations of radio recombination line emission, which implies a source of ionizing radiation with a flux of photons s-1 (Mohan, Anantharamaiah & Goss (2002).
We note that the Chandra data are not sensitive to the hard X-ray emission on much larger scales, such as that observed with XMM (Pietsch, et al. 2000).
4 The Nuclear Spectrum
The nuclear spectrum is extracted from within a circular region of diameter centered to the northeast of the radio nucleus (to avoid contamination from a young star cluster associated with the peak in the medium X-ray image in Figure 2b). The results of Gaussian fits to the emission lines are listed in Table 1. All lines are detected with a confidence level of according to an F-test. The core spectrum, binned for illustration purposes, is shown in Figure 3a.
He-like triplets of Mg, Si and S indicate a strong contribution from an optically thin plasma. However, the line equivalent widths are unusually large and inconsistent with a thermal gas with solar abundance ratios for a plasma in ionization equilibrium (Mewe et al. 1985; Kaastra 1992; Liedahl, Osterheld and Goldstein 1995). This is borne out by the binned spectrum, which cannot be fitted with single or multi-temperature thermal plasma models with solar abundances (Models 1, 2, and 3, Table 2). When the high-temperature Mekal component is replaced with a power law (Model 4), an excellent fit is obtained (=1.03). The problem is that the photon index of is much smaller than observed for any known type of X-ray emitter. Allowing a second, larger absorbing column in front of the high-energy component, results in a more realistic description of either a thermal plasma with solar abundances (Model 5) or a power law with reasonable values of , as might be expected for an AGN or XRBs (Model 6). For Model 6 the best-fitting absorbing column density is cm-2 and the unabsorbed keV luminosity is erg s-1.
Although the binned spectrum is statistically well described by models 5 or 6, the features between 3 and 6 keV that show up prominently in the unbinned data are not predicted by either model. We have verified that similar features exist in the archived XMM data. Such features are presumably due to Ar and Ca, and are predicted at or near their observed energies for a highly photoionized plasma (Bautista & Kallman 2000). We therefore added another component to our model; this one representing emission from a spherical distribution of clouds with density cm-3 that fully cover a central, power-law source with . The model was generated with xstar (heasarc.gsfc.nasa.gov/docs/software/xstar), and represents conditions similar to the core of a Seyfert 1 galaxy (T. Yaqoob, private communication). The final, best-fitting model is a three-component hybrid plasma model, consisting of a moderately-absorbed, low-temperature Mekal plasma plus a heavily-absorbed power law and emission from a photoionized plasma with ionization parameter (Figure 3b). The results from fitting this model to the binned spectrum are listed in Table 2 (Model 7).
5 The Nature of the Hard X-ray Source
Our analysis of the Chandra data suggests the presence of a significant source of photoionization at the center of the nearby galaxy NGC 253. This result compliments the recent discovery of resolved (FWHM km s-1), radio recombination line emission at the same location by Mohan et al. (2002). These authors rule out a compact SNR and young star cluster as the ionizing source. Similarly, we find such sources implausible because they would produce a softer ionizing X-ray spectrum than observed. We therefore consider other plausible sources of hard X-rays.
5.1 Inverse-Compton Emission
We can estimate the contribution of inverse Compton emission in NGC 253 following the arguments in Moran, Lehnert, & Helfand (1999). The ratio of the inverse Compton and synchrotron luminosities () is given by the ratio of the energy density in the seed photon field to the energy density in the magnetic field. To estimate the former, we first use the well-known radio-infrared correlation for star-forming galaxies (Condon 1992) and the high resolution 20-cm VLA radio map from Ulvestad & Antonucci (1997) to deduce that the far-infrared luminosity of the central-most 5 arcsec in NGC 253 is erg s-1. Adopting the mean bolometric correction of 1.75 measured for dusty starburst galaxies by Calzetti et al. (2000), the bolometric surface-brightness of the nucleus of NGC 253 is then = 320 erg cm-2 s-1 and the radiant energy density is erg cm-3. To estimate the energy density in the magnetic field, we apply standard minimum-energy assumptions to the VLA 20cm radio data. We take Condon’s (1992) equation 13 with = 40 (the galactic value for the proton/electron energy ratio) and a path length of 60 pc (5 arcsec). This implies a magnetic field strength of 270 G and an energy density erg cm-3.
Thus, we estimate that = 3.8. At 20 cm, the monochromatic power of the central 5 arcsec is Pν = 7.5 erg s-1, while the corresponding power at 4.5 keV is erg s-1. This suggests that the inverse Compton process makes only a minor contribution to the hard X-ray emission. However, we emphasize that our estimate is rough. Within the context of our estimate, a dominant inverse Compton contribution to the hard X-rays seemingly requires that the magnetic field strength is about a factor of 7 below the minimum-energy value.
5.2 An Evolved Starburst
The nuclear starburst in NGC 253 is approximately 20 to 30 million years old (Engelbracht et al. 1998), which implies that its hard X-ray emission is dominated by XRBs (Van Bever & Vanbeveren 2000). Only a handful of bright XRBs would be required to produce the observed keV luminosity of erg s-1 (Grimm, Gilfanov & Sunyaev 2001). On the other hand, the equivalent widths of the emission lines are tens to hundreds of times larger than those of Galactic XRBs (Asai et al. 2000). If several bright XRBs are the source of the continuum photons, they must be located behind a significant amount of absorbing material that suppresses the photoionizing continuum.
We can estimate the continuum luminosity required to produce the observed line strengths. For an ionization parameter of and a column density of cm-2, line luminosities of erg s-1 require a a continuum luminosity of at least erg s-1 (Kallman 1991). This would make the continuum source an ultraluminous compact X-ray source111Having an X-ray luminosity higher than erg s-1, the Eddington luminosity of a 1.4 solar mass accreting neutron star. and similar to the luminous X-ray source near the center of M 82 (Matsumoto et al. 2001). Given the location of the ultraluminous source coincident with the radio core of NGC 253, chances are high that it is an intermediate mass, accreting black hole (IMBH).
5.3 A Buried AGN
If an IMBH could be lurking at the core of NGC 253, then might a low-luminosity AGN (LLAGN) be lurking there as well? Interestingly, Mohan et al. (2002) find that, if they assume an AGN is responsible for producing the radio recombination line emission, the observed X-ray luminosity is times less than that required to produce the ionizing photon flux. This deficiency in X-ray flux is easily explained if, in addition to intersecting the collimating torus, our line of sight to the central source is blocked by gas that is Compton thick, with column density of cm-2. If the hard X-ray power-law continuum represents scattered X-rays and NGC 253 is similar to Seyfert 2 galaxies with buried nuclei (Awaki et al. 2000), this would make the intrinsic X-ray luminosity at least erg s-1. The relatively low luminosity compared to other AGN might then result from advection dominated accretion or the lack of sufficient fuel, which is possible if the AGN is turning on or off.
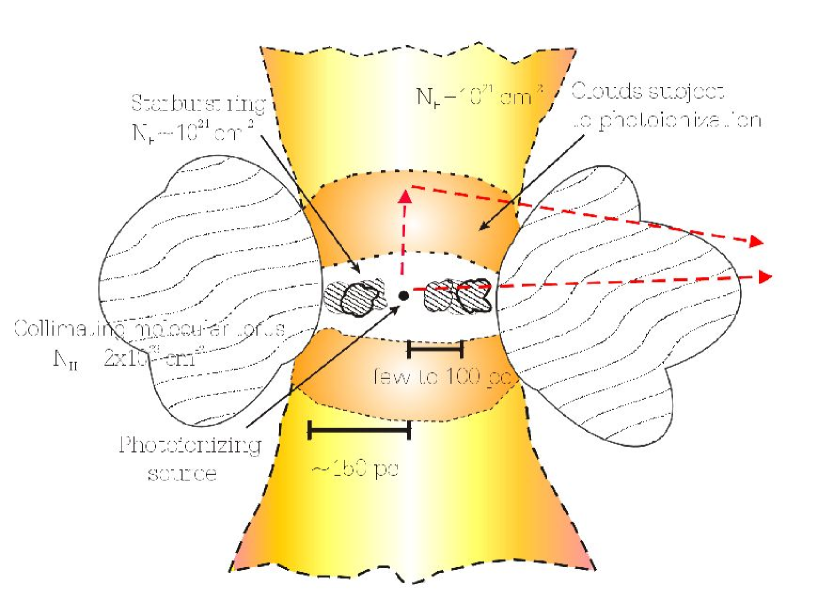
Our proposed geometry for the core of NGC 253 is shown in Figure 4. The central source, possibly an IMBH or LLAGN, sits at the kinematic center of the pc diameter collimating torus. The kinetic energy of the starburst has forced gas that used to occupy this cavity into the base of the starburst-driven wind, clearing a path for X-rays to escape. The X-rays are scattered from and also photoionize the surrounding material. Additional obscuration is provided by a starburst ring that provides the radiation force to support the torus (Ohsuga & Umemura 1999). This material may be Compton thick. The high ionization parameter of the surrounding gas suggests physical conditions that are similar to ionized absorbers in Seyfert 1 galaxies, but in this case we would be seeing the region from the side, in emission, rather than face on, in absorption.
We have shown that conditions at the center of NGC 253 provide fertile ground for studying the connection between starburst and AGN activity. The gas associated with the circumnuclear starburst is responsible for obscuring the central continuum source. This scenario has been predicted for the early stages of AGN formation (e.g., Sanders et al. 1988), but more importantly, it shows that the putative pc-scale molecular torus in Seyfert 2 galaxies is not the only mechanism by which an AGN-like continuum source can be hidden from our view. We speculate that NGC 253 is in an evolutionary state where it is transitioning between a starburst and AGN phase.
6 Conclusions
Chandra X-ray observations of the nearby starburst galaxy NGC 253 reveal what may be the beginnings or endings of AGN activity. The excellent spatial resolution allows us to isolate the optically-thick torus that collimates the starburst-driven nuclear outflow. At the center of the torus, along with the evolved, circumnuclear starburst, is a source of hard X-rays with an unabsorbed, 2 to 10 keV luminosity of erg s-1. We suggest that this ionizing source is an intermediate-mass black hole or weakly accreting supermassive black hole. These data provide a unique look at the complex interplay between starburst and AGN activity.
Future tests of the starburst-AGN scenario will require studying older starburst populations in nearby galaxies. In particular, it is important to look at normal stars in the optical or at X-ray binaries with Chandra in the more evolved, more AGN-like composite (Seyfert/starburst) galaxies.
References
- (1) Asai, K., Dotani, T., Nagase, F. and Mitsuda, K. 2000, ApJS, 131, 571
- (2) Awaki, H., Ueno, S., Taniguchi, Y. and Weaver, K. A. 2000, ApJ, 542, 175
- (3) Bautista, M. A. and Kallman, T. R. 2000, ApJ, 544, 581
- (4) Calzetti, D., Armus, L., Bohlin, R., Kinney, A., Koorneef, J., & Storchi-Bergmann, T. 2000, ApJ, 533, 682
- (5) Condon, J. 1992, ARA&A, 30, 575
- (6) Condon, J. J., Huang, Z.-P., Yin, Q. F. and Thuan, T. X. 1991, ApJ, 378, 65
- (7) Engelbracht, C. W., Rieke, M. J., Rieke, G. H., Kelly, D. M. and Achtermann, J. M. 1998, ApJ, 505, 639
- (8) Forbes, D. A., Polehampton, E., Stevens, I. R., Brodie, J. P. and Ward, M. J. 2000, MNRAS, 312, 689
- (9) Frayer, D. T., Seaquist, E. R. and Frail, D. A. 1998, AJ, 115, 559
- (10) Grimm, H.-J., Gilfanov, M. and Sunyaev, R. (2001astro.ph..9239)
- (11) Israel, F. P., White, G. J. and Baas, F. 1995, AA, 302, 343
- (12) Kaastra, J.S. 1992, An X-Ray Spectral Code for Optically Thin Plasmas (Internal SRON-Leiden Report, updated version 2.0)
- (13) Kallman, T. R. and McCray, R. 1982, ApJS, 50, 263.
- (14) Kallman, T. R. 1991, “Iron Line Diagnostics in X-ray Sources,” eds. A. Treves, G. C. Perola, and L. Stella (Berlin:Springer-Verlag), 87
- (15) Levenson, N. A., Weaver, K. A. and Heckman, T. M. 2001, ApJ, 550, 230
- (16) Liedahl, D.A., Osterheld, A.L., and Goldstein, W.H. 1995, ApJL, 438, 115
- (17) Matsumoto, H. et al. 2001, ApJ, 547, L25
- (18) Mewe, R., Gronenschild, E.H.B.M., and van den Oord, G.H.J. 1985, A&AS, 62, 197
- (19) Mohan, N. R., Anantharamaiah, K. R. and Goss, W. M. 2002, ApJ, in press
- (20) Moran, E. C., Lehnert, M. D. and Helfand, D. J. 1999, ApJ, 526, 649
- (21) Mouri, H. and Taniguchi, Y. 2002, astro-ph/0201102
- (22) Norman, C. and Scoville, N. 1988, ApJ, 332, 124
- (23) Ohsuga, K. and Umemura, M. 1999, ApJ, 521, L13
- (24) Oliva, E., Origlia, L., Maiolino, R. and Moorwood, A. F. M. 1999, AA, 350, 9
- (25) Peng, R., Zhou, S., Whiteoak, J. B., Lo, K. Y. and Sutton, E. C. 1996, ApJ, 470, 821
- (26) Pietsch, W. et al., astro-ph/0010608
- (27) Quinlan, G. D. and Shapiro, S. L. 1990, ApJ, 356, 483
- (28) Sanders, D. B., Soifer, B. T., Elias, J. H., Neugebauer, G. and Matthews, K. 1988, ApJ, 328, L35
- (29) Strickland, D. K., Heckman, T. M., Weaver, K. A. & Dahlem, M. 2000, AJ, 120, 2965
- (30) Tremaine, S. D., Ostriker, J. P. and Spitzer Jr., L. 1975, ApJ, 196, 407
- (31) Turner, J. L. and Ho, P. T. P. 1985, ApJ, 299, L77
- (32) Ulvestad, J. S. and Antonucci, R. R. J. 1997, ApJ, 488, 621
- (33) Van Bever, J. and Vanbeveren., D. 2000, AA, 358, 462


| Energy | norma | EW | Luminosity | ID |
|---|---|---|---|---|
| (keV) | () | (eV) | ( erg s-1) | |
| 1.40 | 3.3(1.5-5.5) | 106(50-175) | 2.0 | Mg XI |
| 1.52 | 3.9(2.2-5.8) | 136(76-203) | 2.6 | Fe XXII |
| 1.86 | 5.1(3.5-7.5) | 232(161-342) | 4.2 | Si XIII |
| 2.02 | 4.3(2.7-6.3) | 218(136-323) | 3.7 | Si XIV |
| 2.460.02 | 7.2(4.8-9.8) | 464(313-643) | 7.7 | S XV |
| 3.05 | 2.5(1.0-4.6) | 222(90-401) | 3.9 | S XVI - Ar XVII |
| 4.08 | 1.5(0.4-3.2) | 190(56-403) | 3.2 | Ca XIX-XX |
| 4.61 | 1.5(0.4-3.3) | 222(63-479) | 3.5 | Ar Rad Rec Cont ? |
| 4.91 | 1.3(0.2-3.0) | 215(25-478) | 3.3 | ? |
| 5.58 | 2.2(0.6-4.2) | 410(120-800) | 5.1 | Ca Rad Rec Cont ? |
| 6.50 | 3.9(1.6-7.6) | 302(122-589) | 1.1 | Fe IV-XV |
| 6.79(6.75-6.86) | 5.9(2.8-10.2) | 618(290-1,060) | 1.8 | Fe XXV |
Note. — Data are unbinned and analyzed with the c-statistic. The continuum model is an absorbed power law with , N cm-2 and a normalization of photons keV-1 cm-2 s-1 at 1 keV.
| # | Model | kT1b | Z / log | or kT2b | F | F | |||
|---|---|---|---|---|---|---|---|---|---|
| 1 | M | 0.9 | 4.3 | 1f/ | 72/32 | 3.8 | 4.2 | ||
| 2 | M+M | 1.8 | 1.1 | 1f / | 47/30 | 4.2 | 5.0 | ||
| 3 | M+M | 2.0 | 1.2 | 7.5 / | / 20.0f | 40/29 | 4.5 | 5.5 | |
| 4 | M+P | 2.0 | 1.2 | 1f / | / | 34/35 | 6.8 | 7.9 | |
| 5 | M+M | 2.0 | 1.2 | 1f / | 45 | / 1.2f | 31/30 | 4.3 | 69.4 |
| 6 | M+P | 2.0 | 1.2 | 1f / | 18 | 1.9f / | 31/30 | 5.1 | 11.4 |
| 7 | M+P | 2.0 | 1.1 | 1f / 2.6 | 20 | 1.7f / | 26/27 | 12 | 23 |
| +Photd |
Note. — Data are grouped to have at least 15 counts per bin. Models are M=Mekal plasma, P=Power law, Phot=Emission from cool, photoionized plasma. f=fixed parameter.