Dynamical models for jet deceleration in the radio galaxy 3C 31
Abstract
We present a dynamical analysis of the flow in the jets of the low-luminosity radio galaxy 3C 31 based on our earlier geometrical and kinematic model (Laing & Bridle, 2002) and on estimates of the external pressure and density distributions from Chandra observations (Hardcastle et al., 2002). We apply conservation of particles, energy and momentum to derive the variations of pressure and density along the jets and show that there are self-consistent solutions for deceleration by injection of thermal matter. We initially take the jets to be in pressure equilibrium with the external medium at large distances from the nucleus and the momentum flux to be , where is the energy flux; we then progressively relax these constraints. With our initial assumptions, the energy flux is well determined: 9 – 14 W. We infer that the jets are over-pressured compared with the external medium at the flaring point (1.1 kpc from the nucleus) where they start to expand rapidly. Local minima in the density and pressure and maxima in the mass injection rate and Mach number occur at 3 kpc. Further out, the jets decelerate smoothly with a Mach number 1. The mass injection rate we infer is comparable with that expected from stellar mass loss throughout the cross-section of the jet close to the flaring point, but significantly exceeds it at large distances. We conclude that entrainment from the galactic atmosphere across the turbulent boundary layer of the jet is the dominant mass input process far from the nucleus, but that stellar mass loss may also contribute near the flaring point. The occurrence of a significant over-pressure at the flaring point leads us to suggest that it is the site of a stationary shock system, perhaps caused by reconfinement of an initially free jet. Our results are compatible with a jet consisting of plasma on parsec scales which picks up thermal matter from stellar mass loss to reach the inferred density and mass flux at the flaring point, but we cannot rule out an composition with a low-energy cut-off.
keywords:
galaxies: jets – galaxies:ISM – radio continuum:galaxies – X-rays: galaxies – hydrodynamics1 Introduction
The measurement of basic flow variables such as velocity, pressure and density in extragalactic radio jets has proved to be an intractable problem, most of the estimates in the literature being highly model-dependent (see Leahy 1991 for a review). We have recently shown that the total and polarized emission of the inner jets in the nearby radio galaxy 3C 31 can be modelled accurately on the assumption that they are symmetrical, axisymmetric, relativistic, decelerating flows (Laing & Bridle, 2002), and we derived a kinematic model for the jet flow that combined longitudinal deceleration and a transverse velocity gradient.
In order to make further progress in understanding jet dynamics, we need a physical model for the deceleration process. Mass loading must occur, but without disruption of the flow. As Begelman (1982) first pointed out, a jet can decelerate without being completely decollimated, but only in the presence of an external galactic pressure gradient, which effectively transforms heat back into kinetic energy. It is not straightforward to estimate the mass input from observations: synchrotron emission gives no direct evidence for the jet composition on kpc scales, and constraints from Faraday rotation are weak. Two principal mechanisms have been proposed for mass loading:
- 1.
-
2.
entrainment from the galactic atmosphere across an unstable boundary layer, and subsequent communication with the rest of the jet through ingestion of the thermal material and viscous interactions (Baan, 1980; Begelman, 1982; Bicknell, 1984, 1986; De Young, 1996; Rosen et al., 1999; Rosen & Hardee, 2000).
In the remainder of this paper, we will refer to these processes as internal and external entrainment, respectively.
The majority of theoretical work in the literature concerns non-relativistic jets, but there have been two approaches to the quantitative study of relativistic jet deceleration: through analytical models and simulations (Komissarov, 1994; Bowman et al., 1996) and through conservation law analysis (Bicknell, 1994). Komissarov (1994) considered analytically the case of an electron-positron jet decelerating as a result of internal entrainment and Bowman et al. (1996) made numerical simulations of decelerating electron-proton jets. Both of these references assumed that the jet dynamics were dominated by thermal particles (with energies too low to be seen via synchrotron radiation), although some of the cases they considered were hot enough to have a relativistic equation of state. These calculations were not designed to be compared directly with observations of individual objects and are restricted to internal entrainment.
Bicknell (1994) used the laws of conservation of mass, momentum and energy in a quasi-one-dimensional approximation to demonstrate the feasibility of deceleration from pc to kpc scales for relativistic jets, considering two specific sources: NGC 315 and NGC 6251. In contrast to Komissarov (1994) and Bowman et al. (1996), Bicknell assumed that relativistic particles are energetically dominant, and therefore that an ultra-relativistic equation of state is appropriate throughout. His formulation is general enough to cover both internal and external entrainment.
Our model for the jets in 3C 31 provides one essential ingredient for a dynamical analysis – the velocity field – but we also need to estimate how much mass participates in the flow. Our solution for the jet kinematics can be used to constrain the mass flux using the conservation-law formalism of Bicknell (1994), but only if we also have an accurate prescription for the external pressure and density. Such a prescription has recently been derived from Chandra observations by Hardcastle et al. (2002), and the present paper describes the resulting dynamical analysis of jet deceleration in 3C 31.
The conservation-law approach is described in Section 2. The results are presented in Section 3 and are discussed in the context of theoretical models in Section 4. Our conclusions are summarized in Section 5.
Throughout this paper, we adopt a Hubble constant = 70 km s-1 Mpc-1. We take the redshift of NGC 383 (the parent galaxy of 3C 31) to be 0.0169; this is the mean of values from Smith et al. (2000), Huchra, Vogeley & Geller (1999) and De Vaucouleurs et al. (1991). The resulting conversion factor between angular and linear size is 0.34 kpc /arcsec. We refer to two quantities that are conventionally notated as . We use alone for the normalized velocity , and for the form parameter in models of hot galactic atmospheres.
2 Conservation-law analysis
2.1 Overview
Our analysis uses conservation of particles, energy and momentum, and is based on that of Bicknell (1994), but with some important differences:
-
1.
We take the angle to the line of sight, velocity, and area of the jets from our kinematic model, thereby removing a number of free parameters.
-
2.
We do not need to make any assumptions about the relation between the internal pressure of the jet and the synchrotron minimum pressure , other than that .
-
3.
We infer the density and pressure distributions of the surrounding medium from X-ray observations.
-
4.
The effects of buoyancy are significant for our analysis, and we include them.
The analysis remains quasi-one-dimensional, in the sense that we consider only the component of velocity along the jet axis, but we allow the jet’s cross-sectional area to vary. We justify this assumption by noting that the maximum angle between the flow direction and the jet axis is 19∘. The axial velocity component is 0.945 of the total velocity even at the edge of the jet in the region where the lateral expansion is most rapid. The error in the quasi-one-dimensional approximation is therefore small compared with the uncertainties we consider below.
2.2 Geometry: the three jet regions
The essential features needed from the kinematic model (Laing & Bridle, 2002) are the geometry and velocity field of the jets. We divide the jets of 3C 31 into three regions by the shapes of their outer isophotes (Fig. 1; see Laing & Bridle 2002 for more details). The regions also turn out to be distinct in their kinematic structures (Fig. 2). We have used the fitted angle to the line of sight (52.4∘) to correct for projection, and all distances are given in a plane containing the jet axis. The regions are:
- Inner
-
(0 to 1.1 kpc): a cone of intrinsic half-angle 6.7∘ in which the fitted central velocity is 0.8 – 0.9. There is no unambiguous evidence for deceleration, but a significant component of emission appears to come from slow-moving material.
- Flaring
-
(1.1 to 3.5 kpc): the outer isophotes spread rapidly and then recollimate. The boundary with the inner region appears to mark a discontinuity at which the emissivity increases abruptly and the velocity probably decreases. In this region, the jets decelerate rapidly after an initial slow decline in velocity.
- Outer
-
(3.5 to 12 kpc): the jets continue to expand in a cone of intrinsic half-angle 13.1∘ and decelerate smoothly.
We refer to the boundary between the inner and flaring regions as the “flaring point”, following Parma et al. (1987). We do not attempt to apply the conservation-law approach to the inner region, for several reasons. Firstly, the jets are weak and poorly resolved close to the nucleus, so our conclusions about their velocity structure are tentative. Secondly, our formalism cannot handle the inferred discontinuity in velocity and pressure at the flaring point without introducing extra complexity. Finally, the external pressure and density are uncertain at very small distances from the nucleus, where the X-ray emission from core, jet and hot gas is unresolved by Chandra. In particular, the presence of an unresolved, dense component of hot gas was postulated by Hardcastle et al. (2002) in order to explain the observed X-ray spectrum of the core. We restrict our conservation-law analysis to between 1.1 and 12 kpc from the nucleus.
In what follows, is a radial distance from the nucleus and is the cross-sectional area of the jets derived from our geometrical model.


2.3 Velocity profile
In order to reduce the problem to a quasi-one-dimensional form we need to average in some way over the transverse jet velocity profile. For the flaring and outer regions, the best-fitting transverse profile remains remarkably constant: the velocity at the edge of the jet is 0.7 of its central value throughout these regions. The transverse variation of emissivity is also modelled, and may be used to derive the corresponding relativistic particle and energy density profiles, but only if some assumption is made about the relative energies in field and particles. We do not know the spatial distribution of the entrained material and would expect qualitative differences between stellar mass loss (which would cause material to be injected fairly uniformly) and entrainment around the edges of the jets.
We assume that all of these complications can be absorbed into a single velocity function , which is bounded at any value of by the maximum (centre) and minimum (edge) values of our kinematic model. The approximation is reasonable, since we infer a velocity difference of only 30% between centre and edge of the jet and, in order to slow the jet effectively, any entrained material must become well mixed with the relativistic particles and field. We have experimented with a number of expressions for consistent with this constraint.
The widest range of acceptable solutions (in the sense defined below) is given by a simple law in which the velocity is a constant fraction of the on-axis value for the kinematic model (the full line in Fig. 2); hereafter a “constant-fraction” profile. We have also investigated “ramped profiles” in which the velocity decreases from the on-axis value, , at the flaring point () to a fraction of the on-axis value at the end of the modelled region (). We present results for a linear variation: . Other functional forms give essentially identical results for a given value of . For both constant-fraction and ramped profiles, we have investigated the range , the lower bound being slightly less than the fractional velocity at the edge of the jet in our kinematic model.
2.4 Conservation laws
Following Bicknell (1994), we make the approximation that the jet material has an ultra-relativistic equation of state throughout the modelled region and therefore that dissipation of bulk kinetic energy results only in an increase in the internal energy, , of relativistic particles and magnetic field, with . We also assume that the entrained enthalpy is negligible. We have verified post hoc that an extremely small fraction of the internal energy of the jet is lost via synchrotron radiation in the modelled region. We take the quantities (the energy flux, with the contribution from rest mass subtracted) and (the momentum flux) to be conserved. From equations (18) and (27) of Bicknell (1994), and after making the quasi-one dimensional approximation for the buoyancy term, we have
| (1) | |||||
| (2) | |||||
Here, and are the internal pressure and density of the jet, and the pressure and density of the external medium and the Lorentz factor of the bulk flow. at the innermost modelled point (the flaring point). Note that we are implicitly assuming that the kinetic energy associated with turbulence is small compared with that of the bulk flow. Unlike Bicknell (1994), we cannot neglect buoyancy (the second term in the equation for momentum flux), as the solutions turn out to require transonic flow over large distances.
The unknowns at each position are the internal pressure and density. If the external pressure and density are known, then for given values of the energy and momentum fluxes and we can solve equations (1) and (2) for the run of internal density and pressure along the jets. In the absence of buoyancy, there is an algebraic solution. If the buoyancy term is significant, we can solve the equations using a simple iterative scheme at a grid of locations from the flaring point outwards. This is necessary because the buoyancy integral depends on the density and pressure gradient at the current point (equation 2).
We can then derive the generalized internal Mach number (Königl, 1980):
| (3) |
where is the internal sound speed,
| (4) |
(Bicknell, 1994) and . The ratio of rest-mass energy to enthalpy, again as defined by Bicknell (1994), is:
| (5) |
and the mass flux:
| (6) |
In order to reduce the number of unknown parameters and hence to derive a unique solution of the conservation-law equations, we initially take . This is likely to be a very good approximation if is close to 1 on pc scales, as required by Unified Models and by the observation of superluminal motion on parsec scales in FR I jets (Urry & Padovani, 1995; Giovannini et al., 2001). The effects of dropping this assumption are investigated in Section 3.3.6. We also test the self-consistency of our other assumptions and explore the effects of relaxing them in Section 3.3.
2.5 External density and pressure
Our estimates of the surrounding density and pressure profiles are taken from Hardcastle et al. (2002). The density profile is the sum of two beta models, for the gas associated with the central galaxy NGC 383 and with the surrounding group, respectively.
| (7) | |||||
The temperature is taken to be:
| (8) |
with 22.8 arcsec (7.8 kpc). The pressure is calculated according to the expression given by Birkinshaw & Worrall (1993):
| (9) |
where is the mass per particle in a.m.u. and is the abundance of hydrogen by mass.
| Component | Central density | Form factor | Core radius | Temperature |
|---|---|---|---|---|
| Galaxy | m-3 | 1.2 kpc | 4.9 106 K | |
| Group | m-3 | 52 kpc | 1.7 107 K |
The numerical values of the parameters are listed in Table 1 and the variations of and with radius are shown in Fig. 3. Note the discontinuity in the temperature gradient and hence in the pressure gradient . The latter appears in the buoyancy term of equation (2) and therefore propagates into various derived quantities, most obviously the entrainment rate (see below).

2.6 Selection of acceptable solutions
We aim to determine what, if any, physically-reasonable solutions exist. All self-consistent solutions must have:
-
1.
everywhere;
-
2.
, where is the synchrotron minimum pressure;
-
3.
the mass flux increasing monotonically outwards;
-
4.
a convergent iterative solution for the buoyancy integral.
We also investigate the effects of additional constraints on the ratio of internal to external pressure:
-
5.
the jet pressure never exceeds that of the external medium by more than a factor of 10;
-
6.
the mean ratio of the internal and external pressures is in the range 0.5 – 2 in the outer region.
The over-pressure condition (v) can be justified qualitatively, since the jets cannot be in free expansion over the whole of the modelled region (otherwise they would expand with constant opening angle), and any high-pressure region must be localised and not too over-pressured for the jet to retain its collimation. The numerical over-pressure factor is difficult to assess, but values of up to 12.5 have been suggested for reconfining non-relativistic jets (Falle, 1987) and extremely high pressure jumps can occur across relativistic shocks (Bicknell & Begelman, 1996). Condition (vi) is derived from the supposition that the outer region must be in at least approximate pressure equilibrium. We have looked for solutions with and without the pressure constraints.
We have chosen to use the on-axis value of the model emissivity (Laing & Bridle, 2002) to calculate a representative minimum synchrotron pressure ( varies across the jets, so some sort of averaging is necessary). Following Bicknell (1994), we derive the pressure assuming constant energy limits for a power-law spectrum of radiating particles , where is the individual electron Lorentz factor and .
| (10) | |||||
where is the electron mass and is the permittivity of free space. We also assume that there are no relativistic protons and that the filling factor is unity, to ensure that is a lower limit to the correct value. Initially, we take and . The upper limit would correspond to an emitted frequency of Hz for a minimum-pressure magnetic field at the flaring point, roughly consistent with the synchrotron break frequency derived from the radio – X-ray spectrum of the inner and flaring regions by Hardcastle et al. (2002). We have no direct evidence for emission at 10 GHz in the outer region, however. The lower limit to the Lorentz-factor distribution is harder to estimate. Fortunately, for the jets in 3C 31, so the dependence of on the energy limits is very weak, at least if the form of the spectrum persists to low energies. We demonstrate the effect of changing the energy limits in Section 3.3.4.
Our approach is to calculate models for a range of energy flux, , determining which solutions are acceptable. We start with solutions in which the jets are close to pressure equilibrium at large distances from the nucleus, and progressively relax our assumptions.
3 Results
3.1 Reference model
A priori, the most physically plausible solutions are those which are as close as possible to pressure balance in the outer region. Although the shape of the jet in this region is conical, consistent with free expansion of an over-pressured flow, such solutions are not self-consistent:
-
1.
We infer Mach numbers ≲2 at the end of the flaring region, implying a half-opening angle ≳ 30∘, at least a factor of two larger than is observed.
-
2.
We will show that the entrainment rate needed to slow the jet is too large to be provided by stellar mass loss alone, implying that external entrainment dominates. This would be inconsistent with free expansion.
In what follows, we therefore adopt as our reference model the unique pressure-matched solution with and a constant velocity fraction . This is close to the median of the transverse profile estimated by Laing & Bridle 2002 and is therefore consistent with the average velocity that we infer for relativistic particles and field. An intermediate (perhaps somewhat lower) value of is also appropriate for the entrained material, which is likely to be concentrated at the edges of the jet, or distributed approximately uniformly, rather than being concentrated towards the axis. This model has an energy flux W and demonstrates the qualitative properties common to all acceptable solutions. In Section 3.2, we examine pressure-matched solutions with other velocity laws and Section 3.3 explores the effects of relaxing the assumptions on pressure balance and momentum flux.
3.1.1 Pressure
Fig. 4 shows the derived internal, external and synchrotron minimum pressures for the reference model and Fig. 5 shows the ratios and . The jet is over-pressured by a factor 8 at the start of the flaring region, comes into pressure equilibrium at 2.5 kpc from the nucleus, is slightly under-pressured at the end of the flaring region and thereafter tracks the external pressure accurately. The local pressure minimum in the outer part of the flaring region has , implying that the rapid outward decrease of pressure overshoots and then recovers to track the external value. Although we have deliberately chosen the solution closest to pressure equilibrium, the similarity of the functional forms of the internal and external pressures in the outer region is still significant.
We find that except near the flaring point (Fig. 5). If the pressure is contributed primarily by relativistic particles and magnetic field, as we suppose, then the two must be close to energy equipartition in the outer region. At the flaring point, , so there could be a significant departure from equipartition. This idea could, in principle, be tested by X-ray observations of inverse Compton emission, but the fluxes predicted for equipartition magnetic fields are too low to be detected by Chandra (Hardcastle et al. 2002 conclude that the X-rays observed from the inner and flaring regions are produced by the synchrotron mechanism).


3.1.2 Density
The internal density (Fig. 6) is very low everywhere in the modelled region and the density contrast is in the range – 10-4 (Fig. 7). The density drops rapidly between the flaring point and 2.7 kpc from the nucleus (i.e. in the region of fastest expansion). Thereafter the jet decelerates abruptly and begins to recollimate, causing to rise again until the end of the flaring region. The density remains approximately constant over the outer region despite the continuing expansion. Figure 8 plots the mass per unit length, , for comparison with the “linear density” estimated by Rosen et al. (1999) from numerical simulations of entraining, non-relativistic jets (Section 4.2).
We have also estimated the Faraday rotation expected for a minimum-pressure field. For a fully ordered field, the rotation measures would be 0.03 and 0.04 rad m-2 at the flaring point and at the end of the modelled region, respectively. A disordered, but anisotropic field (as assumed in the models of Laing & Bridle 2002) would give even lower values. Such low rotation measures (or any associated depolarization) would be impossible to measure with the frequency and resolution combinations available to current synthesis arrays, especially in the presence of significant foreground Faraday rotation. In 3C 31, the Faraday rotation observed along the jets appears to be produced by a foreground magnetoionic medium, almost certainly the surrounding hot gas, and shows fluctuations in the range 120 – +20 rad m-2 (Laing et al., in preparation). There is no evidence for any component internal to the jet.


3.1.3 Mach number
The flow is always transonic (Fig. 9), the relativistic Mach number reaching a maximum of 2.0 in the flaring region and falling from 1.5 to 1.1 in the outer region. As pointed out by Bicknell (1994), velocities 0.3 – 0.7 inevitably correspond to transonic flow for light, decelerating relativistic jets, and this is indeed the case for our models.

3.1.4 Mass flux and entrainment rate


The mass flux along the jet is plotted in Fig. 10. Its derivative, the entrainment rate (the full line in Fig. 11) increases rapidly to a maximum of 1.3 1020 kg kpc-1 s-1 at a distance of 3.4 kpc, where the mass flux curve has a point of inflection. This maximum is a feature of all acceptable models and is a direct consequence of the rapid expansion of the jet at roughly constant velocity, followed by abrupt deceleration. Thereafter, the entrainment rate drops abruptly until the end of the flaring region and then increases monotonically through the outer region. The change of slope at 8 kpc is caused by the discontinuity in the assumed form for the external temperature gradient.
We have independently estimated the rate of entrainment into the jet from stellar mass loss, as follows:
-
1.
We started with the R-band CCD photometry of Owen & Laing (1989), which is well fitted by a power-law surface-brightness distribution
with . A galactic extinction of (Schlegel et al., 1998) was removed, a K-correction was applied as in Owen & Laing (1989) and the fit was converted to absolute magnitude (note the change of Hubble Constant to = 70 km s-1 Mpc-1 from that used by Owen & Laing 1989).
- 2.
-
3.
We then took the mass loss rate predicted by Faber & Gallagher (1976) for an elliptical galaxy stellar population as a function of the blue luminosity, , in solar units,
which is consistent with the estimate from infrared observations by Knapp, Gunn & Wynn-Williams (1992), and scaled it to the R band using extinction-corrected colours for NGC 383 (Sandage, 1973; Schlegel et al., 1998) and the Sun (Cox, 2000), getting
(11)
This allowed us to estimate the mass-loss rate per unit volume as a function of radius for 3C 31. The assumptions are identical to those of Komissarov (1994), except for our use of actual galaxy photometry. The uncertainties are large: efficient mixing is assumed, and the mass-loss rate is supposed to be completely unaffected by the presence of a jet. The dashed line in Fig. 11 shows the estimated entrainment rate from stars, for comparison with that required to slow the jet according to our analysis.

The required entrainment rate is very close to that expected from stellar mass loss at the flaring point and remains only a factor of 2 larger until 2 kpc from the nucleus. Both curves have their maxima at roughly the same location (close to the point of inflection of the outer isophote), although that for stellar mass input is much shallower. It is of course inevitable that the latter will have a maximum, since the jet expands and the stellar density decreases with distance from the nucleus. Given the uncertainties, the agreement between the two estimates in the first 2 kpc of the flaring region is surprisingly good. The discrepancy in the outer region is much more significant as the required injection rate continues to increase while that from stars falls off.
3.1.5 Ratio of internal to kinetic energy
3.2 Other pressure-matched solutions
For constant-fraction velocity profiles, there are physically self-consistent, pressure-matched solutions for any velocity fraction in the range . For , pressure equilibrium in the outer region is impossible. This value of is in any case slightly lower than the minimum (edge) velocity, , in our kinematic model (Laing & Bridle, 2002), which we take as a lower limit in what follows. As noted in Section 3.1, the case , in which all of the material travels at the on-axis velocity, is unlikely to be approached in practice, but we retain it as an upper bound on acceptable solutions. Fig. 13 shows the variation of the flow variables with distance along the jet axis for pressure-matched models with (minimum), (the reference model, as before) and (on-axis). The internal pressures are very similar by construction, but the main qualitative features of the reference model also remain for the other flow variables: there is a density minimum in the flaring region, corresponding to a maximum Mach number, and a local peak in the entrainment rate. Faster jets (larger ) have higher energy fluxes and Mach numbers, but lower densities and entrainment rates. We found an accurate empirical linear relation between and from results for 9 values of in the range . The coefficients, determined by a least-squares fit, are given in Table 2. The energy flux is constrained to better than a factor of 2, varying from W for to W for .
As expected, the pressure-matched solutions for the ramped velocity profile are very similar to those for a fixed fractional velocity and (Fig. 13) and are therefore not shown. There is a similar, but flatter, relation between and (Table 2) and the energy flux lies in a very narrow range from W () to W (). Other velocity laws do not require significantly different energy fluxes or flow variables.
Given the uncertainties inherent in the quasi-one-dimensional approximation, Fig. 13 therefore represents our best estimate of the range of allowed solutions subject to the reasonable assumptions that the outer jet is in pressure balance and that .
3.3 Review of the assumptions
3.3.1 Uncertainties in the on-axis velocity model
Uncertainties in fitting the kinematic model to the observed synchrotron emission result in errors in the on-axis velocity. We have investigated the effect of varying the velocity exponent and each of the three fiducial velocities (Fig. 2) independently over the allowed ranges given in table 7 of Laing & Bridle (2002). Fig 14 superposes seven curves to illustrate how the on-axis velocity uncertainties affect the flow parameters inferred for the reference model of Section 3.1 (the pressure-matched solution with constant velocity fraction and ). The energy flux is barely affected (9 1036 W 1.2 1037 W). The most significant changes are in the density and peak entrainment rate, where the maximum spread approaches a factor of 2. The uncertainties are generally smaller than those introduced by varying the velocity fraction, (Fig. 13). One feature of interest is that reducing the velocity exponent (Laing & Bridle, 2002) to its lowest allowed value, thereby smoothing out the abrupt deceleration at the end of the flaring region, also reduces the amplitude of the fluctuations of pressure, density, Mach number and entrainment rate.

3.3.2 External gas density and pressure
In order to quantify the uncertainties introduced by errors in fitting the Chandra data, we have repeated the analysis of Section 3.1 with density and pressure profiles corresponding to combined uncertainties in the conversion between central normalization and density, the model fits and the linear fit to the temperature gradient (as in fig. 9 of Hardcastle et al. 2002). The changes to our solutions are small compared with those due to other uncertainties. The energy flux for a pressure-matched solution changes by 20% and the derived profiles of flow variables are not grossly affected, as illustrated for a constant velocity fraction and in Fig. 15. The pressure, density and entrainment rate are typically ≲25% from the reference model. We conclude that errors in the fitting of the external gas parameters are not serious compared with other uncertainties in the problem.

3.3.3 Solutions which are not pressure-matched in the outer region
The effect of relaxing the assumption of pressure balance in the outer region is illustrated in Fig. 16. This shows the same plots as in Fig. 13 for a constant value of , but a range of energy fluxes corresponding to the overpressure and mass-flux conditions (ii), (iii) and (v) given in Section 2.6. Here, the internal densities are similar, but pressure, Mach number, mass flux and entrainment rate change significantly. In each case, the lower limit to the energy flux is set by the condition that the internal pressure must exceed the synchrotron minimum pressure. The absolute upper limit is determined by the condition that the mass flux must always increase along the jet, although values towards the upper end of the range require very large over-pressures in the flaring region, and we have flagged those solutions which have at any point.

The energy flux ranges of acceptable solutions for the velocity laws assuming constant fractions of the central speed are shown in Fig. 17. At a given value of , the acceptable range is roughly a factor of 2. The energy flux is, of course, an increasing function of the velocity fraction. Again, the relations between and are accurately linear for the limiting cases, and we have plotted the best fits in Fig. 17 and summarized the results in Table 2. Relaxation of the pressure balance condition increases the allowed energy flux range: the minimum value is W (; ); the maximum is either W (overpressure condition; ) or W (mass flux condition; ).
The solutions that are significantly over-pressured in the outer region have relatively low entrainment rates which drop at large distances from the nucleus (Fig. 16e) and which are therefore closer to the estimated mass input from stars. At first sight, these could represent free expansion without external entrainment, but they have low Mach numbers (Fig. 16c), so the observed opening angle is not consistent with this idea.
| Solution description | A | B |
|---|---|---|
| Fixed fractional velocity | ||
| Pressure-matched | 0.777 | 36.38 |
| Lower limit () | 1.080 | 36.01 |
| Upper limit ( in flaring region) | 1.293 | 36.07 |
| Upper limit (monotonically increasing mass flux) | 0.853 | 36.63 |
| Ramped fractional velocity | ||
| Pressure-matched | 0.335 | 36.84 |
| Lower limit () | 0.190 | 36.91 |
| Upper limit (monotonically increasing mass flux) | 1.040 | 36.45 |
3.3.4 Synchrotron minimum pressure
Changes in the assumptions made in deriving the synchrotron minimum pressure affect the range of allowed solutions by influencing the lower energy flux bound (Fig. 17 and Table 2). The only change which can reduce is to curtail the energy range of the relativistic particles. So far, we have assumed a range from to . If we increase to 1000, decreases by a factor of 0.59 (equation 10). This would reduce the minimum allowed energy flux from W to W, but in fact the under-pressure condition in the outer region takes over to set the minimum energy flux at W. The derived profiles are not changed greatly and the pressure-matched solution is unaffected. Even if we take an unrealistically small range of from 103 – 104 (equivalent to a factor of 100 in frequency, which would preclude an extension of the spectrum into the X-ray band), the decrease in is only by a factor of 0.42. There is, of course, no reason to suppose that the energy limits are independent of position.
Other changes (increasing the energy range, decreasing the filling factor, changing the ratio between field and particle energy or adding relativistic protons) act to increase the pressure. This will tend to reduce the range of solutions, eventually causing a conflict with the pressure-matching and then the over-pressure conditions. At present, however, the inferred internal, external and synchrotron minimum pressures are mutually consistent.
3.3.5 Equation of state
The fact that is only a factor of 2 larger than in the outer region is consistent with our initial assumption that relativistic particles and magnetic field dominate the internal energy of the jet, and gives a post hoc justification for the adoption of an ultra-relativistic equation of state. If there are significant departures from equipartition, then will be significantly higher, strengthening our conclusion. Even if we adopt the most conservative limits on the particle energy spectrum (Section 3.3.4), relativistic particles and field must contribute a large fraction of the internal energy of the jet material.
The density of the entrained material remains much lower than that of the external medium ( at the end of the modelled region), justifying the assumption that the entrained internal energy is negligible compared with that of the relativistic particles. The ultra-relativistic equation of state should therefore be an adequate approximation for our purposes, but will not necessarily remain valid far from the nucleus.
A full treatment using the equation of state for mixed relativistic and non-relativistic plasma (Synge, 1957; Komissarov, 1994) is outside the scope of this paper. We have, however, tested the sensitivity of our results to the choice of equation of state by computing the (physically unrealistic) limiting case of a pure non-relativistic plasma. We find that the solutions are similar to those for the ultrarelativistic equation of state. For the reference model, the energy flux ( W) is slightly smaller; the internal pressure is essentially unchanged, and the density, mass flux and entrainment rate in the outer region are lower by at most 25%. The only major differences occur close to the flaring point, where the solutions for a non-relativistic equation of state give densities and entrainment rates lower by factors of 4 and 2, respectively.
3.3.6 Momentum flux
We now explore the effect of relaxing the assumption that . Unless the velocity is very close to on parsec scales, the momentum flux is potentially a free parameter, depending on the initial value of , the ratio of rest mass energy to enthalpy (equation 5). We have searched for acceptable solutions (according to the criteria (i) – (vi) of Section 2.6) over a grid of values of and for models with fixed fractional velocities 0.7, 0.85 and 1.0. As expected, there are no solutions with significantly less than , but there are solutions with high momentum flux. The largest range of solutions is found for fixed fractional velocity and . We show the variation of flow variables with distance for two extreme cases (minimum and maximum and ) in Fig. 18. The high-momentum-flux solutions (e.g. that represented by the dotted curves in Fig. 18) are very different from those with :

-
1.
The densities and values of are high initially and remain so.
-
2.
Consequently, the mass flux and the entrainment rate are greatly increased, and the maximum in the entrainment rate in the flaring region is enhanced.
-
3.
The jets are supersonic in the flaring region, becoming transonic only in the outer region.
The range of solutions is plotted in Fig. 19 for 0.7, 0.85 and 1.0. As expected, the lower bound is just below the line . The upper bound is set by the condition that the outer region is over-pressured by less than a factor of 2. The positions of the solutions closest to pressure balance in the outer region are also indicated. In some cases, these have momentum fluxes significantly in excess of , but in no case is the mean pressure ratio significantly different from that for the equivalent pressure-matched solution with . We have also found solutions for ramped velocity profiles. The allowed ranges of and overlap the comparable areas for constant-fraction velocity laws, but are considerably smaller.
There is therefore a set of allowed solutions where the jets are much heavier than those we have described previously, and so require much more entrainment in order to slow down. They are, however, inconsistent with the deceleration from high Lorentz factors on parsec scales required by Unified Models. In the absence of buoyancy, the ratio of energy and momentum fluxes for a jet in pressure equilibrium () can be written:
| (12) |
where we have combined equations (1), (2) and (5). Alternatively, if the jet is very over-pressured (), we have:
| (13) |
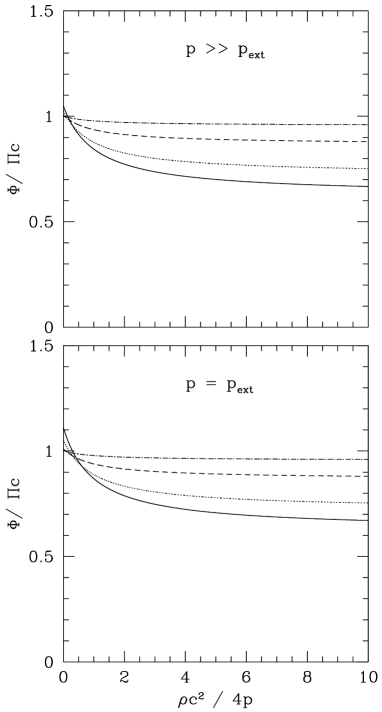
These relations are illustrated in Fig. 20 as plots of against for the cases of pressure equilibrium and extreme overpressure on parsec scales.
For a given speed, and regardless of the pressure condition, must always be larger than the asymptotic value corresponding to :
| (14) |
For example, if and if . For light () and fast () jets, is very close to 1. We indicate the asymptotic ratio for in Fig. 19: it is clear that the majority of high-momentum solutions are excluded if the Lorentz factors on pc scales are as high as those required by Unified Models. We also note that Bicknell & Begelman (1996) argue that ≲2 on kpc scales in the M 87 jet. We have plotted the flow variables for a case with W and in Fig. 18. The jets in this case are only slightly denser than for (compare Fig. 13).


There are other problems with the very dense solutions:
-
1.
They are significantly and persistently over-pressured in the outer region.
- 2.
-
3.
The ratio , instead of increasing monotonically along the jet (as expected), has a maximum in the flaring region.
We conclude that while we cannot rule out the high-momentum solutions from our conservation analysis alone, they would have unphysical properties even on kpc scales and are inconsistent with deceleration from highly relativistic speeds on pc scales.
4 Discussion
4.1 General
Our analysis shows that the hypothesis that the jets decelerate by entrainment and are recollimated by the external pressure gradient is quantitatively consistent with our model velocity field for external gas parameters derived from Chandra measurements. The uniqueness of our solution depends primarily on the assumptions that the jets are in pressure equilibrium with the external medium in the outer region and that the momentum flux . We have argued that both assumptions are likely to be correct, but have also demonstrated the effects of relaxing them. In the remainder of this Section, we assume that they hold precisely.
4.2 Comparison with numerical simulations
Several groups have made numerical hydrodynamic or magnetohydrodynamic simulations of the effects of internal or external entrainment on jets.
-
1.
De Young (1996) modelled the development of turbulent eddies and subsequent entrainment, described as “ingestion” followed by “digestion”;
-
2.
Bowman et al. (1996) studied the effects of mass input from stars (considered as a continuous mass source) on a two-dimensional, relativistic jet;
- 3.
- 4.
Although all of these simulations give important insights into the physics of jet deceleration, none can be compared directly with our results. Except for the calculations of Bowman et al. (1996), which deal specifically with mass input from stars and exclude external entrainment, all are non-relativistic. Without exception, they assume that the jets are initially in pressure equilibrium with the external medium. This is inconsistent with our inference of a significant over-pressure in the flaring region. Only Bowman et al. (1996) include a realistic galactic atmosphere. Finally, the jets in the highest-resolution three-dimensional simulations (Rosen & Hardee, 2000) are much denser than we infer (, compared with 10-5).
Nevertheless, comparison of Fig. 8 with fig. 2 of Rosen et al. (1999) shows some similarities: the linear density initially grows slowly, then increases rapidly through the flaring region and levels off at the beginning of the outer region. The three phases are interpreted as the linear, non-linear and saturated stages of the Kelvin-Helmholtz instabilities. There are obvious differences, however: the simulations do not show an abrupt increase in emissivity at the flaring point, nor do they predict the further rapid increase in entrainment rate in the outer region.
4.3 The onset of deceleration
A common feature of all our acceptable solutions is that the jet becomes significantly over-pressured at the start of the flaring region. Such a localised region can persist in a steady-state jet (Leahy, 1991): it is apparently “unconfined”, but the fluid passing through it is expanding, and by the time it has expanded, it is further down the jet, and close to pressure equilibrium with the surroundings. In fact, the rapid expansion in this region causes the pressure to drop abruptly and the jet becomes over-expanded, starts to recollimate and attains pressure equilibrium over roughly a sound crossing distance.
We have also established that the flaring point in 3C 31 is a discontinuity at which the jet collimation, emissivity (and perhaps the velocity) change abruptly and we have argued elsewhere that this is a general property of FR I jets (Laing et al., 1999). What causes this sudden transition? It has frequently been suggested that it represents the onset of turbulence (Bicknell, 1984) or (almost equivalently) the point at which Kelvin-Helmholtz instabilities start to grow non-linearly (Rosen et al., 1999; Rosen & Hardee, 2000). Our requirement for a significant over-pressure at the flaring point leads us instead to consider the possibility that the flaring point is associated with a stationary shock system. The boundary position is roughly consistent with the expected location of the reconfinement shock formed when the internal pressure of a freely-expanding supersonic jet falls below that of the external medium (Sanders, 1983). Our estimates of for the inner jet (Fig. 3) are indeed consistent with an over-pressure for the first 0.5 kpc (but note that the external pressure might be underestimated; Hardcastle et al. 2002). The shock is expected to occur at a distance
from the nucleus for a relativistic jet (Komissarov, 1994), in fortuitously good agreement with our results. The flaring point cannot be the initial reconfinement shock (by definition, the jet recollimates at that point), but the actual shock structure is likely to be more complicated. In the calculations of Sanders (1983), a conical incident shock forms where the jet has become significantly under-pressured. After this shock, the internal pressure is still slightly below the ambient value. The incident shock is reflected off the jet axis to form a second conical shock, after which the flow is over-pressured and expanding (Fig. 21). It is possible that the reflected shock may represent the visible start of the flaring region. More detailed simulations will be required to ascertain whether the over-pressure is consistent with the values inferred earlier (), although Falle (1987) suggests that values of as high as 12.5 are possible in a non-relativistic jet if the oblique shocks are strong.

4.4 Internal versus external entrainment
Whilst the occurrence of a reconfinement shock provides a plausible explanation for the over-pressure, it does not by itself explain the rapid increase in mass input. However:
-
1.
the increase in expansion rate will naturally lead to a larger mass injection from stars, which will in turn expand the jet still further in a runaway process and
-
2.
the jet is expected to entrain the external medium more efficiently when it becomes transonic.
We estimate that internal entrainment from stars is within a factor of two of that required to slow the jet over the first kiloparsec of the flaring region (but note that the assumptions used to estimate the stellar mass input are extremely crude, since they assume that the loss rates inside and outside a jet are identical and the extent to which mass lost from stars mixes with the jet is also poorly known).
A number of lines of evidence suggest, however, that external entrainment becomes dominant further out. Firstly, our observations and kinematic model (Laing & Bridle, 2002) show directly that there is an appreciable reduction in velocity at the edges of the jet, as expected in external entrainment models. The shape of the transverse velocity profile in our best fit model changes relatively little down the jet as it decelerates, so the profile could just be set close to the nucleus. An error analysis shows, however, that an evolution from a top-hat velocity profile at the flaring point to a centrally-peaked profile at larger distances would also be consistent with the data. Secondly, the very sharp peak in the entrainment rate at a distance of 3.5 kpc from the nucleus is difficult to reproduce with stellar mass input alone: a maximum is indeed expected, but it should be much broader (e.g. Fig 11). Thirdly, the appearance of locally low polarization at the edges of the jets in the flaring region (Laing & Bridle, 2002) requires the addition of radial magnetic field components at the edges of this region, so that the field becomes almost isotropic there. The appearance of such a field component suggests the onset of local radial motions in this region, consistent with the inflow of ambient material into the jet. This effect occurs at exactly the position of the local maximum of the entrainment rate (e.g. Fig. 11). Finally, the monotonic increase of entrainment rate at large distances is clearly inconsistent with the fall-off in stellar density. A general feature of the models of Komissarov (1994) and Bowman et al. (1996), where only mass-loading from stars is considered, is that the jets are re-accelerated at distances 1 kpc, becoming significantly supersonic. The reason is that the entrainment rate, which is proportional to the stellar density, decreases rapidly. Our results, which indicate a continuous deceleration, therefore require additional entrainment, almost independent of the details of the conservation-law analysis.
We conclude that external entrainment across the jet boundary from the galactic atmosphere must be important in decelerating the jets, but that internal entrainment from stars within the jet may play a significant role in the initial phases. Indeed, once the area of the jet starts to increase, the mass input from stars may slow the flow to the point where entrainment of external material becomes efficient (Bicknell, 1994).
4.5 External pressure and density
The presence of a component of hot gas with a small core radius is essential for the jets to decelerate without disruption. We have confirmed, for example, that no solutions are possible with the large-scale component associated with the NGC 383 group alone. The core radius ( 1.2 kpc) and the distance of the flaring point from the nucleus (1.1 kpc) are almost exactly equal, so that the external pressure gradient is steepest in the flaring region (Fig. 3). We would expect a significant external pressure gradient to drive the recollimation of any flaring jet. In one- or two-component beta-models of the type that we have fit, this inevitably requires that the core radius (or one of the core radii) be close to the flaring distance.
4.6 Jet composition
4.6.1 Composition at the flaring point
By comparing our estimate of jet density with the number of radiating particles required to generate the observed synchrotron emissivity, we can constrain the composition of the jet. With the assumptions used earlier to calculate the synchrotron minimum pressure, the number density of radiating particles is:
| (15) |
with if the power-law spectrum inferred from synchrotron emission observed between 1.4 and 8.4 GHz continues to lower energy. This estimate uses the on-axis emissivity inferred for our best-fitting kinematic model, which is close to the mean of the transverse profile.
The range of densities at the flaring point for pressure-matched models is 1.5 – 3.5 kg m-3. This corresponds to 50 – 20 if every radiating electron is associated with a proton. This is a rough estimate whose uncertainties include:
-
1.
the derivation of from the emissivity, which assumes a minimum-pressure condition;
-
2.
the form of the spectrum at low energies, where we cannot observe synchrotron radiation directly;
-
3.
the range of densities derived from different models.
If we drop the assumption of pressure balance in the outer region, the constraints on are relaxed, but the only circumstance in which we can avoid a low-energy cut-off entirely is if the high-momentum-flux solutions are valid.
If, in contrast, the jet consists only of electrons and positrons at the flaring point, then there would have to be a significant excess of low-energy particles above the power-law extrapolation.
We conclude that, although the pressure-matched jets are very light, we cannot exclude any of the following possibilities for their composition at the flaring point:
-
1.
relativistic electrons with a power-law spectrum with energy index and minimum Lorentz factor 20 – 50, each accompanied by a proton;
-
2.
an electron-positron plasma with some admixture of thermal matter, the latter dominating the density;
-
3.
a pure electron-positron plasma with an excess of particles over the power-law prediction at low energies.
Other intermediate compositions are possible.
4.6.2 Entrainment in the inner jet
Given that stellar mass input must occur in the inner jet, it is of interest to estimate the mass flux at the flaring point due to this effect alone. This depends on knowledge of the luminosity density of the galaxy at small radii, which is not available directly for NGC 383 (HST optical images show heavy dust obscuration, and infrared observations at sufficiently high resolution are not yet available; Verdoes Kleijn et al. 1999). Given the stellar luminosity of the galaxy, it is likely that the light profile is of the “core” type, in which the surface-brightness profile shows a break from a steep power-law at large radii ( for NGC 383; Owen & Laing 1989) to a shallow one (, with 0 ≲ ≲0.3) at small radii (Lauer et al., 1995). This transition occurs around a break radius which is correlated with absolute magnitude and is likely to be 100 pc ≲ ≲1 kpc for NGC 383 (Faber et al., 1997).
Given the uncertainties, we have chosen to estimate two extreme limiting cases for the mass input into the inner jet. In the first, we extrapolate the surface brightness profile seen at large radii inwards from the flaring point. In the second, we assume a flat profile over the whole of the inner jet, normalized at the flaring point (i.e. 1 kpc and ). The number of particles injected per unit volume per unit time is a Lorentz invariant, so we can derive the mass flux at the flaring point by integrating the mass input rate (equation 11) over the volume of the inner jet. The results are: kg s-1 for and kg s-1 for a constant surface brightness.
The predicted mass flux is at least commensurate with that estimated at the flaring point (2.8 – 3.4 1019 kg s-1 for the pressure-matched models). It is therefore possible that essentially all of the mass of the jet comes from stars within 1 kpc of the nucleus. If the jet consists almost entirely of electron-positron plasma on pc scales, it could still pick up enough mass to be consistent with our estimates on kpc scales. This argument is not yet conclusive, because of the many uncertainties in estimating the stellar mass input rate, but a jet consisting initially of pair plasma would be entirely compatible with our results.
4.6.3 Jet composition on parsec scales
We expect the amount of thermal material to increase from parsec scales to the flaring point. We therefore compare our results with those derived for pc scales using the methods of Reynolds et al. (1996). These authors used VLBI and X-ray observations of M 87 to argue that its parsec-scale jet is composed primarily of electron-positron plasma, although they could not exclude an electron-proton jet with a low-energy cut-off. We have repeated their analysis for 3C 31. An upper limit to the magnetic field strength is derived from the surface-brightness of the self-absorbed core. For an observing frequency of 4.973 GHz, an angular diameter of 0.56 milliarcsec and a flux density of 0.071 Jy for the core (Lara et al., 1997), we deduce 2.4 T for 3C 31 if 52.4∘. Consideration of the absorption coefficient at the point where the jet becomes optically thick gives where (in m-3) is the number density of radiating particles, is the maximum Doppler factor and is in T. Consequently, for . We use the value of the kinetic luminosity estimated earlier for the reference model ( W) to solve for the particle number density assuming e-e+ or e-p+ jets. For a bulk Lorentz factor of 3, as assumed by Reynolds et al. (1996), we derive m-3 for a pure e-e+ jet and m-3 for an e-p+ jet (note that consistently includes all radiating species).111In Reynolds et al. (1996)’s discussion of e-p+ jets, the quantity is used in different places for the number densities of all radiating particles, and for electrons alone. Finally, we deduce a lower limit to the magnetic field, T using the X-ray core flux density at 1 keV from Hardcastle et al. (2002) as an upper limit to the synchrotron self-Compton emission. The constraints are plotted in Fig. 22.

The conclusions from this analysis are slightly weaker than those of Reynolds et al. (1996) for M 87. For 3C 31, an e-p+ jet with just satisfies the constraints for a bulk Lorentz factor , whereas it was formally ruled out for M 87. Our values for the jet composition and at the flaring point would be consistent with the constraints shown in Fig 22 even in the absence of any changes along the jet.
5 Summary and further work
5.1 Conclusions
5.1.1 Conservation-law solutions
We have, for the first time, estimated the variations of pressure, density, Mach number and entrainment rate along an extragalactic jet, using a quasi-one-dimensional conservation-law approach combined with our kinematic model and with measurements of the external gas properties from Chandra. Our solutions are physically self-consistent and satisfy constraints set by the external and synchrotron minimum pressures. We conclude that the deceleration law derived in Laing & Bridle (2002) is fully consistent with the observed external density and pressure and the conservation of energy, momentum and particles. The presence of a hot-gas component with a small core radius, associated with the parent galaxy nucleus rather than with the surrounding group, is required for the jet to decelerate without disruption.
All acceptable solutions have a number of common features:
-
1.
The jets are overpressured by a factor of at least 4 the beginning of the flaring region. Thereafter, the pressure drops rapidly, approaching and often falling below the external pressure.
-
2.
At 3 – 3.5 kpc from the nucleus in the flaring region, where the expansion rate is largest, there are local minima in the pressure and density and maxima in the Mach number and entrainment rate.
-
3.
Variations in the outer region are quite smooth: the density stays roughly constant and the entrainment rate usually increases monotonically.
-
4.
The Mach numbers are always 1 – 2 in the outer region (and usually also in the flaring region).
5.1.2 Outer region in pressure equilibrium;
It is very likely that the jets are close to pressure equilibrium in the outer region and that the momentum flux . The principal uncertainty in our analysis is then the assumed velocity law, which effectively integrates over the transverse distributions of velocity for the relativistic and thermal plasma as functions of distance from the nucleus. We have explored a range of possible velocity laws, and conclude that the energy flux must be in the range W ≲ ≲ W. At the flaring point, the key variables are:
- density
-
1.5 – 3.5 kg m-3;
- pressure
-
1.1 – 1.8 Pa;
- pressure ratio
-
6 – 9;
- Mach number
-
1 – 2;
- mass flux
-
2.8 – 3.4 kg s-1;
- entrainment rate
-
1.0 – 1.3 kg kpc-1 s-1;
- kinetic/internal energy ratio
-
0.30 – 0.44.
The variations of these quantities along the jets are illustrated in Fig. 13. Uncertainties in the kinematic model (Section 3.3.1) and the external pressure and density (Section 3.3.2) lead to similar, but smaller, variations in the derived flow variables.
5.1.3 Outer region not in pressure equilibrium;
If the jets are not in pressure equilibrium in the outer region, then a wider range of energy fluxes is allowed. The lower limit ( W) is set by the condition that the internal pressure exceeds the synchrotron minimum; the upper limit either by the requirement that the mass flux always increases away from the nucleus or by an over-pressure constraint ( W or W, respectively). There is a wider range of solutions (Fig. 16), but they are qualitatively similar to those for the pressure-matched case.
5.1.4 Synchrotron minimum pressure and the equation of state
Our conclusions are not seriously affected by changes in the assumptions used to derive the minimum pressure from the synchrotron emissivity (Section 3.3.4). Our assumption that the internal energy of the jets is dominated by relativistic particles and magnetic field is self-consistent, but we have also shown that our results are insensitive to changes in the equation of state (Section 3.3.5).
5.1.5
If the momentum flux is allowed to exceed by a large factor, the solutions are much less well constrained (Section 3.3.6). The jets can be much denser, and entrain more rapidly than those having (Fig. 18). Although we cannot rule out these solutions from our data alone, they are incompatible with the need to decelerate from high Lorentz factors on parsec scales and require extremely high entrainment rates even where the jet Mach number . We suggest that these solutions are highly unlikely.
5.1.6 The deceleration mechanism
The large over-pressure at the beginning of the flaring region suggests the presence of a stationary shock, perhaps associated with reconfinement of the jet. The amount of mass lost by stars inside the jets and the degree of mixing of the ejecta are both very uncertain, but our best estimate is that stellar mass input is within a factor of two of the rate needed to slow the jet at the beginning of the flaring region. At larger distances, the required entrainment rate is much higher than could be supplied by stars and also increases with distance from the nucleus in a region where the stellar density falls rapidly. We conclude that another mass source (presumably entrainment from the large-scale galactic atmosphere across the boundary layer of the jet) must dominate at large distances; perhaps everywhere, but that stellar mass input could still significantly affect the initial deceleration. A second piece of evidence in favour of entrainment of external gas across the jet boundary is the (approximate) isotropy of the magnetic field at the edge of the flaring region (Laing & Bridle, 2002), which is most easily interpreted as the effect of disordered motions in a turbulent entraining flow.
5.1.7 Jet composition
Our estimate of stellar mass injection within 1 kpc of the nucleus is most consistent with the hypothesis that the jets consist primarily of pair plasma on parsec scales and that most of their mass at the flaring point is in the form of entrained thermal plasma. A jet consisting entirely of electron-positron plasma at the flaring point would require a very large low-energy excess over a power-law energy spectrum. Given the uncertainties in our estimates, we cannot rule out an electron-proton composition; this would require a minimum Lorentz factor of 20 – 50 for the radiating electrons.
5.2 Further work
5.2.1 Observations
The next step in this work is to carry out kinematic modelling and X-ray observations of other sources and to investigate how the jet behaviour depends on galaxy properties and luminosity. Particularly important questions include:
-
1.
Is flaring and recollimation always associated with a steep external pressure gradient?
-
2.
Is there a difference in the entrainment rate for sources whose jets propagate entirely within their radio lobes (presumably much less dense than the external medium) compared with those, like 3C 31, where the jets appear to be in direct contact with the hot gas?
-
3.
How does the deceleration process depend on jet power?
-
4.
What is the stellar density close to the nucleus? (This will require infra-red imaging at high spatial resolution).
-
5.
Is there morphological evidence for the reconfinement shock structure we have suggested?
-
6.
What limits can we set on the energy spectrum of the relativistic electrons from low-frequency radio and high-frequency (optical – X-ray) observations?
-
7.
Can we refine the constraints on pc-scale jet composition by higher-resolution VLBI imaging or measurements of circular polarization (Wardle et al., 1998)?
5.2.2 Theory
Our analysis also poses a number of challenging theoretical problems:
-
1.
Is it possible to simulate entrainment into a decelerating, relativistic, magnetized jet with the very low density contrast we infer and in a realistic galactic atmosphere?
-
2.
Is the required over-pressure at the flaring point consistent with the shock structure in a reconfining jet?
-
3.
What is the viscosity mechanism? How is momentum transported across the jet? How can we constrain this using estimates of the velocity profile?
-
4.
Are turbulent velocities significant? What are their effects on energy and momentum transport and magnetic fields?
-
5.
Is an ultra-relativistic equation of state an adequate approximation everywhere?
-
6.
How is the entrained material mixed and heated?
-
7.
Can better estimates be made of the mass input rate from stars inside a jet?
Acknowledgments
RAL would like to thank the National Radio Astronomy Observatory, the Istituto di Radioastronomia, Bologna and Alan and Mary Bridle for hospitality during this project. We acknowledge travel support from NATO Grant CRG931498. The National Radio Astronomy Observatory is a facility of the National Science Foundation operated under cooperative agreement by Associated Universities, Inc.
References
- (1)
- Baan (1980) Baan, W. A., 1980, ApJ, 239, 433
- Begelman (1982) Begelman, M.C., 1982, in Heeschen, D.S., Wade, C.M., eds, IAU Symp. 97, Extragalactic Radio Sources, D. Reidel, Dordrecht, p. 223
- Bicknell (1984) Bicknell, G. V., 1984, ApJ, 286, 68
- Bicknell (1986) Bicknell, G. V., 1986, ApJ, 300, 591
- Bicknell (1994) Bicknell, G.V., 1994, ApJ, 422, 542
- Bicknell & Begelman (1996) Bicknell, G.V., Begelman, M.C., 1996, ApJ, 467, 597
- Birkinshaw & Worrall (1993) Birkinshaw, M., Worrall, D.M., 1993, ApJ, 412, 568
- Bowman et al. (1996) Bowman, M., Leahy, J. P., Komissarov, S. S., 1996, MNRAS, 279, 899
- Cox (2000) Cox A.N., ed., 2000, Allen’s Astrophysical Quantities, 4th edn. AIP Press, Springer, New York
- De Vaucouleurs et al. (1991) De Vaucouleurs, G., De Vaucouleurs, A., Corwin, H.G. Jr., Buta, R., Paturel, G., Fouque, P., Third Reference Catalogue of Bright Galaxies, Springer-Verlag, New York
- De Young (1996) De Young, D. S., 1996, in Hardee, P.E., Bridle, A.H., Zensus, J.A., eds, ASP Conf. Series 100, Energy Transport in Radio Galaxies and Quasars, ASP, San Francisco, p. 261
- Falle (1987) Falle, S.A.E.G., 1987, in Kundt, W., ed., Astrophysical Jets and their Engines, Reidel, Dordrecht, p. 163
- Faber & Gallagher (1976) Faber, S. M., Gallagher, J. S., 1976, ApJ, 204, 365
- Faber et al. (1997) Faber, S.M., Tremaine, S., Ajhar, E.A., Byun, Y.-I., Dressler, A., Gebhardt, K., Grillmair, C., Kormendy, J., Lauer, T.R., Richstone, D., 1997, AJ, 114, 1771
- Fernie (1983) Fernie, J.D., 1983, PASP, 95, 782
- Giovannini et al. (2001) Giovannini, G., Cotton, W.D., Feretti, L., Venturi, T., 2001, ApJ, 552, 508
- Hardcastle et al. (2002) Hardcastle, M.J., Worrall, D.M., Birkinshaw, M., Laing, R.A., Bridle, A.H., 2002, MNRAS, 334, 182
- Huchra, Vogeley & Geller (1999) Huchra, J.P., Vogeley, M.S., Geller, M.J., 1999, ApJS, 121, 287
- Knapp, Gunn & Wynn-Williams (1992) Knapp, G. R., Gunn, J. E., Wynn-Williams, C. G., ApJ, 399, 76
- Komissarov (1994) Komissarov, S. S., 1994, MNRAS, 269, 394
- Königl (1980) Königl, A., 1980, Phys. Fluids, 23, 1083
- Laing & Bridle (2002) Laing, R.A., Bridle, A.H., 2002, MNRAS, in press
- Laing et al. (1999) Laing, R.A., Parma, P., de Ruiter, H.R., Fanti, R., 1999, MNRAS, 306, 513
- Lara et al. (1997) Lara, L., Cotton, W.D., Feretti, L., Giovannini, G., Venturi, T., Marcaide, J.M., 1997, ApJ, 474, 179
- Lauer et al. (1995) Lauer, T.R., Ajhar, E.A., Byun, Y.-I., Dressler, A., Faber, S.M., Grillmair, C., Kormendy, J., Richstone, D., Tremaine, S., 1995, AJ, 110, 2622
- Leahy (1991) Leahy, J.P., 1991, in Hughes, P.A., ed., Beams and Jets in Astrophysics, Cambridge University Press, Cambridge, p. 100
- Loken (1997) Loken, C., 1997, in Clarke, D.A., West, M.J., eds, ASP Conf. Series 123, The 12th Kingston Meeting: Computational Astrophysics, ASP, San Francisco, p. 268
- Loken et al. (1996) Loken, C., Burns, J.O., Bryan, G., Norman, M., 1996, ASP Conf. Series 100, Energy Transport in Radio Galaxies and Quasars, eds Hardee, P.E., Bridle, A.H., Zensus, J.A., ASP, San Francisco, p. 267
- Owen & Laing (1989) Owen, F. N., Laing, R. A.. MNRAS, 238, 357
- Parma et al. (1987) Parma, P., de Ruiter, H.R., Fanti, C., Fanti, R., Morganti, R., 1987, A&A, 181, 244
- Phinney (1983) Phinney, E. S., 1983, Ph.D. Thesis, University of Cambridge
- Reynolds et al. (1996) Reynolds, C.S., Fabian, A.C., Celotti, A., Rees, M.J., 1996, MNRAS, 283, 873
- Rosen & Hardee (2000) Rosen, A., Hardee, P.E., 2000, ApJ, 542, 750
- Rosen et al. (1999) Rosen, A., Hardee, P.E., Clarke, D.A., Johnson, A., 1999, ApJ, 510, 136
- Sandage (1973) Sandage, A., 1973, ApJ, 183, 711
- Sanders (1983) Sanders, R.H., 1983, ApJ, 266, 73
- Schlegel et al. (1998) Schlegel, D.J., Finkbeiner, D.P., Douglas, P., Davis, M., 1998, ApJ, 500, 525
- Smith et al. (2000) Smith, R.J., Lucey, J.R., Hudson, M.J., Schlegel, D.J., Davies, R.L., 2000, MNRAS, 313, 469
- Synge (1957) Synge, J., 1957, The relativistic gas, North-Holland Publ. Co., Amsterdam
- Urry & Padovani (1995) Urry, C. M., Padovani, P., 1995, PASP, 107, 803
- Verdoes Kleijn et al. (1999) Verdoes Kleijn, G.A., Baum, S.A., de Zeeuw, P.T., O’Dea, C.P., 1999, AJ, 118, 2592
- Wardle et al. (1998) Wardle, J.F.C., Homan, D.C., Ojha, R., Roberts, D.H., 1998, Nature, 395, 457