N. Kikuchi, T. Nakamoto, and K. Ogochi Disk–Halo Model for Flat-Spectrum T Tauri Stars \Received1999 April 23\Accepted2002 June 16
and
planetary systems: protoplanetary disk — radiative transfer — stars: formation
Disk–Halo Model for Flat-Spectrum T Tauri Stars
Abstract
We explore the origin of the flat spectrum seen in some T Tauri stars by considering a three-component structure: a central star, a circumstellar disk, and a dusty halo. The radiative energy transport is faithfully treated by solving the angle- and frequency-dependent radiative transfer equation in two space dimensions assuming axisymmetry, and hence the radiative equilibrium temperature in the disk and halo is determined simultaneously. The disk is effectively heated by the scattering and reprocessing of stellar radiation through the halo. The large mid- to far-infrared excess originates from the photosphere of the warmed disk, resulting in a flat spectrum, as observed. The halo which we consider is observed as a compact reflection nebula, and is discriminated from extended, disk-like envelopes around flat-spectrum T Tauri stars. We show that the overall spectral shape of flat-spectrum T Tauri stars can be reproduced by the present disk–halo model.
1 Introduction
It seems reasonable to suppose that the infrared excesses of T Tauri stars can be attributed to thermal dust emission from circumstellar disks. By modeling the observed spectral energy distributions (SEDs), one can derive the disk properties, such as masses, radii, and temperature distributions (Adams et al. 1988; Strom et al. 1989; Beckwith et al. 1990). Such spectral modeling, however, has revealed an extreme class of T Tauri stars, namely flat-spectrum T Tauri stars. The large mid- to far-infrared excesses of flat-spectrum T Tauri stars require their disks to have a temperature distribution of the form (Adams et al. 1988), where is the distance from the rotation axis, whereas a dependence is predicted by both a standard accretion disk (Lynden-Bell, Pringle 1974) and a spatially flat reprocessing disk (Adams, Shu 1986). This implies that the disks of flat-spectrum T Tauri stars are warmer in the outer regions than predicted by the simple disk models; we must therefore consider the mechanisms which heat the outer region of the disk. Disk flaring allows a disk to receive more emission from the central star, and to produce temperature distributions shallower than (Kusaka et al. 1970; Kenyon, Hartmann 1987), but does not suffice to reproduce the observed flux.
The infrared excesses may originate from another circumstellar dust component. Calvet et al. (1994) invoked infalling envelopes, which were originally applied to the spectral modeling of protostars (Adams, Shu 1986; Kenyon et al. 1993), and showed that the infalling envelopes can produce the mid- to far-infrared excesses of flat-spectrum T Tauri stars. In fact, observations have shown that there exists an extended, disk-like structure of radius around a typical flat-spectrum T Tauri star, HL Tau (Sargent, Beckwith 1991). Furthermore, Hayashi, Ohashi, and Miyama (1993) have revealed an infalling motion in the disk-like structure of HL Tau, suggesting that it is a remnant of an infalling envelope.
Although the infalling envelope model of Calvet et al. (1994) is successful in reproducing the flat spectrum, it does not take into account the following two important effects. First, as pointed out by Natta (1993), envelopes scatter and reprocess the stellar radiation toward the disk, and thereby alter the temperature distribution in the disk (see also Butner et al. 1994; D’Alessio et al. 1997). Second, the disk, itself, significantly influences the temperature distribution in the envelope. Since these two effects are coupled with each other, they cannot be treated separately. Hence, to elucidate the substantial mechanism for the flat spectrum, the temperature structure of the disk and envelope should be solved simultaneously. In the present analysis, we consistently handle the radiative energy transport in the disk and envelope by solving the angle- and frequency-dependent radiative transfer equation in two space dimensions by assuming axisymmetry.
In this paper, we demonstrate that the mid- to far-infrared excesses of flat-spectrum T Tauri stars can originate from the disk. Since the envelope which heats the disk can be as compact as the disk itself, we henceforth call it a halo to distinguish it from an extended infalling envelope. The reflection nebula of HL Tau revealed by the Hubble Space Telescope (Stapelfeldt et al. 1995) may be regarded as an observational counterpart of the halo.
2 Model
The disk–halo model consists of a central star, a circumstellar disk, and a halo surrounding both of them. We first assume the axial and equatorial symmetry. The central star has luminosity and mass , and radiates as a blackbody with effective temperature . We consider models with and , which are typical values for pre-main-sequence stars in the Taurus–Auriga molecular cloud. We adopt for models without disk accretion, in which all the energy is radiated by the central star. Models with disk accretion are also examined, for which stellar luminosity is taken to be and the disk, itself, has some intrinsic luminosity.
The surface density distribution of the disk is assumed to be a power law,
| (1) |
in the range . Outside this range, we make the surface density go to zero smoothly inward down to and outward up to . The value of specifies the disk mass. We consider models with , which gives for the disk mass, and is consistent with the minimum mass solar nebula (Hayashi et al. 1985). For the given surface density distribution, the two-dimensional density distribution in the disk is determined by the hydrostatic equilibrium in the vertical direction under the gravity of the central star.
In addition to the radiation from the central star, viscous dissipation also heats the disk if it is undergoing accretion, as observations of classical T Tauri stars suggest (e.g., Bertout et al. 1988). We take into account the effects of disk accretion in a simple way as follows. Assuming that the mass accretion rate in the disk, , is constant with radius, we express the energy generation rate per unit area as (Lynden-Bell, Pringle 1974)
| (2) |
in the range . We further assume that the energy generation rate per unit mass does not depend on the vertical height, which can be written as
| (3) |
The intrinsic disk luminosity is then given by integrating equation (2) over the disk area as
| (4) | |||||
In a classical picture of accretion disks, the disk extends down to the stellar radius to form a boundary layer, where disk material slows down from Keplerian to stellar rotation velocity. Radiation from a boundary layer accounts for the ultraviolet and optical excesses of T Tauri stars (Lynden-Bell, Pringle 1974). On the other hand, our disk model has an inner radius of , which is well above the stellar surface. The underlying assumption for this is that the stellar magnetic field truncates the disk at several stellar radii, and accretion from the disk onto the central star takes place along the magnetic field lines (Bertout et al. 1988). A “bright spot” is then formed where the accreting material impacts the stellar surface. The luminosity of the radiation from this bright spot can be as large as the stellar luminosity, and therefore it will also be important as an additional energy source for disk heating. In our model, disk material flows at the rate from the disk inner radius onto the stellar surface, and the amount of radiation energy emitted by the bright spot is given by
| (5) |
which derives from the assumption that the energy difference of accreting material between the total kinetic + gravitational energy at and the gravitational energy at is released by radiation from the bright spot. The stellar radius, , is defined by . We do not assume that is equal to , i.e., we consider models with unsteady disk accretion. For simplicity, the bright spot is assumed to radiate isotropically as a blackbody with an effective temperature of 8000 K.
The density distribution in the halo is supposed to be a power law,
| (6) |
for , where is the distance from the central star and is a reference density. To avoid a singularity at , we take for . A different assumption for cutting off the power-law behavior, for instance, keeping the power law down to 0.1 AU, did not change the results significantly. Since bipolar outflows may evacuate material along the rotation axis, we introduce bipolar holes with an opening half-angle of . The halo density is reduced slowly and smoothly inside the bipolar holes by multiplying a factor to the original halo density for , where is the polar angle.
The frequency-dependent absorption and scattering coefficients of dust particles are taken from Miyake and Nakagawa (1993), assuming that the size distribution of dust particles, , with respect to the radius, , is expressed by for and for . Miyake and Nakagawa (1993) assumed that dust particles are composed of silicate and water ice. We further assume that the dust vaporization temperatures are 1000 K and 100 K for silicate and water ice, respectively. For simplicity, we adopt the approximation of isotropic scattering.
Given the density distributions and the radiative and viscous heating sources, we calculate radiative equilibrium temperature in the disk and halo which satisfies the condition of radiative equilibrium,
| (7) |
where is the frequency, is the mass absorption coefficient, is the Planck function, is the temperature, and is the monochromatic radiation energy density. To solve equation (7), we adopt the variable Eddington factor method in a cylindrical coordinate system (Stone et al. 1992), in which we integrate the time-dependent radiation moment equations forward in time until a stationary state is achieved. The radiation moment equations are closed by introducing variable Eddington factors, which are in turn calculated from the solution of the angle- and frequency-dependent radiative transfer equation. For every timestep, the disk is assumed to be in hydrostatic equilibrium determined by the temperature distribution at the previous timestep. Stationary state solutions obtained in this way then satisfy the conditions of radiative and hydrostatic equilibria simultaneously. We take the size of the computational box to be using a non-uniform spatial grid, and employ angle rays and 101 frequency meshes. The accuracy of our radiative transfer method has been confirmed by test calculations described in Stone et al. (1992) and in Masunaga, Miyama, and Inutsuka (1998).
3 Results
3.1 Standard Case
The halo density distribution, , is a natural consequence of infalling material with a constant mass infall rate, , if is given by . From the spectral modeling of protostars in the Taurus–Auriga molecular cloud, Kenyon et al. (1993) derived a typical mass infall rate of , which gives for . Noting this value of , we first present results for a halo model with , and . In a standard case detailed in this subsection, disk accretion is not included, and all of the energy arises from the central star with luminosity .
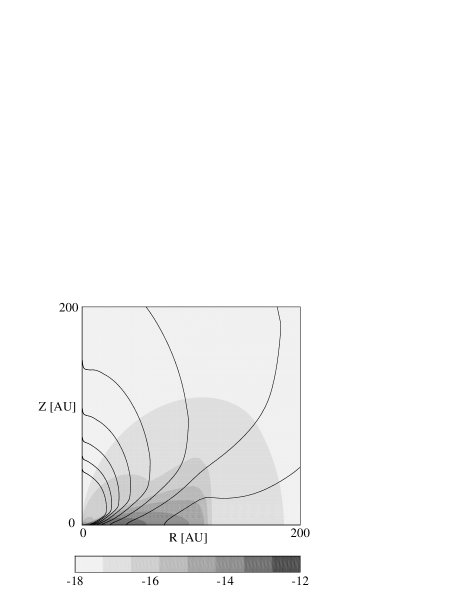
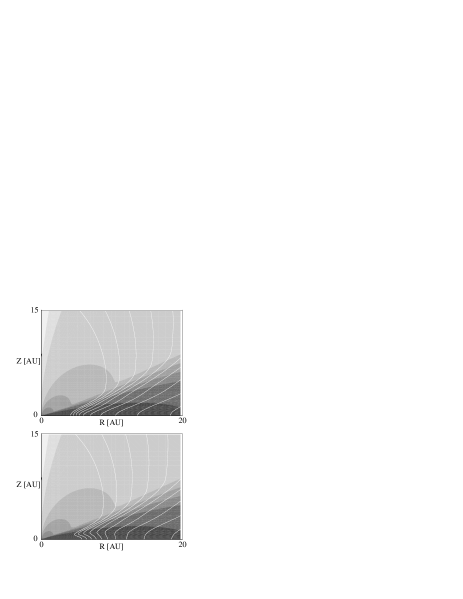
Figure 1 shows the density and temperature distributions in the disk and halo. The temperature gradient is shallow along the axis of symmetry where the density is very low, while it is steep along the midplane where the disk is situated. The resulting temperature distribution is far from spherically symmetric, as illustrated by the contours in the teardrop shape. It can also be seen from figure 1 that the disk is not isothermal in the vertical direction, with a surface temperature higher than the midplane temperature. The vertical structure at is shown in figure 2a. The disk surface lies at , which is defined as the position above which the density of the disk decreases below that of the halo. As illustrated by the solid line in figure 2a, the temperature begins to rise at , reaches its maximal value at the disk surface and then decreases. This pronounced temperature rise at a disk surface can be explained by the frequency-dependence of dust-absorption coefficient. Absorption efficiency of dust particles is higher for short-wavelength radiation than for long-wavelength radiation. The disk surface, which is exposed directly to a high-temperature radiation field in the halo, is therefore warmer than the disk interior (Chiang, Goldreich 1997).
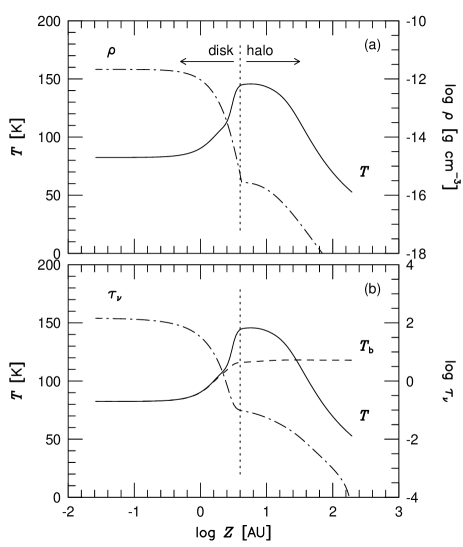
In figure 2b the brightness temperature, , at frequency is shown as a function of . We define according to , where is the specific intensity, and is calculated assuming that the system is viewed pole-on. Also plotted in figure 2b is the optical depth, , at , which is measured from toward the midplane. As illustrated by the dashed line in figure 2b, is equal to near the midplane where ; as increases, also increases along with as long as . When becomes less than unity, begins to depart from , and keeps an almost constant value in the halo. Thus, as expected, we find that the observed value of is determined by the value of at . Since the halo does not have larger than unity, we can define the “photosphere” of the disk as the position of at mid- to far-infrared wavelengths. Then, the observed brightness temperature at mid- to far-infrared wavelengths traces the photospheric temperature of the disk.
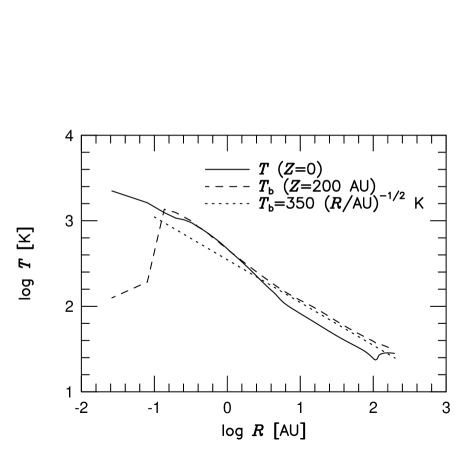
Figure 3 shows radial distributions of the midplane temperature and the brightness temperature at evaluated at . We should be reminded that the SED is not determined by the midplane temperature, but by the brightness temperature. We find that it can be well approximated by in . This brightness temperature distribution is comparable to the temperature distribution , which was derived for HL Tau through spectral modeling (Beckwith et al. 1990). This comparison shows that the disk–halo model can produce the large mid- to far-infrared excess of the typical flat-spectrum T Tauri star. Moreover, from the result that the brightness temperature traces the photospheric temperature of the disk, it follows that the mid- to far-infrared excess originates from the disk.
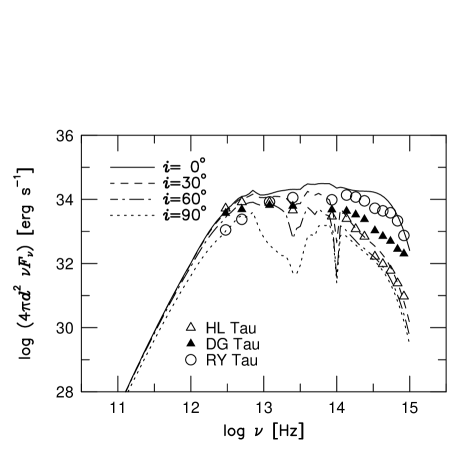
In figure 4 the model SEDs are shown at several viewing angles. As expected from the results described above, the model SEDs are nearly flat in the infrared at viewing angles of and . At , the model SED has a weak negative slope in the infrared, with a deep absorption feature near made by silicate and water ice (see Miyake, Nakagawa 1993). The water ice feature at is also seen at and . In the optical and near-infrared, the shape of the model SED varies significantly with the viewing angle. The optical depth to the central star at band () is 3, 18, and 45 at , , and , respectively. Thus, the central star is highly obscured when viewed at and , and the optical flux is due to the scattered light.
Observational data taken from Strom et al. (1989) for three flat-spectrum T Tauri stars (HL Tau, DG Tau, and RY Tau) are also plotted in figure 4, assuming that the distance to these sources is . Compared with the observational data, we find that the model SEDs can reproduce the overall spectral shape of these sources, although the model parameters are not tuned for any specific object.
3.2 Effects of Disk Accretion
In this subsection we examine the effects of disk accretion on the temperature distribution and the SED. The stellar luminosity is taken to be , and the disk accretion is assumed to contribute to a substantial fraction of the total luminosity. We first consider a steady accretion model, i.e., the accretion rate in the disk is equal to that from the disk onto the star. From analyses of the ultraviolet and optical excesses, the accretion rate has been estimated to be in the range for classical T Tauri stars (Bertout et al. 1988). Hence, we adopt for the steady accretion model. From equations (4) and (5), one obtains accretion luminosities of for the disk and for the bright spot, respectively. The total luminosity is then , which is almost the same as that of the standard model discussed in the previous subsection, and thus it is possible to directly compare models with and without disk accretion.
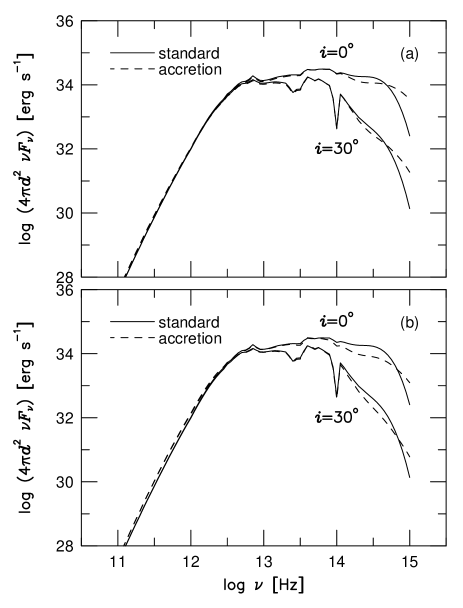
Figure 5 shows a closeup view of the density and temperature distributions to the center for the standard model (upper panel) and for the steady accretion model (lower panel). In the standard model, the temperature distribution is determined entirely by radiative transport of energy emitted by the central star, and the temperature monotonically increases along the vertical direction in the disk. On the other hand, the steady accretion model shows a more complicated temperature structure in the disk. Inside , the temperature is higher at the midplane in the steady accretion model than in the standard model, indicating that viscous dissipation effectively heats the disk in this region. Although the temperature decreases along the vertical direction to transport radiatively the energy generated by viscous dissipation, it rises again toward the disk surface as in the standard model. Note that the temperature distribution of the steady accretion model is quite similar to that of the standard model in the halo and the disk outside , suggesting that viscous dissipation is not an important heating source in these regions.
Figure 6 compares the SEDs of models with and without disk accretion. As discussed in the previous subsection, the mid- to far-infrared portion of the SED is determined mainly by the photospheric temperature of the outer disk. It can be seen from figure 6a that the SED of the steady accretion model does not differ significantly from that of the standard model in the mid- to far-infrared region. Therefore, the photospheric temperature of the outer disk is determined by the radiation energy from the central star and the bright spot, not by viscous dissipation in the disk. The radiation energy source of the standard model is a 4000 K blackbody with , while that of the steady accretion model is a combination of two blackbodies with different temperatures. The difference in the radiation energy spectra appears in the ultraviolet and optical portions of the SED. Compared with the standard model, the steady accretion model shows more ultraviolet and less optical fluxes. The result shown in figure 6a indicates that the mid- to far-infrared portion of the SED, and hence the photospheric temperature of the disk, is not sensitive to the spectrum of the central radiation energy source. This is because the inner region of the halo immediately scatters or absorbs/reradiates radiation from the center at longer wavelengths.
We next consider a model in which accretion takes place unsteadily, in the sense that the disk accretion rate is constant in radius, but it is not equal to the rate at which disk material flows from the inner edge onto the central star. The possibility that accretion flow in HL Tau is unsteady was discussed by Lin et al. (1994). The flattened envelope around HL Tau is inferred to accrete dynamically onto the disk at a rate of , while the accretion rate from the disk onto the central star should be smaller than , because the accretion luminosity cannot be larger than the total luminosity of HL Tau (Lin et al. 1994). In the unsteady accretion model considered here, we adopt , which gives an intrinsic disk luminosity of . The accretion rate from the disk onto the central star is taken to be , which is one order magnitude smaller than , and produces a bright-spot luminosity of . The total luminosity then becomes , which is also comparable to that of the standard model.
Figure 6b shows SEDs for the standard and unsteady accretion models. Comparing these two models, we find no significant difference in the mid- to far-infrared portion of the SED. The unsteady accretion model, however, emits more ultraviolet and less optical flux, which may be attributed to the difference in the spectra of the central radiation energy sources. This feature is similar to that seen in the steady accretion model. In the unsteady accretion model, however, the central star and bright spot emit only about to heat the disk, which would not be sufficient to produce a mid- to far-infrared flux as large as that of the standard or steady accretion model. This deficit of radiation energy is compensated by the accretion energy generated in the innermost region of the disk. In general, most of the accretion energy is released in the innermost region of the system where the gravitational potential well is deep. In the unsteady accretion model we adopt, equation (2) indicates that 80% of the intrinsic disk luminosity is generated inside . The accretion energy released in the innermost region of the disk is radiated at short wavelengths. This emission is subsequently scattered or absorbed and reradiated by the halo to heat the outer region of the disk, producing the large mid- to far-infrared excess, as shown in figure 6b.
Figure 6b also shows that the unsteady accretion model produces more flux at radio wavelengths than the standard model. At radio wavelengths, our disk model is optically thin, and thus the emergent flux is related to the temperature at the midplane where disk material is concentrated. Our result indicates that, for a fixed total luminosity, disk accretion at a rate as high as can increase the radio flux by increasing the midplane temperature, although it does not modify the mid- to far-infrared portion of the SED.
3.3 Dependence on the Halo Density Distribution
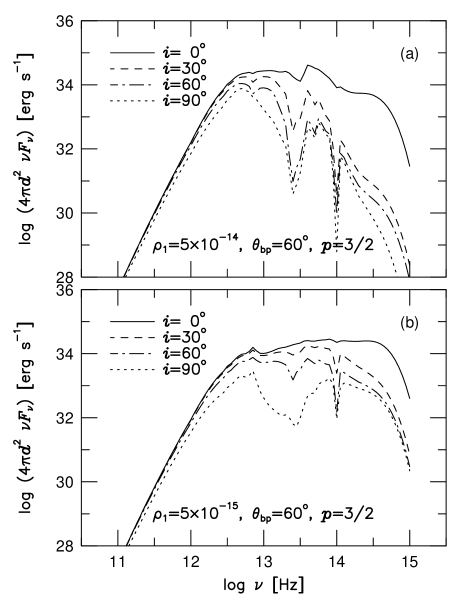
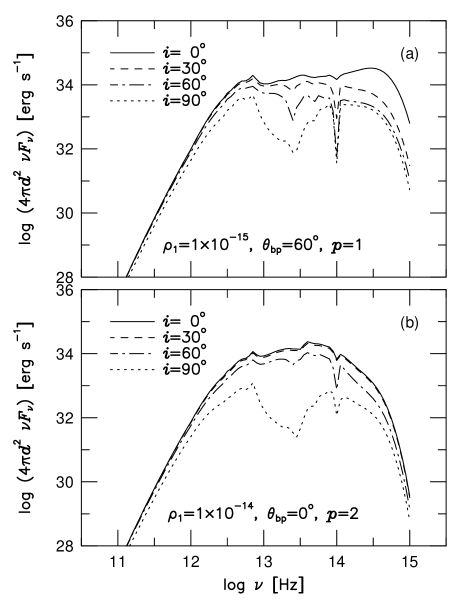
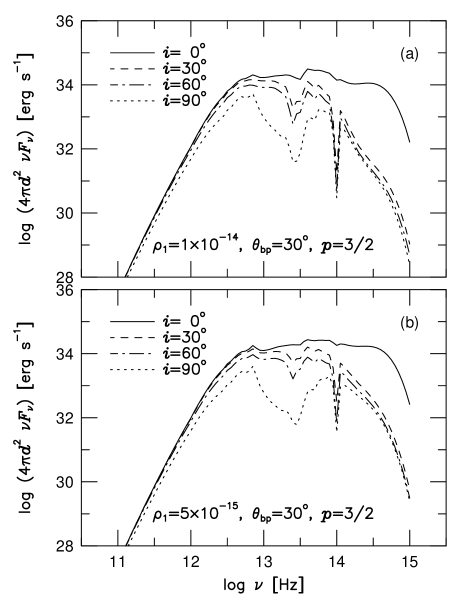
As illustrated in the previous subsection, the mid- to far-infrared portion of the SED is not sensitive to disk accretion. We therefore examine how the flat infrared spectrum depends on the assumed halo density distribution using models without disk accretion. We first test the sensitivity of the SED to the size of the bipolar lobes. Figure 7a shows SEDs for a model with the opening half-angle of the bipolar holes being . The other parameters for the halo density distribution are the same as those of the standard model, i.e., and . Compared with the standard model having , the emergent flux is considerably reduced at optical and near-infrared wavelengths when viewed at , because less optical and near-infrared light can escape from the central star through the bipolar holes. This means that more energy from the central star is used to heat the outer region of the disk. As a result, the mid- to far-infrared flux increases slightly, compared with the standard model. However, the effect of narrowing the opening half-angle of the bipolar holes may be compensated by reducing . Figure 7b shows SEDs for a model with a lower halo density: , , and . As with the standard model, this model also produces flat infrared spectra when the viewing angle is . However, some differences are found in the SED. The absorption feature near is shallower due to the reduced halo density, and the slope of the SED is more steep from the near-infrared to the optical.
Secondly, we examine how the halo density affects the SED. In figures 8a and 8b, model SEDs are shown for and , respectively. For both models, we adopt and . The model with a higher halo density, , shows relatively narrow SEDs when viewed at , and the peak of the SED occurs in the far-infrared. The emergent flux steeply declines from the near-infrared to the optical, because light from the hot inner regions is highly extinguished by the dense halo and only a small amount of scattered photon can escape the halo. Thus, this model is not classified as a “class II” object with flat infrared spectrum unless it is observed precisely pole-on. On the other hand, a model with a lower halo density, , still produces flat SEDs at a wide range of viewing angles, .
Finally, we examine the dependence of SEDs on the power-law index, . A molecular cloud core which collapses to form a star and a disk is expected to be rotating. At later stages of the collapse, infalling material lands onto the equatorial plane, rather than onto the central star. Thus, the halo density is reduced inside the centrifugal radius, and it decreases more slowly with the radius than spherically symmetric cases. We then consider a model with , , and . As shown in figure 9a, this model also produces flat infrared spectra at viewing angles of . Compared with the standard model, it emits more optical flux, because the halo density is lower in the innermost region, so that more optical light escapes the halo.
If the central star drives a stellar wind with constant velocity and mass outflow rate, a power law, , is appropriate for the halo density distribution. Figure 9b shows SEDs for a model with , , and . Because the slope of the SEDs is positive in the infrared, is not favored by the flat spectrum.
4 Discussion
4.1 Origin of the Flat Spectrum
The present results show that the disk–halo model can reproduce the overall spectral shape of typical flat-spectrum T Tauri stars. In our model, the mid- to far-infrared excesses of flat-spectrum T Tauri stars originate from the disk, rather than from the halo. The halo needed to heat the disk can be as compact as the disk, itself, and we suggest that a reflection nebula often associated with a T Tauri star is an observational counterpart of the halo. The reflection nebula probably corresponds to the inner part of a remnant of an infalling envelope. The disk–halo model is therefore consistent with the notion that the flat-spectrum T Tauri stars are in a transitional stage from protostars to T Tauri stars (Hayashi et al. 1993).
In contrast with the disk–halo model, the infalling envelope model of Calvet et al. (1994) explains the mid- to far-infrared excesses by the emission from infalling envelopes. Indeed, observations of molecular line emission have revealed extended, disk-like envelopes associated with several flat-spectrum T Tauri stars (Hayashi et al. 1993; Kitamura et al. 1996a; Momose et al. 1996). However, recent high-resolution observations have shown that the continuum emission at submillimeter and millimeter wavelengths originates entirely from a compact () region, suggesting that the extended () envelopes traced by molecular line emission do not contribute to the submillimeter and millimeter emission (Lay et al. 1994; Kitamura et al. 1996b; Looney et al. 2000). Since infrared emission originates from warmer regions than submillimeter and millimeter emission, it is quite unlikely that the extended envelopes contribute to the infrared emission. Hence, the mid- to far-infrared excesses of flat-spectrum T Tauri stars should also originate from a compact region. The disk–halo model produces emission at any wavelength from a compact region, and therefore is more consistent with this observational constraint than the infalling envelope model.
If the mid- to far-infrared excesses of flat-spectrum T Tauri stars are to be explained by the emission arising at in their infalling envelopes (Calvet et al. 1994), they should have been surrounded by sufficient amount of infalling material at a radius of as protostars are. Growing observational evidence, however, indicates that at these radii the amount of infalling material around flat-spectrum T Tauri stars is much less than that around embedded protostars (Ohashi et al. 1991, 1996), suggesting that the amount of infalling material inside around the central sources decreases during the course of evolution from protostars to T Tauri stars. Dispersing motion in the envelopes has actually been observed for T Tau (Momose et al. 1996) and DG Tau (Kitamura et al. 1996a). HL Tau is suggested to be situated in the bubble wall, which is an expanding shell with XZ Tau being the closest known source to the center (Welch et al. 2000). In addition, Momose (1998) showed that envelopes around flat-spectrum T Tauri stars are less centrally condensed than those around protostars. These results imply that infalling material around has been dissipated away, or has accreted onto the central star/disk system.
In our view, the inner parts of the envelopes around flat-spectrum T Tauri stars are still optically thick to stellar radiation, although they do not have sufficient mass to produce the mid- to far-infrared excesses. For instance, the visual extinction toward HL Tau was estimated to be (Stapelfeldt et al. 1995), which is comparable to that in our calculations. In the disk–halo model, visual extinction varies widely depending on the viewing angle as well as on the density distribution in the halo; thus, our model can explain the flat spectrum for objects with various visual extinction values. The detailed structure of the halo, however, cannot be predicted by the analysis of SEDs, because the halo structure is not unique to give the observed flat spectra. Obviously, to solve the degeneracy, further observational information is needed on the structure within 100 AU. High-resolution observations of the scattered light in the near-infrared may provide crucial information on the structure of the disk and halo (Close et al. 1997). We will report on a comparison between the disk–halo model and near-infrared observations in a future paper.
4.2 Effects of Shock Heating
If the halo is an innermost part of the infalling envelope, the envelope gas should shock the disk surface. This shock heating could be an important energy source which our analyses do not take into account. To clarify quantitatively how shock heating modifies the SED in the infrared region, detailed radiation hydrodynamics calculations will be needed. Although such analysis is beyond the scope of this paper, we can discuss that the amount of energy released at the disk surface by the shock would not be sufficient to modify the SED obtained in our standard model.
Suppose that envelope gas freely falls onto the disk along a ballistic orbit, the initial cloud core is spherically symmetric and uniformly rotating, the infall is initiated by the expansion wave (Shu 1977), and the gas joins a Keplerian disk behind the shock. The amount of energy dissipated at shock per unit mass is . We denote by the mass flux from the envelope on the disk at radius , which is given by equation (2.1) in Nakamoto and Nakagawa (1994). If we adopt (Hayashi et al. 1993), ( is denoted by in Nakamoto, Nakagawa 1994), and , the energy generation rate due to shock heating at the disk surface per unit area, , is given by
| (8) | |||||
If there were no irradiation from the central star, the disk surface would be heated by shock heating to the temperature
| (9) | |||||
which is much lower than the temperature obtained by our standard model including irradiation (see figure 3). Therefore, it seems that shock heating at the surface of the disk has only a negligible effect on the observed SED from the flat-spectrum T Tauri disk.
5 Conclusions
-
1.
We have shown that disks heated by the scattering and reprocessing of the stellar radiation through the halo can have flat infrared spectra.
-
2.
Local viscous heating is not sufficient to produce large mid- to far-infrared emission from the disk if we consider a reasonable rate of mass accretion in disks around classical T Tauri stars. However, the accretion energy released in the innermost region of the star/disk system is transported by radiation through the halo to heat the outer region of the disk, resulting again in a flat spectrum.
-
3.
We examined the sensitivity of the SED to the assumed halo structure, and found that density distributions with a power-law index can provide the backwarming needed for flat infrared spectra. However, we have found that it is difficult to constrain the halo structure only from the SED in the infrared.
-
4.
We have discussed that the halo will be observed as a reflection nebula often associated with a T Tauri star, indicating that it is the inner part of a remnant of an infalling envelope. A more detailed test of the model will be made by comparisons with imaging observations of near-infrared scattered light.
We are grateful to M. Hayashi and M. Umemura for valuable discussions. We also thank an anonymous referee for suggestions which improved the paper. The computations were performed on CP-PACS at the Center for Computational Physics in University of Tsukuba, and on the Fujitsu VPP300/16R at the Astronomical Data Analysis Center of the National Astronomical Observatory, Japan. TN was partially supported by the Grant-in-Aid for Scientific Research on Priority Areas (10147105) and for Scientific Research (10740093) of the Ministry of Education, Culture, Sports, Science, and Technology, Japan.
References
- [Adams, Lada, Shu 1988] Adams, F. C., Lada, C. J., & Shu, F. H. 1988, ApJ, 326, 865
- [Adams, Shu 1986] Adams, F. C., & Shu, F. H. 1986, ApJ, 308, 836
- [Beckwith et al. 1990] Beckwith, S. V. W., Sargent, A. I., Chini, R. S., & Güsten, R. 1990, AJ, 99, 924
- [Bertout, Basri, Bouvier 1988] Bertout, C., Basri, G., & Bouvier, J. 1988, ApJ, 330, 350
- [Butner, Natta, Evans 1994] Butner, H. M., Natta, A., & Evans, N. J., II 1994, ApJ, 420, 326
- [Calvet et al. 1994] Calvet, N., Hartmann, L., Kenyon, S. J., & Whitney, B. A. 1994, ApJ, 434, 330
- [Chiang, Goldreich 1997] Chiang, E. I., & Goldreich, P. 1997, ApJ, 490, 368
- [Close et al. 1997] Close, L. M., Roddier, R., Northcott M. J., Roddier, C., & Graves, J. E. 1997, ApJ, 478, 766
- [D’Alessio, Calvet, Hartmann 1997] D’Alessio, P., Calvet, N., & Hartmann, L. 1997, ApJ, 474, 397
- [Hayashi, Nakagawa, Nakazawa 1985] Hayashi, C., Nakazawa, K., & Nakagawa, Y. 1985, in Protostars and Planets II, ed. D. C. Black & M. S. Matthews (Tucson: Univ. Arizona Press), 1100
- [Hayashi, Ohashi, Miyama 1993] Hayashi, M., Ohashi, N., & Miyama, S. M. 1993, ApJ, 418, L71
- [Kenyon, Calvet, Hartmann 1993] Kenyon, S. J., Calvet, N., & Hartmann, L. 1993, ApJ, 414, 676
- [Kenyon, Hartmann 1987] Kenyon, S. J., & Hartmann, L. 1987, ApJ, 323, 714
- [Kitamura, Kawabe, Saito 1996a] Kitamura, Y., Kawabe, R., & Saito, M. 1996a, ApJ, 457, 277
- [Kitamura, Kawabe, Saito 1996b] Kitamura, Y., Kawabe, R., & Saito, M. 1996b, ApJ, 465, L137
- [Kusaka, Nakano, Hayashi 1970] Kusaka, T., Nakano, T., & Hayashi, C. 1970, Prog. Theor. Phys. 44, 1580
- [Lay et al. 1994] Lay, O. P., Carlstrom, J. E., Hills, R. E., & Phillips, T. G. 1994, ApJ, 434, L75
- [Lin et al. 1994] Lin, D. N. C., Hayashi, M., Bell, K. R., & Ohashi, N. 1994, ApJ, 435, 821
- [Looney, Mundy, Welch 2000] Looney, L. W., Mundy, L. G., & Welch, W. J. 2000, ApJ, 529, 477
- [Lynden-Bell, Pringle 1974] Lynden-Bell, D., & Pringle, J. E. 1974, MNRAS, 168, 603
- [Masunaga, Miyama, Inutsuka 1998] Masunaga, H., Miyama, S. M., & Inutsuka, S. 1998, ApJ, 495, 346
- [Miyake, Nakagawa 1993] Miyake, K., & Nakagawa, Y. 1993, Icarus, 106, 20
- [Momose 1998] Momose, M. 1998, PhD thesis, The Graduate University for Advanced Studies
- [Momose et al. 1996] Momose, M., Ohashi, N., Kawabe, R., Hayashi, M., & Nakano, T. 1996, ApJ, 470, 1001
- [Nakamoto, Nakagawa 1994] Nakamoto, T., & Nakagawa, Y. 1994, ApJ, 421, 640
- [Natta 1993] Natta, A. 1993, ApJ, 412, 761
- [Ohashi et al. 1996] Ohashi, N., Hayashi, M., Kawabe, R., & Ishiguro, M. 1996, ApJ, 466, 317
- [Ohashi et al. 1991] Ohashi, N., Kawabe, R., Hayashi, M., & Ishiguro, M. 1991, AJ, 102, 2054
- [Sargent, Beckwith 1991] Sargent, A. I., & Beckwith, S. V. W. 1991, ApJ, 382, L31
- [Shu 1977] Shu, F. H. 1977, ApJ, 214, 488
- [Stapelfeldt et al. 1995] Stapelfeldt, K. R., Burrows, C. J., Krist, J. E,, Trauger, J. T., Hester, J. J., Holtzman, J. A., Ballester, G. E., Casertano, S., Clarke, J. T. Crisp, D., Evans, R. W., Gallagher, J. S., III, Griffiths, R. E., Hoessel. J. G., Mould, J. R., Scowen, P. A., Watson, A. M., & Westphal, J. A. 1995, ApJ, 449, 888
- [Stone, Mihalas, Norman 1992] Stone, J. M., Mihalas, D., & Norman, M. L. 1992, ApJS, 80, 819
- [Strom et al. 1989] Strom, K. M., Strom, S. E., Edwards, S., Cabrit, S., & Skrutskie, M. F. 1989, AJ, 97, 1451
- [Welch et al. 2000] Welch, W. J., Hartmann, L., Helfer, T., & Briceño, C. 2000, ApJ, 540, 362