A statistical detection of gamma-ray emission from galaxy clusters: implications for the gamma-ray background and structure formation.
Abstract
The origin of the diffuse extragalactic, high-energy gamma-ray background (EGRB) filling the Universe remains unknown. The spectrum of this extragalactic radiation, as measured by the Energetic Gamma Ray Experiment Telescope (EGRET) on-board the Compton Gamma-Ray Observatory (CGRO), is well-fit by a power law across nearly four decades in energy, from 30 MeV to 100 GeV. It has been estimated that not more than a quarter of the diffuse gamma-ray background could be due to unresolved point sources. Recent studies have suggested that much of the diffuse background could originate from the up-scatter of cosmic microwave background (CMB) photons by relativistic electrons produced by shock waves in the intergalactic medium (IGM) during large-scale structure formation. In this work we search for evidence of gamma-ray emission associated with galaxy clusters by cross-correlating high Galactic latitude EGRET data with Abell clusters. Our results indicate a possible association of emission with clusters at a level. For a subset of the 447 richest () clusters the mean surface brightness excess is ph cm-2 s-1 sr-1 (MeV), corresponding to a typical non-thermal bolometric luminosity of erg s-1. Extrapolating this measurement and assuming no evolution we conservatively estimate that % of the EGRB could originate from clusters with . For this cluster population the predicted non-thermal luminosity is in excellent agreement with our measurement, suggesting that the clusters have experienced mass accretion within the last yrs. If correct, then future gamma-ray missions, such as the Gamma-ray Large Area Space Telescope (GLAST) should be able to directly detect nearby galaxy clusters.
1 Introduction
During the nine years (1991 - 2000) EGRET was operational on-board the Compton Gamma-Ray Observatory, it detected a diffuse gamma-ray emission above 30 MeV filling the Universe. This gamma-ray background is composed of an intense Galactic component, due to cosmic ray interactions with local interstellar gas and radiation (Hunter et al., 1997), as well as a diffuse and isotropic extragalactic component. The extragalactic radiation is well described by a simple power law with index from 30 MeV to 100 GeV (Sreekumar et al., 1998). The nature of this extragalactic gamma-ray background (EGRB) has long been debated. It is not clear if the EGRB has a purely diffuse origin or is made up of the superposition of discrete, unresolved, point sources. The majority of the identified EGRET sources are active galaxies in the blazar class, and this has led to the suggestion that the EGRB is produced by an unresolved population of blazars (Padovani, Ghisellini, Fabian, & Celotti, 1993). However, estimates of contributions from unresolved gamma-ray blazars range from nearly all (Stecker & Salamon, 1996, 2001) to less than about a quarter (Chiang & Mukherjee, 1998; Mücke & Pohl, 2000). It seems likely that other sources of the diffuse extragalactic radiation must exist.
Recent work by Loeb & Waxman (2000) has suggested that some, if not most of the diffuse gamma-ray background could be a result of large-scale structure formation in the Universe. Gravitationally-induced shock waves produced during cluster mergers and large-scale structure formation give rise to highly relativistic electrons which are responsible for Compton up-scattering the cosmic microwave background photons to high energy gamma-rays. The fraction of the shocks’ thermal energy transferred to relativistic electrons could range from 1-10% (Waxman & Loeb, 2000). The gamma-ray background is then expected to be produced in filaments, sheets, and extended () gamma-ray halos associated with newly formed massive clusters (Waxman & Loeb, 2000). In some scenarios, the shock radii for clusters could be large, with gamma-rays detectable in the form of 5-10 Mpc-diameter ring-like emission tracing the cluster virialization shock (Keshet et al., 2002). Other work has suggested that some % of the EGRB could arise solely from the population of clusters (Colafrancesco & Blasi, 1998). Recent simulation studies of a CDM universe suggest that future high energy gamma-ray experiments such as GLAST or the next generation of atmospheric Cherenkov telescopes should be able to resolve gamma-rays from individual clusters in the local Universe (, Keshet et al. (2002)). The association of the EGRB with the large scale structure of the Universe can then be tested by cross-correlating gamma-ray maps with known galaxy clusters.
So far, individual galaxy clusters have not been found to be correlated with discrete gamma-ray sources detected by EGRET, although it has been suggested that they may be candidates for unidentified EGRET sources (Totani & Kitayama, 2000). In most cases the predicted gamma-ray fluxes from nearby individual clusters (Dar & Shaviv, 1995; Colafrancesco & Blasi, 1998) are below the sensitivity limit of EGRET, and indeed, no excess gamma-ray emission is seen from any individual cluster. For example, a upper limit of photons cm-2 s-1 at energies greater than 100 MeV can be derived for Coma, the closest rich cluster (Sreekumar et al., 1996). However, in some cases the predicted emissivity from individual clusters is in disagreement with the EGRET upper limits (Ensslin, Biermann, Kronberg, & Wu, 1997).
Previous efforts to constrain the gamma-ray emission of clusters used a small sample (58) of X-ray luminous clusters (Reimer, 1999), and found no significant signal when the EGRET data centered on the clusters were co-added. Corrections for Galactic diffuse emission were not made, and a likelihood analysis of the data found no statistically significant emission associated with the clusters. Colafrancesco (2002) has recently reported preliminary evidence of the association of unidentified EGRET sources with galaxy clusters at high latitudes, claiming that these sources also show strong radio emission. Relativistic particles responsible for the radio emission are probably also the source of inverse-Compton gamma-rays. However, the number of claimed associations is small, and no account was taken of the known deviation from Poissonian statistics due to cluster-cluster correlations. As we discuss below, even at high Galactic latitudes - and even with the removal of the best model of Galactic emission - residual Galactic signatures remain, which is a known feature of these models (Hunter et al., 1997). Furthermore, by utilizing the much larger (albeit more inhomogeneous) optical Abell catalog of clusters and evaluating emission in radial bins, we increase our search sensitivity by a factor of 100-1000.
In the present analysis we search for angular correlations of the EGRET extragalactic diffuse emission with cluster position, using the complete Abell catalog of clusters (§2), and radially binning the gamma-ray emission around the Abell clusters (§3,4). We then estimate the average gamma-ray luminosity per cluster and address the question of whether this is consistent with recent predictions of the gamma-ray energy flux arising from intergalactic shocks, based on semi-analytic predictions and hydrodynamical cosmological simulations (§5,6).
2 Data Analysis
We have used archival gamma-ray data from all nine years of EGRET observations for our present analysis 111as directly available from the HEASARC archives http://heasarc.gsfc.nasa.gov/. The maps were generated by summing data over Phases 1-3 and Cycles 4-9 of the EGRET observations, using only photons with inclination angles of less than . EGRET covers an energy range of 30 MeV to over 20 GeV. Details of the EGRET instrument and capabilities may be found in Kanbach et al. (1988). The point spread function (PSF) of EGRET is strongly energy-dependent, and varies from nearly (FWHM) at 100 MeV to at GeV (Thompson et al., 1993). EGRET has proved to be a highly successful gamma-ray experiment, comprehensively surveying the gamma-ray sky from 1991-2000. The Third EGRET (3EG) Catalog (Hartman et al., 1999a) lists the 271 point sources detected by EGRET during the first four cycles of its mission (1991-1995). Since cycle 4, EGRET has been operated in a narrow field-of-view mode for instrumental reasons (Hartman et al., 1999b). Of the 271 point sources in the 3EG catalog, over 60% are unidentified.
The diffuse gamma-ray emission detected by EGRET consists of two components, one Galactic, and the other assumed to be extragalactic and isotropic. A model for the Galactic diffuse gamma-ray emission was calculated using EGRET data from 1991-1993 (Hunter et al., 1997); a diffuse model using all nine years of EGRET data is not yet available. Other models of the diffuse galactic gamma-ray emission, also using subsets of the EGRET data, have been presented by Strong, Moskalenko, & Reimer (2000) and Pohl & Esposito (1998) (for GeV emission). The model of Hunter et al. (1997) assumes that cosmic rays are coupled to the interstellar matter density. The gamma-rays are produced mainly by the interaction of cosmic-ray protons and electrons with the ISM. The Galactic diffuse component is found to be highly peaked along the Galactic plane. This model generally describes the EGRET data well on larger scales, but is less successful for individual regions of the sky. Hunter et al. (1997) discuss the residual (observed minus best-fit model) intensity in their analysis of the EGRET galactic diffuse emission. The large scale residual distributions for energies MeV are less than photons s-1 cm-2 sr-1, and are roughly distributed around zero intensity. For our analysis, we subtract the modeled Galactic component of the gamma-ray emission from the EGRET gamma-ray intensity skymaps (see below).
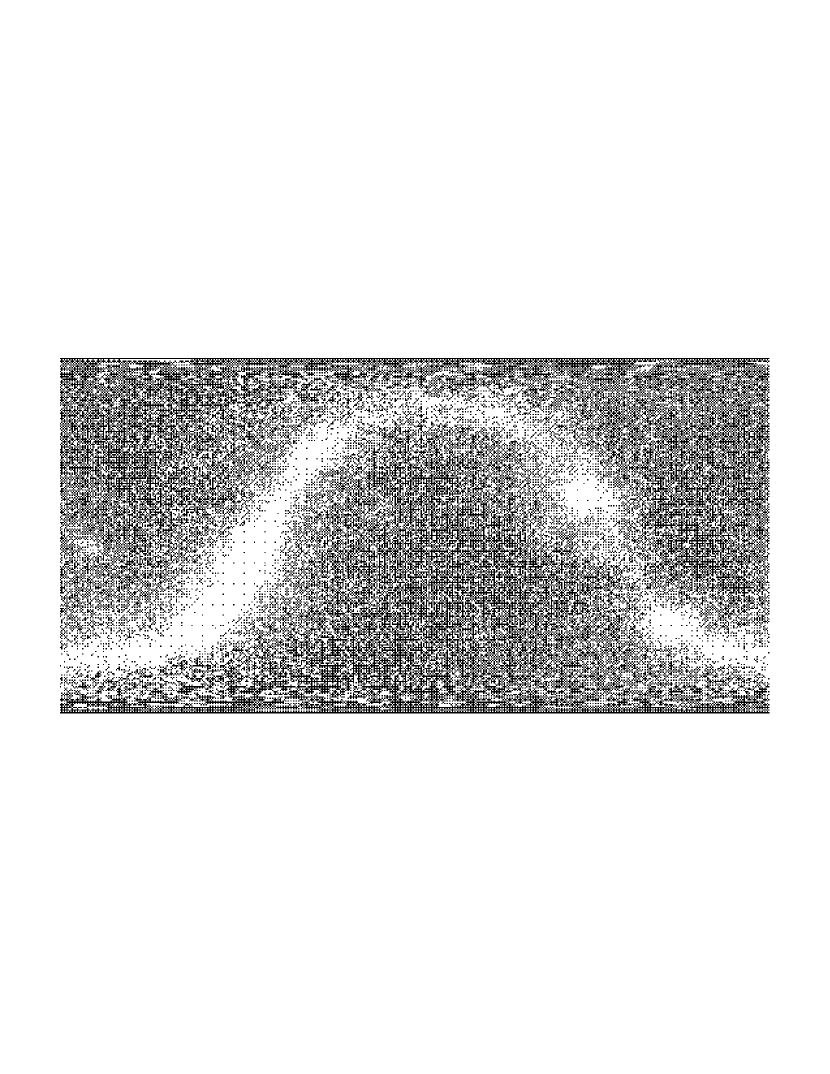
The EGRET data used here have been projected into a , ( pixel size in coordinate units) equatorial grid containing intensities (photons cm-2 s-1 sr-1) (Figure 1). We also utilize the maps of raw photon counts in the same projection, in order to evaluate the Poisson noise associated with each pixel (see below). Our primary dataset contains photons from all energies MeV. We have also analyzed the GeV dataset (which has a correspondingly smaller PSF), although the increased photon shot-noise results in no statistically significant measurements.
Prior to evaluating the cluster-EGRET cross-correlations we typically perform three sets of clipping or corrections to the data, unless described otherwise below. First, 2.7∘ radius regions (on the sphere of the sky) are excised around the 100 identified EGRET sources to reduce the overall shot noise level. This corresponds to the 90% enclosed flux radius of the full energy weighted ( MeV, spectrum) EGRET PSF. Using the 99% enclosed flux radius of has a negligible effect on our results. The identified sources consist of 67 blazars and 6 pulsars, as well as 27 sources marginally identified as gamma-ray blazars.
An additional 171 unidentified, faint, EGRET sources have been cataloged. However, the majority of these are close to the Galactic Plane within the Galactic Plane cut we describe below (only 41 of all EGRET sources have ; of those, 22 are identified, 19 unidentified). Excising these additional, unidentified sources has a negligible effect on our results and we have therefore chosen to remove only those sources of known origin. As described above, no sources are identified with known clusters of galaxies.
Second, the region with is removed to eliminate the high intensity Galactic Plane emission. The choice of this cut is determined by a combination of the desire to minimize the Galactic contamination and the latitude-dependent incompleteness of the Abell catalog (see below), and to maximize the number of Abell clusters used in evaluating the cross-correlation function (thereby maximizing sensitivity and keeping shot noise to an acceptable level). Variations of on this cut have a negligible effect on our results.
Third, the detailed model of the diffuse Galactic emission intensity in the EGRET data (as described above, Hunter et al. (1997)) is subtracted from the masked sky map. Since this model has small residuals, in some instances (5%) where the EGRET data is non-zero, the subtraction results in a negative intensity in a given pixel. The value of the residuals of the model are scattered about zero (relative to the mean subtracted Galactic emission), but do seem to exhibit some correlation with galactic latitude, especially at lower energies, being more negative at lower and away from the Galactic center (Hunter et al., 1997). In our analyses we also utilize the raw EGRET photon count maps to estimate the Poisson, or shot noise, due to finite photon statistics. Specifically we always construct weighted means where weights are assigned as , where is the raw photon number in a given pixel and is the pixel solid angle, which varies with latitude. Consequently all pixels with zero photons acquire zero weight in the calculation of the mean (an unweighted mean, which simply excludes the zero photon pixels, is found to have a negligible difference from the weighted mean for our purposes).
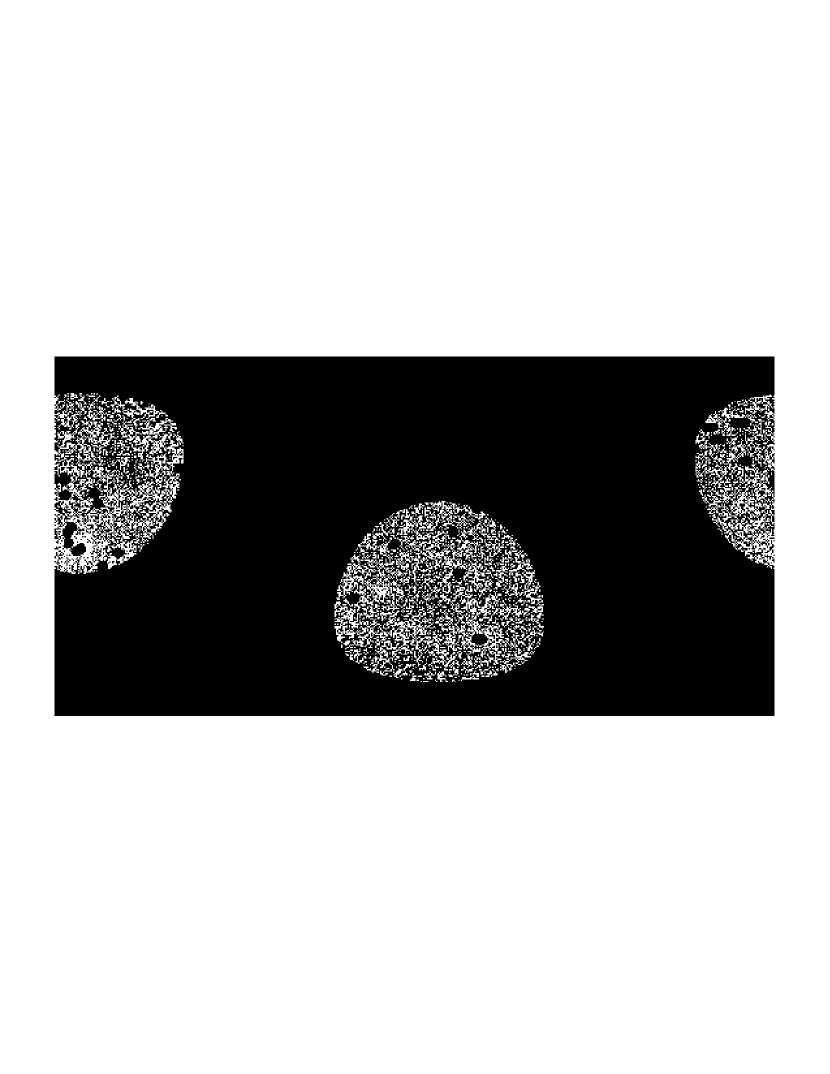
For most of the analyses described below we are left with a total of usable EGRET pixels ( deg2). The effect of any remaining Galactic emission on our results is discussed below. The final EGRET dataset is shown in Figure 2. The mean intensity is ph s-1 cm-2 sr-1.
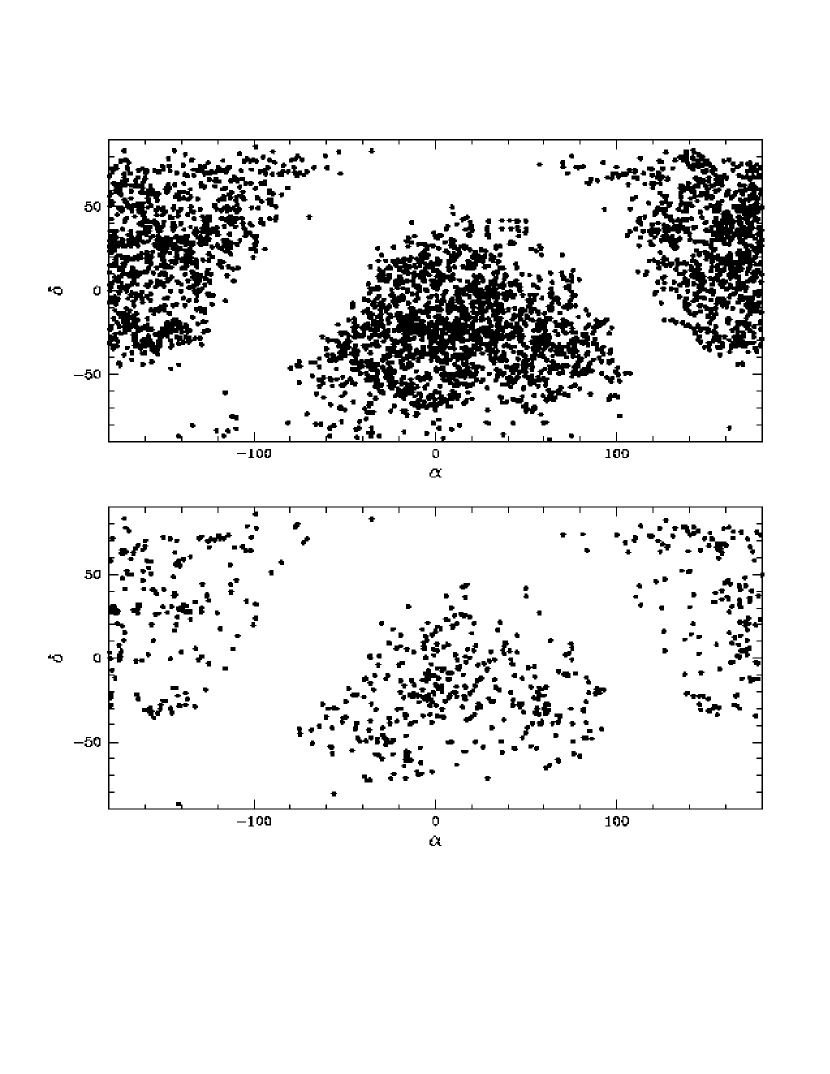
The catalog of Abell clusters we utilize consists of the original Abell catalog of 2712 systems, plus the southern ACO extension of 1364 clusters (Abell, Corwin, & Olowin, 1989). Figure 3 plots the clusters for comparison to the EGRET data. We have used the basic Abell parameters of richness () and distance class () in the analysis presented below. Specifically, we have split the sample between (Figure 3) and and among various distance classes. We have also utilized the X-ray selected Brightest Cluster Survey (BCS) of 206 clusters (Ebeling et al., 1998), combined with the extended BCS catalog of an additional 108 fainter systems (Ebeling et al., 2000), although as described below, the larger shot noise of this smaller X-ray sample prohibits robust measurements.
2.1 Cross-correlation
The most rigorous cross-correlation analysis of a surface brightness map and a collection of points (clusters) would involve a direct summation over sky cells, smoothing the point distribution by the same kernel (PSF) as the surface brightness (e.g., as is applied to all-sky X-ray data (Jahoda, Mushotzky, Boldt, & Lahav, 1991; Lahav et al., 1993; Miyaji, Lahav, Jahoda, & Boldt, 1994)). In the case of the EGRET data, however, we have chosen a cruder approach of summing, or stacking, gamma-ray emission in radial annuli centered on all Abell clusters, and then determining the statistical mean in each angular bin. Ostensibly this does not differ much from the cell-summation approach, and, unlike cell-summation, we obtain a direct estimate of the excess emission associated with clusters by explicitly including the cluster coordinate information. Using the cell-summation technique would require more extensive modeling to extract this measure (Lahav et al., 1993). Additionally, given the potentially complex residual contamination by diffuse, or unresolved, Galactic emission, and the known selection biases of the Abell catalog, the stacking approach allows for more intuitive modeling (see §3.1 below).
Given an equatorial pixel size of for the EGRET data and the 68% flux enclosure at radius for the energy weighted MeV PSF, we choose annular bins of width in our analysis. We note that the energy dependent PSF can be described as , where is the energy dependent radius for 67% flux enclosure (Thompson et al., 1993; Esposito et al., 1999). The area-noise weighted mean flux excess (hereafter referred to as the mean, see §2) above the global mean (calculated from all unmasked, Galactic-corrected pixels) is then evaluated by using all unmasked pixels in each radial bin, out to for each cluster, and then averaging over all clusters used. Pixels are used if their centers lie within a given annulus, consequently there is some variation in the number of pixels counted between different cluster centers, however this variation is negligible on averaging over many objects. We refer to this angular function as or in the results in §3 below. In §3.1 we assess its significance.
3 Results
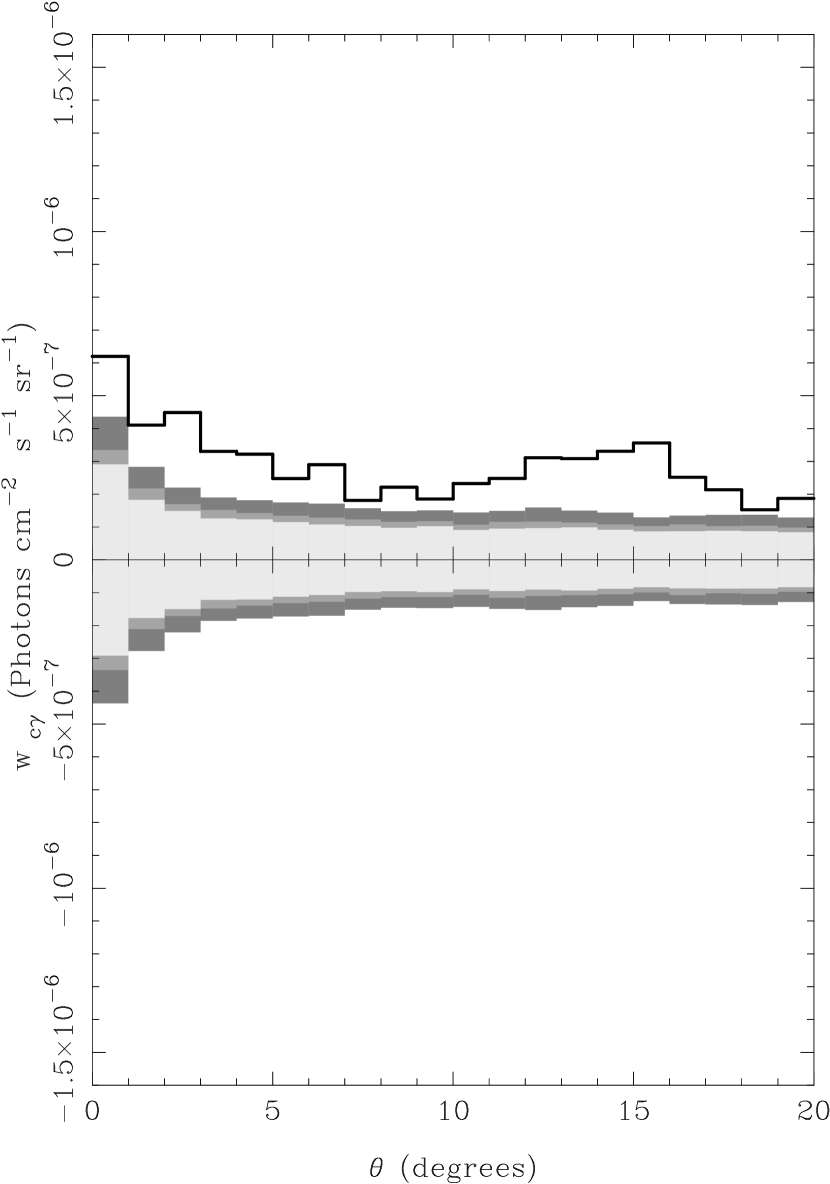
In Figure 4 we plot our principal results. The curve for all 2469 Abell clusters with peaks at a value of ph s-1 cm-2 sr-1 in the 1∘ bin, and gently declines with . This is generically the behavior expected for a positive correlation between the two datasets. Upper and lower heavy curves are for the richest () and poorest () Abell subsets. We note that, based on the theoretical predictions, more massive cluster systems are expected to be the sites of higher gamma-ray emission (Loeb & Waxman, 2000). Consequently, the increased amplitude of the rich cluster relative to that of the poorer clusters goes in the expected sense if clusters are indeed diffuse gamma-ray sources. The peak amplitude for the rich cluster subset, in the bin, is ph s-1 cm-2 sr-1.
We have also investigated the effect of using subsets of the Abell catalog divided using the distance parameter , which is based on the brighter galaxy magnitudes in a cluster. The increased noise of using smaller subsets of clusters makes these measurements less significant. Using only the more distant () subset, which is still large, has little effect on the results presented here, with variations well within the noise.
In addition, since X-ray-selected clusters are considered to be more robust in terms of being real, gravitationally relaxed systems, we have run our cross-correlation using the 304 clusters of the BCS (Ebeling et al., 1998, 2000). However, only 159 systems remain after the Galactic cuts are applied and the resulting is too noisy to draw any conclusions.
Finally, at energies above 1 GeV the EGRET PSF has a FWHM of only . In principle this could help reduce the effect of Galactic contamination, and enhance the cross-correlation measure for compact, resolved, sources associated with clusters. In practice though, the increased photon shot noise of the GeV data result in a statistically insignificant (although still positive) .
3.1 Monte Carlo Tests
The strongly energy-dependent EGRET point-spread function (Thompson et al., 1993), in combination with a complex diffuse Galactic emission contribution and local large-scale structure traced by galaxy clusters (e.g. the Super-Galactic Plane), indicates that the most direct way to assess the significance of any measurement is via Monte-Carlo simulations.
Our primary goal is to determine the significance of any positive correlation between the centroids of local galaxy clusters and the EGRET intensity map. We therefore perform two sets of Monte Carlo simulations. First, we retain the true sky distribution of galaxy clusters but use ”fake” EGRET data. Pixel values are assigned by drawing values randomly from the real (masked and Galactic model subtracted) data, repeats are allowed, and photon shot noise is carried with the surface brightness. Second, we retain the true EGRET data but randomize the galaxy cluster positions. In both cases we generate 1000 random realizations and perform an identical angular cross-correlation analysis to that made on the real data. The population distribution of the angular cross-correlation in each angular bin is then determined and limits containing 90%, 95%, and 99% of the realizations, centered about the means, are obtained.
The first approach removes all residual Galactic emission correlations and all PSF effects, and we consider this to be the true baseline for the case of uncorrelated noise. The second approach is more conservative, since any residual Galactic structure is still present and the precise noise characteristics of the EGRET data are retained. Our second set of Monte Carlo simulations generate random position cluster catalogs with the same number of entries as the real data, although without the measured cluster-cluster correlation properties. The Abell catalog has a known angular selection function, due to increasing absorption and increasing star-galaxy confusion towards the Galactic Plane. This has been fit to a simple law: , where is Galactic latitude and has values ranging from (Bahcall & Soneira, 1983) to (Romani & Maoz, 1992) depending on the particular subset of clusters modeled. Here we conservatively apply the larger correction to our simulated catalogs in order to reproduce the gross features of the Abell cluster selection.
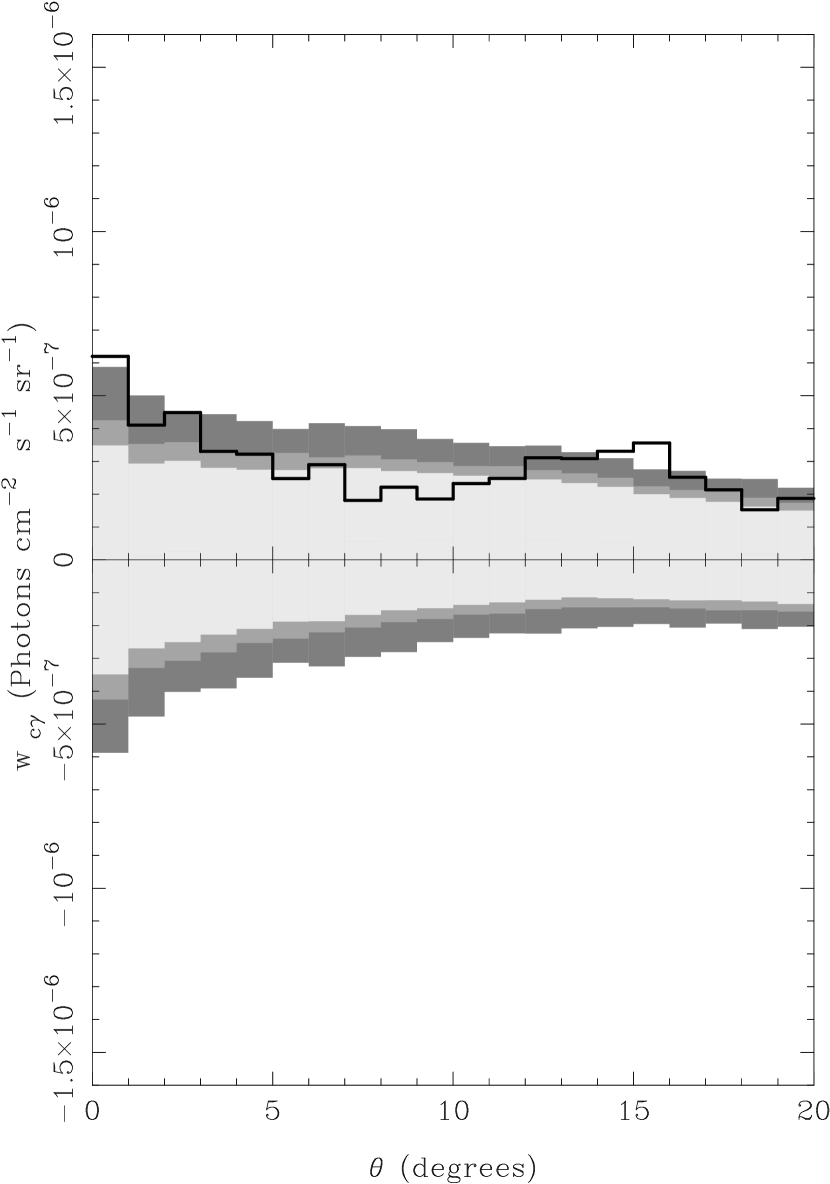
In Figures 5 and 6 the results from the first set of Monte Carlo simulations (randomly re-sampled EGRET data) are presented for all clusters, and for just rich clusters, respectively. In Figures 7 and 8 the results for the second set of simulations (random Abell catalogs) are presented in the same format.
For all cases shown in Figures 5, 6, 7, and 8 the measured in the bin is significant at the level. We note that had clusters exhibited much more significant emission in the EGRET data then it is likely they would have already been directly detected. Our result therefore occupies a significance regime inaccessible to anything but statistical analysis.
4 Further analysis
In order to assess more completely the significance of the shape of the measured we have evaluated the cluster-cluster correlation () for the rich () subset, with identical sky incompleteness (i.e., the same sky mask as applied to the EGRET data), and using the same annular binning technique. We also convolve with the EGRET PSF (see below). and should agree at large angular scales (e.g. ) (if the correct normalization between cluster sky density and gamma-ray emissivity is known). At small angular scales should match only in the case of point-like emission coincident with the clusters. For moderately extended emission (such as that predicted, Keshet et al. (2002)), will be suppressed relative to at small angles - but should still agree at larger scales.
Our measured agrees reasonably well with previous measurements of the Abell cluster angular auto-correlation (Postman, Geller, & Huchra, 1986) which follows an approximate relationship. We have not included any selection bias correction in calculating in order to compare directly with . We also note that neither (before renormalizing) or drop to zero by . For this annulus, and 447 clusters in deg2, if the clusters were uniformly distributed then each data pixel would be sampled several times, and should equal zero. However, as illustrates, the clusters are not uniformly distributed. In fact they tend to trace the Super-Galactic Plane which is contiguous across our entire map regions.
In Figure 9 the results for the richest () subset of clusters are plotted together with the renormalized cluster-cluster correlation determined directly from the catalog, before and after smoothing with the energy weighted EGRET ( MeV) PSF (Esposito et al., 1999). We have renormalized to the annular bin of , where we expect agreement. We also plot the MeV EGRET PSF for illustration.
Although the corrected and are broadly similar in shape, there is clear evidence for a flatter slope in . In particular, at scales less than is significantly lower than . At larger scales () both functions are less statistically significant. The results summarized in Figure 9 are consistent with non-pointlike cluster gamma-ray emission extending to some . We discuss this result in the context of theoretical predictions in §6.
5 Constraints on clusters and the EGRB
The basic theoretical predictions for the IGM origin of the EGRB from Loeb & Waxman (2000) are summarized in Eqns 1 & 2. Approximately 80-90% of the EGRB is predicted to be due to IGM emission. The remaining fraction can be ascribed to a population of point sources (Chiang & Mukherjee, 1998). The more recent work of Keshet et al. (2002) agrees closely with these semi-analytic predictions, but differs when a numerical cosmological simulation is utilized (see below).
Equation 1 is the predicted spectral intensity of the EGRB ( eV) due to upscattered CMB photons from relativistic electrons (Lorentz factors ) produced in IGM shocks.
| (1) |
where is the fraction of shock thermal energy transferred to relativistic electrons, is the cosmological baryon density parameter, is the Hubble constant in units of km s-1 Mpc-1, and is the fraction of baryons shocked to a mass-weighted temperature (Loeb & Waxman, 2000). The value of is obtained from non-relativistic collisionless shocks in the ISM (SNe) and, as described in §1, may actually range from 1-10% (Waxman & Loeb, 2000; Keshet et al., 2002). From cosmological hydro-dynamical simulations (e.g., Cen & Ostriker (1999)).
Using a hydro-dynamical cosmological simulation, Keshet et al. (2002) find an which is lower than the above semi-analytic, Press-Schechter-based prediction. The spectrum has a varying slope with energy and the amplitude varies from 50-160 eV s-1 cm-2 sr-1, in contrast to the 1100 eV in Equation 1. Consequently their prediction is that only % of the EGRB is due to the IGM. Keshet et al. (2002) attribute this primarily to a lower present-day gas temperature found in the simulation.
Equation 2 is the predicted non-thermal bolometric luminosity for massive clusters of galaxies, again due to CMB upscatter from the accretion shocks surrounding these systems. For a forming massive cluster (Waxman & Loeb, 2000; Keshet et al., 2002);
| (2) |
where is the time taken for gas to cross the cluster virialization shock or equivalently, a measure of the transience of the gamma-ray emission; and are the thermal gas temperature and mass respectively in a cluster. Both Equation 1 and 2 assume a cosmology with , , and ). With a slightly different cosmology (Keshet et al 2002) where , , and , very similar amplitudes, of and are determined for Equations 1 & 2 respectively.
We shall use the excess emission associated with clusters as measured in the innermost (1∘) bin; ph s-1 cm-2 sr-1 ( MeV, Figure 4). This corresponds to the 68% flux enclosure of the EGRET PSF, and can therefore be considered as a conservative choice. Relative to our Galactic model subtracted data this represents a % fluctuation above the mean diffuse background, and corresponds to a mean cluster flux in a radius aperture of photons s-1 cm-2 (MeV).
First we estimate the gamma-ray, or non-thermal, luminosity implied for a rich cluster of galaxies. Converting our photon count rate into flux (assuming an spectrum), we obtain erg s-1 cm-2 ( MeV). To estimate the bolometric gamma-ray flux we then apply a simple correction term. We assume that the emission spectrum is close to an power law and that the emissivity runs from eV to TeV. The upper limit of the EGRET sensitivity is GeV; thus, correcting for the missing lower and higher energy flux we obtain . We note that at TeV, pair production cascades should effectively cut off the spectrum. Assuming a mean redshift of derived for clusters, and we arrive at an estimated mean luminosity of:
| (3) |
For our purposes this is fairly robust. Below we discuss the implications of our measured .
The local () space density of rich clusters is reasonably well known e.g., De Propris et al. (2002), and for is of the order Mpc-3. Consequently, we can simply derive the local gamma-ray volume emissivity of rich clusters. Assuming no evolution in any properties, we can then integrate the expected contribution of rich clusters to the EGRB from a cosmological volume within . If then we arrive at the estimated surface brightness (bolometric) contribution:
| (4) |
Integrating the spectrum defined by Equation 1 from 30eV to 1TeV we arrive at a net predicted bolometric IGM surface brightness of erg s-1 cm-2 sr-1. Therefore, the measured EGRET flux of rich clusters implies that % of the predicted diffuse IGM may be due to rich clusters with .
Clearly this is modulo many parameters and sources of scatter and should be treated with appropriate caution. If we consider the prediction of the Keshet et al (2002) numerical simulations then this fraction clearly rises to % of the IGM emission. Similarly we have assumed zero evolution in all properties, and that our estimate of is unbiased.
For comparison, as described in §1, the upper limit on emission from the Coma cluster () is ph s-1 cm-2 ( MeV). Following the same procedures this translates to a bolometric luminosity of erg s-1. However, the space density of Coma-like clusters () is only Mpc-3. Consequently only some % of the EGRB IGM component could would be expected to arise from the very richest clusters.
Returning to the prediction of Equation 2, what are the other implications of our measurement? If we assume that we are detecting an actively accreting rich cluster population (i.e., within yr of shock formation), then based on our knowledge of Abell clusters the mean thermal gas temperature of the population is likely to be keV and the typical gas mass is M⊙ (e.g., White, Jones, & Forman (1997). Consequently, evaluating Equation 2 for this population we find that the predicted in in excellent agreement with our measured .
6 Discussion
We have detected evidence of a positive correlation of unresolved gamma-ray emission with clusters of galaxies in the local Universe. The correlation signal is broadly consistent with emission localized within of clusters, and specifically is more strongly correlated with optically rich clusters. There is some evidence that the gamma-ray emission may be more spatially extended up to , or up to Mpc at the mean redshift of rich clusters in the Abell catalog. We suggest that the mean non-thermal luminosity associated with rich clusters is erg s -1 (30eV-1TeV) in the local Universe.
Recent theoretical predictions and modeling have suggested that 10-80% of the EGRB arises from upscattering of CMB photons by relativistic electrons in the large-scale gravitational shocks of the IGM, including clusters. If such models are valid our results suggest that % of this component of the EGRB originates from structures associated with rich clusters with . Specific predictions for the population of clusters alone have estimated a contribution to the EGRB of %, dominated by systems with (Colafrancesco & Blasi, 1998).
Several caveats are worth noting. First, diffuse Galactic gamma-ray emission is very hard to remove, even with the current best model for its distribution. We believe we have accounted for the residual effects of this emission by assessing significance via our Monte Carlo simulations, but it may still introduce systematic errors to our results. Second, we cannot, with these data, prove that the excess emission associated with clusters is not due to some population of discrete sources, themselves positively correlated with clusters, although there is no a priori reason to believe this to be the case. Third, estimating the cluster luminosity by measuring the intensity in the innermost 1∘ bin is likely to be an underestimate, given both the width of the EGRET PSF and the evidence for more extended, correlated, emission. Finally, several potential sources of random error exist serving to increase the uncertainty in quoted numbers - which, therefore, should be considered as broad estimates.
It should also be noted that another possible mechanism for producing non-thermal emission in clusters is synchrotron emission in radio galaxies contained in the clusters, that produce relativistic electrons which then up-scatter to produce the high energy gamma-rays (e.g. Giovannini et al. (1993); Petrosian (2001)). In this case the particles are accelerated in the nucleii of radio galaxies, and this could account for the observed gamma-ray luminosities. In this case, one would expect to see a stronger correlation signal with rich clusters containing radio galaxies. Ledlow & Owen (1995) find that some 79% of Abell clusters have evidence of radio emitting member galaxies (in a statistical subsample of 393 clusters of all richnesses). However, more sophisticated analysis is required owing to the small number of radio surveyed clusters and we will investigate this in an extension to the present work.
As discussed by Colafrancesco & Blasi (1998), Loeb & Waxman (2000), Waxman & Loeb (2000), and Keshet et al. (2002), the appearance of non-thermal emission in IGM/cluster structures is transient, with a timescale of yrs. Therefore the emission disappears almost entirely as soon as there is no strong shocking of gas. If we consider our sample of rich Abell clusters then we know from other wavelengths that the majority of these low- systems are probably in a state closely approximating hydrostatic equilibrium (e.g., the presence of X-ray cooling flows, the nearly isothermal gas, etc.). We can consider two extreme states: either only some, non-equilibrium clusters are gamma-ray bright, or all clusters are close to equilibrium and we are simply seeing the fading emission of an earlier epoch of accretion activity. In the first case we can exploit the fact that a system with an EGRET flux of at least ph s-1 cm-2 (MeV) would be directly detectable in the EGRET map. Given our mean flux of (§5) and a total of 447 rich clusters, we would obtain an equivalent detection if only rich clusters had a flux of and the rest were gamma-ray dark. This would then provide a lower limit to the number of actively accreting clusters in the local Universe, a 2% fraction by number.
Alternatively, if all clusters are assumed to be close to equilibrium with a mean temperature of keV, a mean gas mass M⊙, and, then they are almost exactly as gamma-ray luminous as predicted by Equation 2. This implies that in fact all clusters should have been actively accreting recently, certainly within , and possibly at the present time ().
Even in the low-density simulation of Keshet et al. (2002) it appears to be the case that clusters can have active gamma-ray emission. Semi-analytic predictions for low density cosmologies (, ) also suggest that even at , for massive clusters ( M⊙) several M⊙ in baryons should accrete per yr (Lacey & Cole, 1993). The shock regions may form some 5-10Mpc from the cluster core, creating a gamma-ray ‘ring’ of emission (Keshet et al., 2002). The suggestion of a rather more extended emission pattern from our cross-correlation (Figure 9) supports this scenario. In this case our estimated can be considered a good measure of the typical active non-thermal emission for rich clusters. This would then imply that the efficiency of transfer of energy from the shocks to relativistic electrons is similar to the value of % inferred from non-relativistic shocks in the ISM.
The simulations of Keshet et al. (2002) predict that for , future high resolution gamma-ray telescopes with threshold sensitivities for energies GeV should be able to resolve some gamma-ray halos associated with large scale structures. The prospect of direct detection of gamma-ray sources with emission attributed to intergalactic shocks with GLAST, VERITAS, HESS, MAGIC, or other atmospheric Cherenkov telescopes is an exciting one. Such gamma-ray halos could be a new source class of high energy sources waiting to be discovered. Their existence would allow an entirely new, and direct, probe of structure formation processes, leading to an improved understanding of inter- and intra-cluster gas dynamics, magnetic fields, and energy partitioning. While extrapolations from EGRET data and simulations for future instruments predict at least a dozen or more detectable sources (Keshet et al., 2002), direct determination of gamma-ray sources due to shocks can be used as an independent calibration for . In fact, if the value of were lower than the inferred 5% (see discussion above), this would have an impact on the number of sources resolvable by future telescopes. Keshet et al. (2002) predict that the number drops to for . GLAST will have the spectral and spatial resolution to confirm whether galaxy clusters can be directly detected in gamma-rays.
References
- Abell, Corwin, & Olowin (1989) Abell, G. O., Corwin, H. G., & Olowin, R. P. 1989, ApJS, 70, 1
- Bahcall & Soneira (1983) Bahcall, N. A. & Soneira, R. M. 1983, ApJ, 270, 20
- Cen & Ostriker (1999) Cen, R. & Ostriker, J. P. 1999, ApJ, 514, 1
- Chiang & Mukherjee (1998) Chiang, J., & Mukherjee, R., 1998, 496, 752.
- Colafrancesco & Blasi (1998) Colafrancesco, S. & Blasi, P. 1998, Astroparticle Physics, 9, 227
- Colafrancesco (2002) Colafrancesco, S. 2002, åin press, astro-ph/0203443
- Dar & Shaviv (1995) Dar, A. & Shaviv, N. J. 1995, Physical Review Letters, 75, 3052
- De Propris et al. (2002) De Propris, R. et al. 2002, MNRAS, 329, 87
- Ebeling et al. (1998) Ebeling, H., Edge, A. C., Bohringer, H., Allen, S. W., Crawford, C. S., Fabian, A. C., Voges, W., & Huchra, J. P. 1998, MNRAS, 301, 881
- Ebeling et al. (2000) Ebeling, H., Edge, A. C., Allen, S. W., Crawford, C. S., Fabian, A. C., & Huchra, J. P. 2000, MNRAS, 318, 333
- Ensslin, Biermann, Kronberg, & Wu (1997) Ensslin, T. A., Biermann, P. L., Kronberg, P. P., & Wu, X. 1997, ApJ, 477, 560
- Esposito et al. (1999) Esposito, J. A. et al. 1999, ApJS, 123, 203.
- Giovannini et al. (1993) Giovannini, G., Feretti, L., Venturi, T., Kim, K.-T., & Kronberg, P. P. 1993, ApJ, 406, 399
- Hartman et al. (1999a) Hartman, R. C. et al. 1999, VizieR Online Data Catalog, 212, 330079
- Hartman et al. (1999b) Hartman, R. C. et al. 1999, ApJS, 123, 79
- Hunter et al. (1997) Hunter, S. D. et al. 1997, ApJ, 481, 205
- Jahoda, Mushotzky, Boldt, & Lahav (1991) Jahoda, K., Mushotzky, R. F., Boldt, E., & Lahav, O. 1991, ApJ, 378, L37
- Kanbach et al. (1988) Kanbach, G. et al. 1988, Space Science Reviews, 49, 69
- Keshet et al. (2002) Keshet, U., Waxman, E., Loeb, A., Springel, V., Hernquist, L. 2002, astro-ph/0202318
- Lacey & Cole (1993) Lacey, C. & Cole, S. 1993, MNRAS, 262, 627
- Lahav et al. (1993) Lahav, O. et al. 1993, Nature, 364, 693
- Ledlow & Owen (1995) Ledlow, M. J. & Owen, F. N. 1995, AJ, 109, 853
- Loeb & Waxman (2000) Loeb, A., & Waxman, E., 2000, Nature, 405, 156
- Miyaji, Lahav, Jahoda, & Boldt (1994) Miyaji, T., Lahav, O., Jahoda, K., & Boldt, E. 1994, ApJ, 434, 424
- Mücke & Pohl (2000) Mücke, A. & Pohl, M. 2000, MNRAS, 312, 177
- Padovani, Ghisellini, Fabian, & Celotti (1993) Padovani, P., Ghisellini, G., Fabian, A. C., & Celotti, A. 1993, MNRAS, 260, L21.
- Petrosian (2001) Petrosian, V. ; 2001, ApJ, 557, 560
- Pohl & Esposito (1998) Pohl, M. & Esposito, J. A. 1998, ApJ, 507, 327.
- Postman, Geller, & Huchra (1986) Postman, M., Geller, M. J., & Huchra, J. P. 1986, AJ, 91, 1267
- Reimer (1999) Reimer, O., 1999, proceedings of 26th ICRC, OG 2.4.15., vol 4, p89, Eds: D. Kieda, M. Salamon, & B. Dingus.
- Romani & Maoz (1992) Romani, R. W. & Maoz, D. 1992, ApJ, 386, 36
- Sreekumar et al. (1996) Sreekumar, P. et al. 1996, ApJ, 464, 628
- Sreekumar et al. (1998) Sreekumar, P. et al. 1998, ApJ, 494, 523
- Stecker & Salamon (1996) Stecker, F. W. & Salamon, M. H. 1996, ApJ, 464, 600
- Stecker & Salamon (2001) Stecker, F. W. & Salamon, M. H. 2001, astro-ph/0104368
- Strong, Moskalenko, & Reimer (2000) Strong, A. W., Moskalenko, I. V., & Reimer, O. 2000, ApJ, 537, 763.
- Thompson et al. (1993) Thompson, D. J. et al. 1993, ApJS, 86, 629
- Totani & Kitayama (2000) Totani, T. & Kitayama, T. 2000, ApJ, 545, 572.
- Waxman & Loeb (2000) Waxman, E. & Loeb, A. 2000, ApJ, 545, L11
- White, Jones, & Forman (1997) White, D. A., Jones, C., & Forman, W. 1997, MNRAS, 292, 419