HST/STIS Observations of the Bipolar Jet from RW Aurigae: Tracing Outflow Asymmetries Close to the Source1
Abstract
We have observed the bipolar jet from RW Aur A with STIS on board the HST. After continuum subtraction, morphological and kinematic properties of this outflow can be traced to within 01 from the source in forbidden emission lines. The jet appears well collimated, with typical FWHMs of 20 to 30 AU in the first 2′′ and surprisingly does not show a separate low-velocity component in contrast to earlier observations. The systemic radial outflow velocity of the blueshifted lobe is typically 50% larger than that of the redshifted one with a velocity difference of about 65 km s-1 . Although such asymmetries have been seen before on larger scales, our high spatial resolution observations suggest that they are intrinsic to the “central engine” rather than effects of the star’s immediate environment. Temporal variations of the bipolar jet’s outflow velocities appear to occur on timescales of a few years. They have combined to produce a 55% increase in the velocity asymmetry between the two lobes over the past decade. In the red lobe estimated mass flux and momentum flux values are around one half and one third of those for the blue lobe, respectively. The mass outflow to mass accretion rate is 0.05, the former being measured at a distance of from the source.
1 Introduction
Although there have been many studies of the propagation of outflows from young stars (e.g. see the reviews in Protostars and Planets IV) relatively little is known, from an observational perspective, about their generation (Eislöffel et al., 2000). A major problem is that the source itself is often embedded at optical/near-infrared wavelengths making high resolution observations, except in the radio band, impossible. That said, there are a number of optically visible young stars associated with outflows. Although their outflows are not as striking as those from more embedded young stars, such systems nevertheless represent the best window on the “central engine” that we have. With these ideas in mind, we have embarked on a Hubble Space Telescope (HST) program to examine outflows close to a small number of optically visible young stars (Bacciotti et al., 2000) including the subject, RW Aur, of this Letter.
RW Aur (HBC 80, HIP 23873) is a member of the Taurus-Auriga star forming region. It is a binary system with RW Aur B located at a position angle of and a projected separation of with respect to RW Aur A (Leinert et al., 1993). Taurus-Auriga is usually assumed to have a distance of 140 pc (e.g. Wichmann et al. 1998). In contrast the Hipparcos distance of RW Aur is but, as RW Aur is a close binary, and variability shifts the system’s photocentre, the latter distance has been questioned (Bertout, Robinchon, & Arenou 1999). Here, we will assume 140 pc but one should keep in mind that this system may be closer. RW Aur A is one of the optically brightest T Tauri stars in the sky with V = 10.1 mag (Herbig & Bell, 1988). The presence of strong H emission (EW[H] = 84 Å, Herbig & Bell 1988) and high veiling at near-infrared wavelengths (Folha & Emerson 1999) categorise it as a classical T Tauri star (CTTS) with active accretion.
As is usual with CTTSs, accretion is accompanied by outflow: Hirth et al. (1994) first discovered an asymmetric bipolar jet (HH 229) from RW Aur A using long-slit spectroscopy and found that the blueshifted and redshifted jets on extended scales differed in absolute systemic velocity by a factor of two. Another unusual property of this bipolar outflow is that the brighter lobe (in the red [SII] doublet) is redshifted. A detailed analysis of the spectroscopic data of Hirth et al. (1994) is presented in Bacciotti, Hirth, & Natta (1996) who showed that the redshifted jet from RW Aur A also has a low ionization fraction. Further observations by Mundt & Eislöffel (1998) of the area surrounding this star revealed that its flow is much more extensive than previously thought (with a total size of at least ) while Dougados et al. (2000) examined the bipolar jet close to RW Aur A using adaptive optics.
Here we report on multiple observations with the Space Telescope Imaging Spectrograph (STIS) of the bipolar jet from RW Aur A, which allow us to spatially resolve the jet not only along the outflow direction but transversely as well. This is the first bipolar YSO jet to be studied with STIS so close to its origin. Brief observational details are given in Section 2 and our results are presented in Section 3.
2 Observations and data reduction
The HST/STIS observations were made on 10th December 2000. Observing and data reduction procedures were virtually identical to those employed for DG Tau (Bacciotti et al., 2000). Briefly, our seven STIS spectra of the RW Aur flow, taken with the G750M grating, included the brightest forbidden emission lines (FELs), [OI]6300,6363, [NII]6548,6583, [SII]6716,6731 along with H. However, highly blueshifted (v km s-1 ) [OI] 6300 emission was not recorded due to operating restrictions in the choice of STIS central wavelengths. The slit aperture was 520.1 arcsec2, while the spectral scale was 0.554 Å pixel-1. The nominal spatial sampling was 005 pixel-1, with an instrumental angular resolution of about 01 (FWHM) in the red. The slit was kept parallel to the blueshifted outflow axis (P.A. 130°), and offset to the southwest and northeast of the jet axis (corresponding to left and right respectively in the accompanying figures) in steps of 007, for a total coverage in the transverse direction to the jet of about 05. The slit was peaked on source before offsetting. Since the position angle of the slit is roughly perpendicular to that of RW Aur B, the presence of this companion does not affect our observations.
We began our data reduction using the pipeline spectra employing the most recent calibration files. After median filtering hot and dark pixels, the continuum contribution from RW Aur A (and its associated reflection nebula) was carefully removed. Very close to the star (i.e. less than 01) the continuum subtraction is critical. Despite this, the jet can be traced to at least 01 from RW Aur A in [OI] and [SII]. For smaller separations there is no observed forbidden line emission above the continuum. This lack of emission is almost certainly caused by line quenching effects close to the star as in the case of DG Tau (Bacciotti et al., 2000).
Combining the spectra taken in the seven slit positions we formed images of the flow (“channel maps”) in eight broad velocity bins for the lines mentioned above. The total velocity range covered is approximately -300 km s-1 to +300 km s-1 which is split up into bins of km s-1 (3 pixels). All velocities are quoted with respect to the mean heliocentric velocity for RW Aur A of +16 km s-1 reported by Petrov et al. (2001) and based on high velocity resolution echelle data. In this Letter we present interesting and surprising results about the morphology and kinematics of the jet derived from the STIS spectra. The spatial distribution of physical parameters such as ionisation, hydrogen density or electron temperature, calculated from line ratios using a diagnostic code, will be the subject of another paper (Bacciotti et al. 2002, in preparation).
3 Results and Discussion
As examples of the derived channel maps we show [SII] (Fig. 1), [OI]6300,6363 (Fig. 2) and [NII] (Fig. 3). Fig. 1 also contains estimates of the electron density derived from the line ratio of the red [SII] doublet (Osterbrock, 1989). The morphology of the jet looks quite similar in the other lines, except for H as discussed below. Our observations provide the first set of spectra of the RW Aur A jet with sub-arcsecond resolution. Compared to the previous study of Hirth et al. (1994), the spatial resolution is enhanced by an order of magnitude. Dougados et al. (2000) provided images of the jet at 01 angular resolution using adaptive optics and image deconvolution. They did not detect, however, jet emission closer than about 04 from the source. As we can trace the redshifted jet to within approximately 15 AU () from the source in the FELs, this is also an upper limit for the projected radius of any opaque disk around RW Aur A. By implication such a disk is either seen almost edge-on or has a radius much less than 100 AU i.e. the usually assumed size of a CTTS disk (e.g. Hartmann 1998). The latter could be the result of close encounters with RW Aur B which, although currently separated from RW Aur A by at least 200 AU, may have an excentric orbit. We estimate the jet inclination angle with respect to the line of sight from a comparison of our channel maps with the images taken by Dougados et al. (2000) in Dec 1997. If the jet knot at detected by Dougados et al. (2000) in [OI] and [SII] corresponds to the structure that we find at for intermediate velocities in the red lobe (marked with an ‘A’ in Figs. 1 and 2), this indicates a tangential velocity km s-1 . If we assume this is not a “pattern speed” we can combine it the with radial velocity km s-1 for the same knot derived from our spectrum to deduce . We do not attempt to measure proper motions for the knots closer to the source, because the currently observed velocity differences between knots (see below) imply their morphology may have altered significantly (due to, for example, knot merging) since the Dougados et al. (2000) observations. Given this, our value for should be regarded as a rough estimate. In any event even if the observed tangential velocity is a pattern speed it is still a lower limit for the actual gas tangential speed (Eislöffel & Mundt 1998) and so it seems justified to assume .
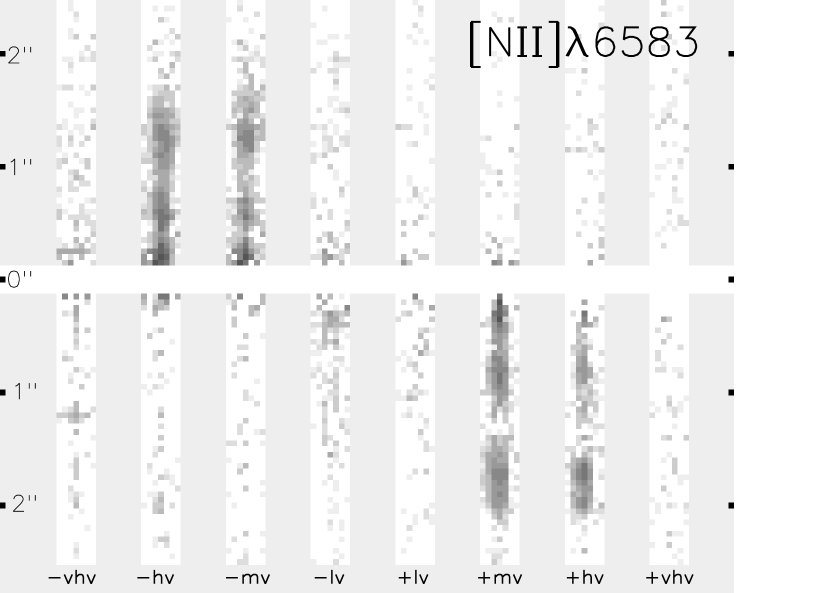
A comparison of the forbidden line emission in the different lines shows that the [OI] emission appears stronger closer to the source than the [SII] emission. As pointed out by Shang et al. (2002) this is basically because hot dense regions contribute more to the integral line of sight emissivity than cooler tenuous ones close to the star. In particular, although the electron density varies between and along the jet beam, it increases dramatically close to the source. This makes the [OI] lines brighter than the [SII] lines at , since the critical density for [OI]6300,6363 is higher than that for the [SII] doublet. Contrary to the DG Tau case (Bacciotti et al., 2000), is higher for moderate velocities in the red lobe. In the blue lobe, however, the highest density is found for the high velocity bin. The jet is rather faint in [NII] emission (Fig. 3) in comparison to the other FELs, and particularly with respect to [OI]6300. This points towards a low ionisation fraction in the observed portions of the jet, in agreement with results from previous diagnostic studies conducted at lower angular resolution (Bacciotti et al. 1996; Dougados, Cabrit, & Lavalley-Fouquet 2002). Also, the [NII]/[OI] and [SII]/[OI] ratios are similar in the red and blue lobes, which indicates similar ionization and excitation levels (Bacciotti & Eislöffel, 1999).
Both the blue and redshifted jets appear well collimated (see Fig. 4, top panel). The convolved redshifted jet width (FWHM, measured in both [SII]6731 and [OI]6300 by binning together intermediate velocities) increases from 01 close to the source to 02 at 2′′. In agreement with the determinations of Dougados et al. (2000), this suggests that the full redshifted jet opening angle (averaged over the corresponding projected distance) is less than 6. Here we also show that similar behaviour is observed for the blueshifted jet, and that neither the red- or blue-shifted jets are well-resolved transversely at distances less than approximately 40 AU from RW Aur A. This implies a jet diameter in this region of less than 15 AU. For both the blue and red lobe the values plotted in Fig. 4 are marginally consistent with those obtained from the X-wind model (see, for example, Shang et al. 2002) and from self-similar magnetised disk wind models (Garcia et al., 2001), although for the latter only with high accretion efficiencies. The corresponding low accretion efficiency disk wind model is expected to have even larger opening angles than observed (Garcia et al., 2001). Such a model might be appropriate for the DG Tau jet, whose jet width (FWHM) values, obtained from STIS data, are also shown for comparison in Fig. 4 (top panel). The figure also suggests that the electron density is typically higher closer to the jet axis, as the FWHM widths measured in [OI] are almost everywhere smaller than the corresponding [SII] values. This statement is in agreement with most models of jet acceleration. Also, rather than having a constant opening angle, the jets from RW Aur A appear to expand more rapidly closer to the source (within 05) than further away. Such behaviour was in fact suggested by groundbased observations over a decade ago (e.g., Mundt, Ray, & Raga 1991) and seems to be supported by subsequent HST measurements (e.g., Hester, Stapelfeldt, & Scowen 1998, Reipurth et al. 2000). As pointed out for example by Reipurth & Bally (2001) it is not clear how to interpret such results: the observed jet widths may represent the extent of bow shock wings and the true jets could be much narrower. We also note that farther than 05 from the source there are indications for an anticorrelation between jet width and intensity, as already observed in HST images of the HH 34 jet (Ray et al. 1996).
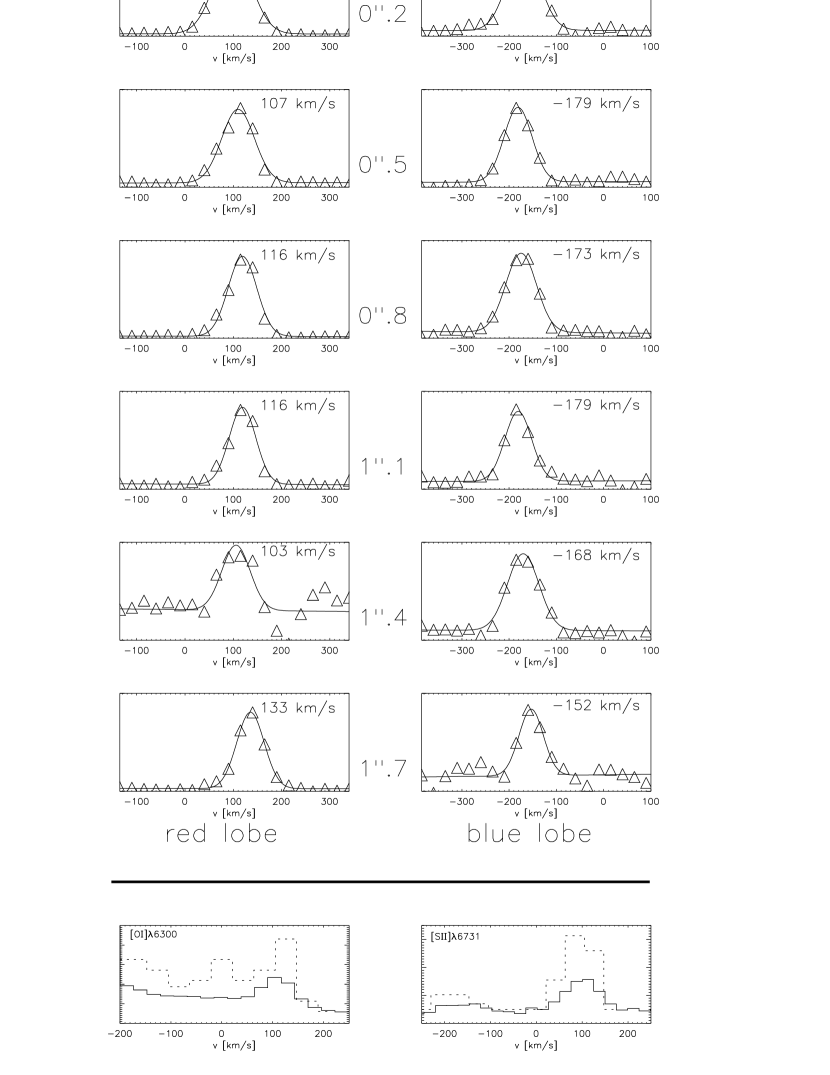
In Fig. 5 we present the [SII]6731 line profiles at selected positions along the central slit for both the blue and red lobes. A Gaussian fit has been applied to find the centre. Since the line profiles are in fact close to Gaussian and the residuals of the fit are only a few percent, the errors in the peak velocities will not be larger than 5 km s-1 . Over the whole range of separations covered by our observations the velocity profiles of the lines only show one velocity peak at km s-1 in the redshifted lobe or km s-1 in the blueshifted lobe. In many CTTS, however, and in addition to this high velocity component (HVC), the forbidden line emission has another component, the so-called low-velocity component (LVC) having typical radial velocities of to km s-1 (e.g., Hirth, Mundt, & Solf 1997) and a luminosity correlated with that of the HVC (Calvet, 1997). Kwan & Tademaru (1988, 1995) have proposed that the LVC is the signature of a poorly collimated disk wind while the HVC is a collimated jet close to the star. In the case of RW Aur, LVC emission was detected by Hartigan, Edwards, & Ghandour (1995) and Hirth et al. (1997) in the [OI]6300 line. Based on observations performed in November 1993, Hirth et al. (1997) measured an equivalent width ratio EW(LVC)/EW(HVC) = 0.14. This is approximately in line with the correlation found by Calvet (1997) according to which the LVC flux for the [OI]6300 line should be of the observed HVC flux. Although such an LVC would be easily detectable in our STIS data, it is not present. To further illustrate this point we have also spatially summed up our [OI]6300 and [SII]6731 line profile data 05 either side of the peak stellar continuum position. The resultant line profiles are shown in the upper panel of Fig. 5 where they are compared with the corresponding profiles obtained by Hartigan et al. (1995). The current lack of LVC emission is evident and indicates temporal variability on a timescale of a few years, as found by Solf (1997) for the DG Tau outflow. In the context of the Kwan & Tademaru model this means that the RW Aur A disk wind (like the jet component) is variable, perhaps as a result of magnetic instabilities (Goodson, Böhm, & Winglee 1999). We also note that the absence of an LVC in RW Aur A is in line with recent [FeII] 1.64m observations by Davis et al. (2002). The lower panel of Fig. 5 shows that the LVC was not observed by either Hartigan et al. (1995) or ourselves in [SII]6731. As the LVC often has a high electron density, this is not too surprising giving the lower critical density of the [SII]6731 line in comparison with the [OI]6300 line.
In the top panel of Fig. 5 the radial velocity of the blueshifted lobe of the RW Aur A jet is seen to exceed that of the redshifted lobe by a factor of 1.6 or km s-1 . This has already been recognized by Hirth et al. (1994), but only for projected separations from RW Aur A. These authors also mentioned that radial velocity asymmetries in bipolar jets are not unusual and may be explained for example by different pressure gradients on both sides of the source. Using STIS, however we have now shown that this behaviour in the RW Aur A jet appears already at from the star. Therefore, the origin of these velocity asymmetries must be located close to the “central engine” itself. Note also that asymmetries in the excitation and opening angle of the HH 30 bipolar jet were already evident on similar scales in WFPC2 data (Ray et al., 1996; Bacciotti, Eislöffel & Ray, 1999).
As can be seen in Fig. 5, the radial outflow velocity varies between roughly 95 km s-1 and 135 km s-1 in the red lobe and between -150 km s-1 and -180 km s-1 in the blue lobe, in the separation range from to . This could in principle be caused by the slit passing a “wiggling” jet but there is no evidence of wiggling in our data. The position of the jet centre, as derived from Gaussian fits to our velocity channel maps, changes along the jet by less than 002, which is much less than the slit width. In addition, these variations show no correlation with distance from the star, suggesting they are due to temporal variations in outflow velocity. As mentioned above, from a comparison of our channel maps with images of the RW Aur A jet from Dougados et al. (2000) we have estimated a jet knot proper motion of . This implies that the observed velocity variations occur on a timescale of 1–3 years. The knots of the RW Aur A jet may thus be “internal working surfaces” produced by variations in the outflow ejection properties as seen, for example, in the simulations of de Gouveia Dal Pino & Benz (1994).
The ratio generally decreases from 1.75 at to 1.14 at . Under the assumptions discussed above this means that the velocity asymmetry increased in the last decade by about 55%. Such variations have not been reported in the past for any bipolar YSO jet and, as far as we are aware, this is the first time temporal evolution of bipolar jet asymmetry has been observed.
For both the red and the blue lobe we have estimated the mass and momentum fluxes in the jet at the distances from the source quoted in Fig. 5. Towards this aim, we used our determinations of velocity, inclination angle, electron density and jet width (FWHM), combining them with the estimates of the hydrogen ionization fraction in Dougados, Cabrit, & Lavalley Fouquet (2002). The latter is reported to vary between 0.007 and 0.09 between 04 and 17 in the redshifted jet, and we have assumed that the ionization fraction in the blue lobe has the same values. As already mentioned, this statement is supported by the similarity of the [NII]/[OI] ratio observed along the two lobes. We take as the dynamical diameter of the jet the measured FWHM, and a constant space velocity over the jet transverse section. The first assumption may lead to underestimating the fluxes, if the peripheral regions of the flow are too cold to be observable, but the second hypothesis should counter-balance the effect, since according to theoretical models the colder external regions are moving more slowly. Our results are summarized in Fig. 4, bottom panels. We find that in the blue lobe varies from M⊙ yr-1 at 035 from the source to M at 15, while within the same range varies from to M⊙ yr-1 km s-1. In the red lobe the values for and are typically one half and one third of those in the blue lobe, respectively. In both lobes, the fluxes are seen to decrease by about an order of magnitude in less than 2′′ from the source. If the knots represent mini-working surfaces, this finding might be justified by the fact that a considerable fraction of the jet material is pushed sideways. Alternatively, the calculation might be affected from the fact that the jet is less and less excited moving away from the source, and the measured FWHM becomes indeed substantially smaller than the jet dynamical diameter. The mass accretion flux for this star is 1.6 10-6 M⊙ yr-1 (Hartigan, Edwards, & Ghandour, 1995), thus averaging over the two lobes one finds / 0.05 close to the source, which is in line with theoretical predictions of jet-launching models. Although the origin of the blue/red asymmetries remains unknown, one might ask if the observed imbalance between the momentum fluxes in the two lobes may cause dynamical effects on the overall system. We have calculated that if such imbalance persisted for all the pre-main sequence lifetime of this star, it should have caused a recoil (space) velocity of 8 km s-1 or less for the system. This value, on the other hand, is probably itself a gross overestimate because (a) RW Aur has already accreted most of the its mass and it may have acquired this material in a more symmetrical way, (b) over time linear momentum balance may be maintained.
As a final remark, we mention that in H the appearance of the region close to the source largely differs from the FELs. The H emission can be traced back to the stellar position in both lobes, and there are two H velocity peaks on the star with the same velocities as the blue- and redshifted lobes of the jet, suggesting that we are tracing them back to their source. It has been claimed (see, for example, Hartmann 1998) that H emission is not only a tracer of outflow but of inflow as well. In particular accreted material, channelled into funnel flows by the stellar magnetic field, may contribute to the H line profile. We do not see any evidence for such a contribution here.
4 Conclusions
We have obtained spectra of the bipolar jet of RW Aur A at an unprecedented high spatial resolution of 01 and for the first time studied its morphological and kinematic properties within one arcsecond from its origin. Both outflow lobes can be traced as close as 01 from the source in the FELs. In H the STIS spectra show two strong maxima on the star with radial velocities coinciding with those of the two outflow lobes. The jet appears well collimated very close to its origin and aymmetries in the red- and blueshifted lobe velocities arise within a region smaller than 20 AU from the source. This scale is almost certainly a conservative estimate as our values for the jet inclination angle to the line of sight and distance to RW Aur are lower and upper limits respectively.
In contrast to previous observations we do not find a separate low velocity outflow component, which indicates this feature is variable on timescales of a few years. If this component is a disk wind, then our observations imply such winds vary on similar timescales as the higher velocity outflow and may also be episodic. Variations in the high velocity components in the RW Aur A jet suggest that its knots may be internal working surfaces. This is also supported by our estimates of the mass and momentum fluxes, which in both lobes are observed to decrease by at least an order of magnitude within the first 2′′ from the source. Close to the star we find an average mass flux of about 8.5 10-8 M⊙ yr-1, which is about 5% of the mass accretion flux. The mass flux and momentum flux values in the red lobe are typically one half and one third of the values in the blue lobe, respectively. Finally we note that velocity variations in the blue- and redshifted lobes imply an increase in the radial velocity asymmetry of about 55% over the last decade.
References
- Bacciotti, Hirth, & Natta (1996) Bacciotti, F., Hirth, G. A., & Natta, A. 1996, A&A, 310, 309
- Bacciotti & Eislöffel (1999) Bacciotti, F. & Eislöffel, J., 1999, A&A, 342, 717
- Bacciotti, Eislöffel & Ray (1999) Bacciotti, F., Eislöffel, J., & Ray, T.P. 1999, A&A, 350, 917
- Bacciotti et al. (2000) Bacciotti, F., Mundt, R., Ray, T.P., Eislöffel, J., Solf, J., & Camenzind, M. 2000, ApJ, 537, 49
- Bertout et al. (1999) Bertout, C., Robinchon, N., & Arenou, F. 1999, A&A, 352, 574
- Calvet (1997) Calvet, N. 1997, Proceedings of IAU Symposium 182, 417
- Davis et al. (2002) Davis, C.J., Whelan, E., Ray, T.P., & Chrysostomou, A. 2002, in preparation
- Dougados et al. (2000) Dougados, C., Cabrit, S., Lavalley, C., & Ménard, F. 2000, A&A, 357, L61
- Dougados, Cabrit, & Lavalley Fouquet (2002) Dougados, C., Cabrit, S., & Lavalley-Fouquet, C. 2002, Revista Mexicana de Astronomia y Astrofisica Conference Series, 13, 43
- Eislöffel & Mundt (1998) Eislöffel, J., & Mundt, R. 1998, AJ, 115, 1554
- Eislöffel et al. (2000) Eislöffel, J., Mundt, R., Ray, T. P., & Rodríguez, L. F. 2000, Protostars and Planets IV, 815
- Folha & Emerson (1999) Folha, D.F.M., & Emerson, J.P. 1999, A&A, 352, 517
- Garcia et al. (2001) Garcia, P. J. V., Cabrit, S., Ferreira, J., & Binette, L. 2001, A&A, 377, 609
- Goodson et al. (1999) Goodson, A. P., Böhm, K. H., & Winglee, R. M. 1999, ApJ, 524, 142
- de Gouveia Dal Pino & Benz (1994) de Gouveia Dal Pino, & E.M., Benz, W. 1994, ApJ, 435, 261
- Hartigan, Edwards, & Ghandour (1995) Hartigan, P., Edwards, S., & Ghandour, L. 1995, ApJ, 452, 736
- Hartmann (1998) Hartmann, L., 1998, Accretion Processes in Star Formation (Cambridge, UK: Cambridge University Press)
- Herbig & Bell (1988) Herbig, G.H., & Bell, K.R. 1988, Lick Obs. Publ., 1111
- Hester, Stapelfeldt, & Scowen (1998) Hester, J. J., Stapelfeldt, K. R., & Scowen, P. A. 1998, AJ, 116, 372
- Hirth et al. (1994) Hirth, G. A., Mundt, R., Solf, J., & Ray, T. P. 1994, ApJ, 427, L99
- Hirth et al. (1997) Hirth, G. A., Mundt, R., & Solf, J. 1997, A&AS, 126, 437
- Kwan & Tademaru (1988) Kwan, J., & Tademaru, E. 1988, ApJ, 332, L41
- Kwan & Tademaru (1995) Kwan, J., & Tademaru, E. 1995, ApJ, 454, 382
- Leinert et al. (1993) Leinert, Ch., Zinnecker, H., Weitzel, N., Christou, J., Ridgway, S. T., Jameson, R., Haas, M., & Lenzen, R. 1993, A&A, 278, 129
- Mundt & Eislöffel (1998) Mundt, R., & Eislöffel, J. 1998, AJ, 116, 860
- Mundt, Ray, & Raga (1991) Mundt, R., Ray, T. P., & Raga, A. C. 1991, A&A, 252, 740
- Osterbrock (1989) Osterbrock, D.E. 1989, Astrophysics of Gaseous Nebulae and Active Galactic Nuclei, University Science Books, Mill Valley, CA
- Petrov et al. (2001) Petrov, P. P., Gahm, G. F., Gameiro, J. F., Duemmler, R., Ilyin, I. V., Laakonen, T., Lago, M. T. V. T, & Tuominen, I. 2001, A&A, 369, 993
- Ray et al. (1996) Ray, T. P., Mundt, R., Dyson, J. E., Falle, S. A. E. G., & Raga, A. C. 1996, ApJ, 468, L103
- Reipurth & Bally (2001) Reipurth, B. & Bally, J. 2001, ARA&A, 39, 403
- Reipurth et al. (2000) Reipurth, B., Heathcote, S., Yu, K., Bally, J., & Rodríguez, L. F. 2000, ApJ, 534, 317
- Shang et al. (2002) Shang, H., Glassgold, A. E., Shu, F. H., & Lizano, S. 2002, ApJ, 564, 853
- Solf (1997) Solf, J. 1997, Proceedings of IAU Symposium 182, 63
- Wichmann et al. (1998) Wichmann, R., Bastian, U., Krautter, J., Jankovics, I., & Rucińsky, S. M. 1998, MNRAS, 301, L39
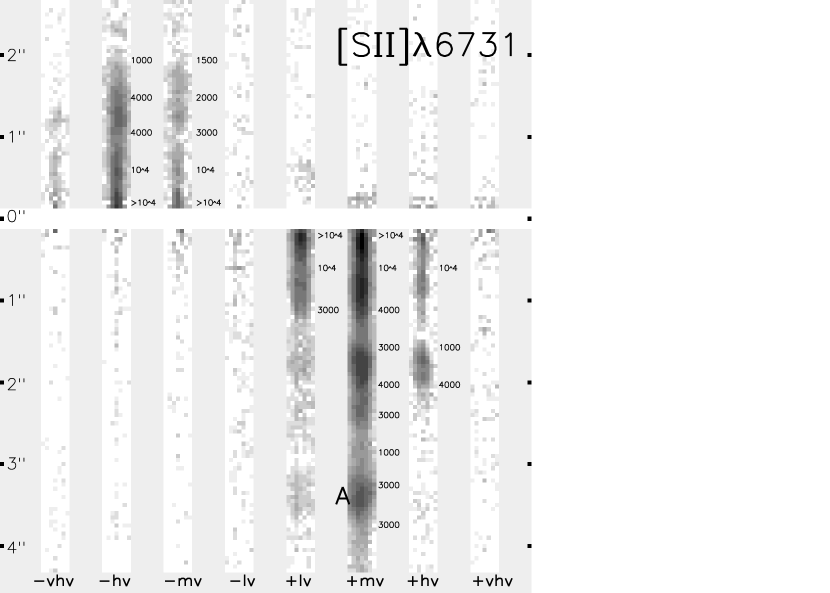
-221 km s-1 to -147 km s-1 (-hv), -147 km s-1 to -73 km s-1 (-mv), -73 km s-1 to +1 km s-1 (-lv), +1 km s-1 to 75 km s-1 (+lv), 75 km s-1 to 150 km s-1 (+mv), 150 km s-1 to 224 km s-1 (+hv), 224 km s-1 to 298 km s-1 (+vhv). The surface brightness is displayed logarithmically from to erg s-1 arcsec-2 cm-2 Å-1. The numeric values are estimates of the electron density derived from the ratio of the [SII] doublet.
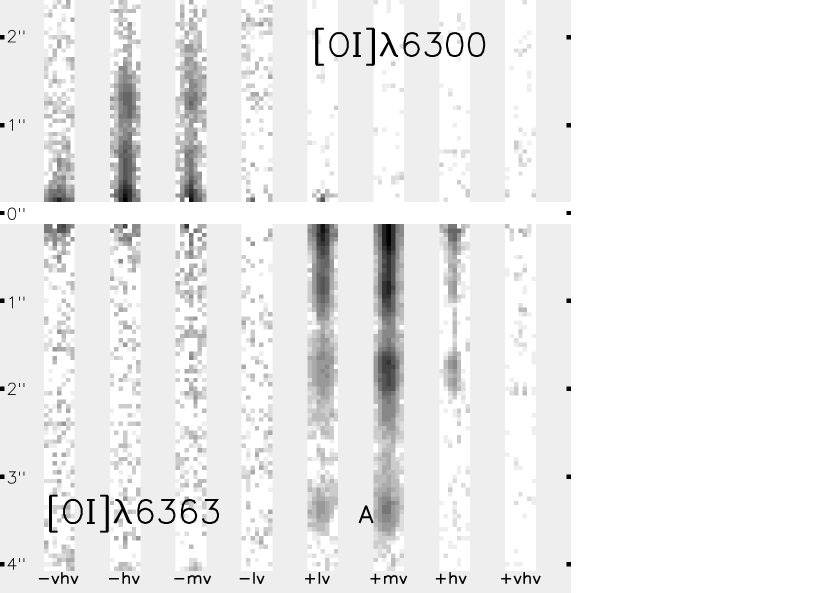
(-vhv), -223 km s-1 to -148 km s-1 (-hv), -148 km s-1 to -72 km s-1 (-mv), -72 km s-1 to
+4 km s-1 (-lv), +4 km s-1 to 79 km s-1 (+lv), 79 km s-1 to 155 km s-1 (+mv), 155 km s-1 to 230 km s-1 (+hv), 230 km s-1 to 306 km s-1 (+vhv). The surface brightness is displayed logarithmically from to erg s-1 arcsec-2 cm-2 Å-1.