A Study of 3CR Radio Galaxies from z = 0.15 to 0.65. II. Evidence for an Evolving Radio Structure
Abstract
Radio morphology data have been collected for a sample of radio galaxies from the Revised 3rd Cambridge (3CR) Catalog in the redshift range . Radio structure parameters including largest physical size, projected bending angle (), lobe length asymmetry () and hot spot placement (Fanaroff-Riley ratio) have been measured from the highest quality radio maps available. Combined with similar data for quasars in the same redshift range, these morphology data are used in conjunction with a quantification of the richness of the cluster environment around these objects (the amplitude of the galaxy-galaxy spatial covariance function, ) to search for indirect evidence of a dense intracluster medium (ICM). This is accomplished by searching for confinement and distortions of the radio structure that are correlated with .
Correlations between physical size and hot spot placement with show evidence for an ICM only at , but there are no correlations at , suggesting an epoch of for the formation of the ICM in these Abell richness class 0-1, FR2-selected clusters. X-ray selected clusters at comparable redshifts, which contain FR1 type sources exclusively, are demonstrably richer than the FR2-selected clusters found in this study. The majority of the radio sources with high values at 0.4 can be described as “fat doubles” or intermediate FR2/FR1s. The lack of correlation between and or and suggests that these types of radio source distortion are caused by something other than interaction with a dense ICM. Therefore, a large cannot be used as an unambiguous indicator of a rich cluster around powerful radio sources. These results support the hypothesis made in Paper 1 that cluster quasars fade to become FR2s, then FR1s, on a timescale of 0.9 Gyrs (for H 50 km s-1 Mpc-1).
1 Introduction
Just as the solar wind was first detected indirectly using comet tails, the intracluster medium (ICM) was first inferred to be present due to the morphology of extended radio sources associated with clusters. Fiducial studies of these cluster radio sources date from the 1970s with the work of Owen (1975), Owen & Rudnick (1976) and Burns, Owen & Rudnick (1979). While some details concerning the exact relationship between the radio galaxy and the ICM which surrounds it are still the subject of some debate (Roettiger, Loken & Burns, 1997; Eilek et al., 1984), all current models for cluster radio source distortion invoke a dense ICM, in an amount consistent with its direct detection via thermal X-ray bremsstralüng (Sarazin, 1986). At low- (0.1) there is a good correlation (but with a large dispersion) between the density of the ICM (as measured by its X-ray emission) and the cluster galaxy density (e.g., Abramopoulos & Ku, 1983; Yee & Ellingson, 2002). However, since galaxies formed before the ICM, and at least partially created it through internal galaxy processes (i.e., supernovae and stellar winds), a cluster with a high galaxy density may not yet have formed a dense ICM at its observed epoch.
While sensitive X-ray observations have discovered and studied the ICM of rich clusters out to 1 (e.g., Gioia & Luppino, 1994; Donahue et al., 1998; Rosati et al., 1998), direct X-ray detection of a cluster ICM around radio galaxies and quasars is made much more difficult because the AGN itself is a strong X-ray emitter. Because quasars and powerful radio galaxies are found in clusters only at higher redshifts (Hill & Lilly 1991, HL hereafter; Ellingson, Yee & Green 1991, EYG hereafter; Harvanek et al. 2001, Paper 1 hereafter), the presence or absence of a dense ICM surrounding luminous AGN in clusters has not been generally established through direct ICM detection (although a few recent detections have been made; see below). Thus, the use of the radio source morphology to trace indirectly the presence (or absence) of a cluster ICM is still an important indirect method.
In general, radio sources associated with AGN can be divided into two basic types based upon morphology and radio power level: Fanaroff-Riley Type 1 and Type 2 (FR1 and FR2; Fanaroff & Riley, 1974). The distorted morphology of the FR1 type radio galaxies indirectly reveals the presence of a dense ICM in current epoch clusters. On the other hand, quasars, which are exclusively FR2 type sources, and powerful FR2 radio galaxies are found in clusters only at 0.2 (HL and Paper 1). The FR classes were originally defined using the distance between the brightest flux points on opposite sides of the radio core divided by the total extent of the source measured from the faintest radio contour. If this ratio of distances (called herein the ratio) is 0.5, the source is classified as an FR1 type. If the ratio 0.5, the source is an FR2. Qualitatively, FR2s have a relatively weak radio core with an extended “lobe” of emission on each side. The lobes tend to be fairly symmetric in both size and luminosity and are usually collinear (i.e., both lobes and the core lie on approximately the same line; although see Stocke, Burns & Christiansen 1985 for examples of “bent” FR2s). The brightest regions of these sources tend to occur at or near the leading edges of the radio lobes and often these sources contain a weak, one-sided jet. In contrast, FR1s are asymmetric and distorted and may bear little resemblance to a double-lobed structure. These sources tend to have bright cores and/or bright, two-sided jets and the extended structure of the source dims with distance from the core. FR2s tend to have a larger physical size than FR1s. Thus, an FR1 type structure is small, distorted, asymmetric, edge-dimmed and (core+jet)-dominated. FR2 type structures tend to be larger, collinear, symmetric, edge-brightened and lobe-dominated. Additionally, sources with 178 MHz radio power W Hz-1 sr-1 are FR1s while those with higher power are FR2s (Fanaroff & Riley, 1974). More recent work on the FR1/FR2 dividing line has found a correlation between the radio power level of the dividing line and the optical host galaxy luminosity, such that more luminous optical galaxies can host more luminous FR1 type sources (Owen & Laing, 1989).
While the exact relationship between FR1s and FR2s remains uncertain, the work of EYG and Paper 1 has found evidence that cluster quasars evolve into radio galaxies by fading to become first FR2s, then FR1s. This “fading AGN” or “evolutionary” hypothesis accounts for the presence of quasars in moderately rich clusters at 0.5 and FR2s in similar richness clusters at 0.25; whereas only FR1s are found in such clusters in the current epoch. The “e-fading” timescale of the optical continuum emission from the AGN core suggested by EYG and Paper 1 is 0.9 Gyrs (H0=50 km s-1 Mpc-1). Since the timescales associated with extended radio source outbursts are thought to be 108 yrs (Begelman, Blandford & Rees, 1984), the radio source power and morphology will “track” the fading of the AGN. By this hypothesis, the ICM surrounding the AGN host plays a significant role in this process (EYG and Paper 1) by affecting the triggering and/or fueling of the AGN (Roos, 1981; Stocke & Perrenod, 1981). This scenario also explains why quasars are found in clusters only at 0.4 (EYG) and only in poorer environments at lower-. However, this hypothesis remains controversial, especially since another hypothesis (Barthel, 1989) relates quasars and FR2 radio galaxies entirely by orientation.
Indeed, there is much support for an “obscuration based unification scheme”, as advocated by Barthel and others (e.g., Antonucci, 1993) in which quasars and radio galaxies are related not by evolution but by viewing angle; i.e., quasars are seen closer to their outflow axis than radio galaxies, causing radio galaxies to be preferentially lower in optical luminosity due to obscuring material perpendicular to the outflow axis. Evidence cited in favor of this hypothesis includes: (1). quasars have systematically smaller (factor of two at a confidence level) extended radio structures on the plane of the sky than radio galaxies at the same redshift and radio power levels (Barthel, 1989); (2). most luminous radio galaxies have only narrow emission lines in their optical spectra while all quasars have broad permitted lines (Antonucci, 1993); (3). some narrow-line radio galaxies have broad permitted lines in polarized light (Antonucci, 1993), including Cygnus A (Ogle et al., 1997) (4). the luminosity of extended [OII] emission is comparable for radio galaxies and quasars with comparable radio power levels (Hes et al., 1996a); and (5). the far-infrared dust emission has comparable luminosities in quasars and radio galaxies at (Meisenheimer et al., 2001). But none of these results are without contradictory (or at least confusing) results from other investigators: (1). many studies on the extended radio size of quasars and radio galaxies have been conducted (see Urry & Padovani, 1985, and references therein) with little agreement. It may be that the redshift range used by (Barthel, 1989) () is the only redshift range for which this test gives results in agreement with the unified scheme (Singal, 1993); (2 & 3). some narrow line radio galaxies at lower redshift have only very weak emission lines (e.g., the “low-excitation” group of Laing et al., 1994) and would be very unlikely to be “hidden quasars”. The absence of luminous emission line gas in many FR2s could be an evolutionary effect since FR1s also have no broad line gas, very little narrow line gas (Owen, Ledlow & Keel, 1996) and no evidence for obscuration (Falcke et al., 1995); (4). the extended [OIII] emission is not comparable for radio galaxies and quasars (Jackson & Browne, 1990). Advocates of unified schemes interpret this to mean that some of the [OIII] emission is obscured in the radio galaxies but not in the quasars, but this was originally taken to provide evidence against the unified hypothesis. Alternately, the [OII] emission, being lower ionization state gas, could be ionized by other sources than the AGN (e.g., star formation); (5). other infrared studies of quasars and radio galaxies in other redshift ranges (Hes et al., 1996b) find more infrared emission from quasars than radio galaxies. Thus, like the extended narrow line gas and the radio source size tests, this test seems to give results that are dependent upon redshift and thus inconclusive support for the unified schemes. So, while there is some significant support for a unified scheme, there seems to be significant contrary evidence as well. And because several of these tests yield different results in different redshift ranges, an evolutionary scenario is suggested.
In this work, we seek to test the evolutionary scenario for quasar fading by searching for indirect evidence of an ICM forming around some of the radio galaxies and quasars studied in Paper 1 using distortions in their extended radio structure. If the evolutionary hypothesis is correct, distorted radio structure will be found only for the lower cluster sources in our sample. We use this indirect methodology because very few high- AGN-selected clusters have been detected directly by extended X-ray emission. Unambiguous detections exist for only five sources in our sample (e.g., Gizani & Leahy, 1999; Hardcastle & Worrall, 1999; Worrall & Birkinshaw, 2001), which are insufficient to draw firm conclusions about the intermediate redshift quasar and FR2 radio galaxy population as a whole.
Several previous studies have been conducted on the relationship between environment and FR type at low and intermediate redshift. In an attempt to determine the relationship between FR1 and FR2 type radio galaxies, Owen & Laing (1989) and Owen & White (1991) examined very low redshift () radio galaxies both in clusters (Owen & White, 1991) and out of clusters (Owen & Laing, 1989). They further subdivided the types of radio structure and found evidence for a third, transitional (FR1/FR2) type, which they refer to as “fat doubles”. The lower power FR1s and the transitional FR1/FR2s were found mostly in clusters while the higher power FR2s were found to avoid clusters. Similar results concerning the effects of environment on radio structure were found earlier by Stocke (1978), Longair & Seldner (1979), Lilly & Prestage (1987), and Prestage & Peacock (1988). In work used by us in Paper 1, HL extended these studies of the environments of FR1 and FR2 radio galaxies to . Their results showed that higher power FR2 radio galaxies are found in richer galaxy environments at higher than at lower , while the lower power FR1s show no change in environment with redshift. Stocke et al. (1999) confirm that FR1s are found in rich clusters with a dense ICM regardless of redshift by observing with the VLA a sample of X-ray selected clusters out to 0.8. While FR1s were found in distant clusters where a dense ICM is demonstrably present, Rector, Stocke & Ellingson (1995) found evidence against the presence of a dense ICM around a sample of quasars (FR2s) at these same redshifts. Because the Rector et al. (1995) work used the same methodology as employed herein, this paper will incorporate and expand upon that work to include both quasars and radio galaxies.
To investigate the evolution of cluster AGN further, in Paper 1 of this series we conducted an optical imaging study for a large sample of 3CR/FR2 radio galaxies at 0.150.65, quantifying cluster richness for a very large percentage of the sample using the Bgg formalism (see e.g., EYG). While most FR2s imaged in Paper 1 have B500Mpc1.77 (Abell richness class 0), a comparable percentage (25%) of all FR2s studied at =0.15-0.65 are in richer environments (Bgg= 500-1200 Mpc1.77 or Abell class 0-1). From that study we concluded that the cluster richness data offer significant evidence against the Barthel (1989) hypothesis that quasars are “beamed” or less-obscured radio galaxies, since many FR2 radio galaxies were found in clusters at epochs 0.150.45 when no quasars are found in clusters. Further, the cluster FR2s in this redshift range provide the “missing link” between cluster quasars at 0.5 and cluster FR1s in the current epoch. In Paper 1 we interpreted the result that FR2s are found in clusters in the past but not in the present epoch as evidence for an evolving ICM in these AGN-selected clusters. The fading of both the AGN optical brightness and the radio power (and its associated morphological changes) are suggestive of evolution between the types of radio galaxies themselves. That is, Paper 1 suggests that quasars at 0.5 fade to become FR2 radio galaxies at 0.25 and then FR1s at 0 on an “e-fading” timescale of 0.9 Gyrs (for H0= 50 km s-1 Mpc-1).
In this paper we use the 3CR and quasar samples from Paper 1 and Rector et al. (1995) to investigate the extended radio morphologies of these sources for confirmation of this “evolutionary hypothesis”. That is, do we see changes in the radio morphology of the 3CR/FR2 sample used in Paper 1 due to the changing ICM density expected in the “fading AGN” hypothesis? This paper is organized as follows: The AGN samples used in this study are discussed in Section 2. The radio structure parameters used herein are defined and the morphology data are presented in Section 3. These parameters are simple, quantitative measures of radio source size (and thus confinement) and distortions. The results of the correlation analyses between the radio structure parameters and the density of the surrounding galaxy environment () are given in Section 4. This correlation analysis shows that only some of the radio structure parameters are sensitive to the presence of a dense ICM. However, those parameters that do correlate with Bgg do so only at 0.4, strongly suggesting that the ICM around these sources is just forming at 0.4. Section 5 contains a comparison between the clusters found around the FR2s in the present sample and rich, X-ray selected clusters at comparable redshifts, which contain only FR1 type radio sources (Stocke et al., 1999). Because the X-ray selected clusters are demonstrably richer than the AGN-selected clusters in our sample, it is not surprising that both a dense ICM and also FR1 radio galaxies are present in them. A summary of the findings is given in Section 6, in which we report that this investigation provides substantial, additional support for the “evolutionary” hypothesis of EYG and Paper 1. Future work that can further test this hypothesis also is proposed. Values of H0 = 50 km s-1 Mpc-1 and q0 = 0 are assumed throughout this work to be consistent with earlier work; however, none of the results are sensitive to these choices.
2 The 3CR and Quasar Samples
The sample observed and analyzed for this study consists of all 3CR radio galaxies and quasars with 0.15 0.65 and that are listed in the Revised 3C Catalog of Radio Sources from Smith, Spinrad & Smith (1976) as updated by Spinrad et al. (1985) and Spinrad et al. (1991). This sample is discussed in Paper 1 with the basic properties for sources in that sample given in Table 1 of Paper 1. While the 3CR is a low-frequency radio-selected sample, it is not rigorously complete due to the exclusion of a few very large or confused sources (see Laing, Riley & Longair, 1983). But almost all of these potential additions are at lower and so do not affect the sample investigated here. A systematic exclusion of very large sources would cause a slight bias against discovering clusters, but given the small number of possible additions to the 3CR, we expect this bias to be negligible. There are 66 radio galaxies and 14 quasars listed in Smith et al. (1976) in the redshift range of this study but one of the galaxies, 3C 258, was discovered to contain what is believed to be a distant background quasar in its spectrum (A. Dey, private communication). Since the angular size of 3C 258 is quite small for a source at a redshift of , it is likely that the radio source is associated with the background object. Thus, this object has been removed from the sample. All of the sources in this sample have a rest frame luminosity well above (26.8 (W Hz-1) 29.0) the nominal boundary between FR1 and FR2 type radio sources (Fanaroff & Riley, 1974; Owen & Laing, 1989). Further details of the sample selection and source properties can be found in Paper 1 and Harvanek (1999).
Previously used as a comparison sample in Paper 1, the quasar sample of Yee & Ellingson (1993) contains 55 quasars with and that are not found in the 3CR sample. Rector et al. (1995) provide radio structure parameters for 24 of these 55 quasars and we adopt their values directly. When combined with the 3CR sample, radio structure parameters are available for 65 radio galaxies and 38 quasars; 63 of these radio galaxies and 35 of these quasars have a double-lobed radio structure (so all their radio structure parameters are well-defined). Information on the environment (i.e., values taken from Paper 1 and Yee & Ellingson 1993) exists for a very large subset of these sources: 50 radio galaxies and 34 quasars. Because the few objects lacking values were missed due to optical observing conditions, no bias is introduced into this study due to their absence (see Paper 1 for details).
3 The Observational Data
In order to measure accurately the radio structure parameters used in this study, it was necessary to obtain radio maps showing the core, hot spots and extended structure of each source. Often this required maps of the same source at different frequencies because the steep-spectrum, extended structure is more easily detected at L-band frequencies (1.3-1.7 GHz) while the flatter spectrum cores, jets and hot spots are better observed at the higher frequencies of C (4.5-5.0 GHz), X (8.1-8.8 GHz) and U-band (14.6-15.3 GHz). Adequate maps of most of the sources were found in the literature. However, we did observe 15 of the radio galaxies used in this study with the VLA in order to obtain new maps more suitable for our purposes (see Harvanek & Hardcastle, 1998). These new data include 20 cm continuum maps to detect lower surface brightness extended structure as well as a few higher frequency maps of smaller sources to locate previously undetected cores. Surprisingly, one of the “missing” maps was a 20 cm map of Hercules A (3C 348), which can now be found in Harvanek & Hardcastle (1998) and Section 4 herein.
The richness of the cluster environment is quantified using the amplitude of the galaxy-galaxy spatial covariance function () evaluated at the location of the radio galaxy. This quantity and its associated errors are discussed in detail in Paper 1 and references therein. All values used in this study are taken from Paper 1 (for the 3CR sources) or from Yee & Ellingson (1993) (for the non-3CR quasars).
3.1 The Radio Structure Parameters
To quantify the radio structure of each source, the following parameters were measured from the radio maps: the largest angular size (), the angular size () measured between the brightest spot in each radio lobe, the projected bending angle (), the lobe length asymmetry (), and the Fanaroff-Riley ratio ( ratio). These quantities are defined in the text below and some are illustrated in Figure 1. The radio structural parameters for the 3CR sources used in this study are listed in Table 1; the non-3CR quasar data can be found in Table 1 of Rector et al. (1995). Each of these parameters are defined and discussed in detail in the subsections just below. Table 1 includes by column: (1) 3CR source number; (2) redshift; (3) largest angular size () in arcsecs; (4) largest angular size () converted to h kpc; (5) literature reference and band for the map used in the measurement; (6) angular size between brightest flux points () in arcsecs; (7) angular size between brightest flux points () converted to h kpc; (8) projected bending angle () in degrees; (9) literature reference and band for the map used in and measurements; (10) the lobe length asymmetry () with values ranging from 1.0 for symmetric sources to 1 for very asymmetric sources; (11) Fanaroff-Riley ratio ( ratio) with values ranging from 1 (i.e., highly-collimated FR2-like structure) to 0.5, values typical of FR1s; (12) literature references and band for the maps used in and ratio measurements; and (13) additional references for radio maps of these sources. Because considerable effort was expended locating the best available radio maps for this work, the listing of map references is extensive. Missing values indicate that the source does not have a double-lobed structure (i.e., the source has either a core + jet type structure or is point-like). Relativistic beaming and/or projection may affect some of the structures we see (e.g., one-sided jets, large bending angles and source sizes). We do not take projection or beaming effects into account because we believe that their effects are modest in our analyses (we show this explicitly in Section 4.1). This is both because this sample was primarily selected at low frequency (178 MHz) and because we omit obvious examples of beamed sources (3C 48, 3C 93.1 3C 196, 3C 273 & 3C 345) from our analyses.
3.1.1 Largest Angular Size
The (columns 3 & 4 of Table 1) is defined by the largest straight line separation between any two regions of the source showing detectable emission. Although this quantity can be dependent on instrumental sensitivity and map frequency, it is a better measure of the “total” size of the source when the source contains emission that lies farther from the core than the lobe peaks. Due to its possible sensitivity and frequency dependence, was measured from all available maps of the same source and the largest viable measurement was recorded. The measurement typically comes from an L-band map and was measured from the 3 map contour. For some of the smaller sources, however, the resolution of the instrument (typically 1-3 arcsec for VLA L-band) artificially inflates this value (i.e., beam size) and in these cases a measurement taken from a higher resolution map was used, despite reduced sensitivity to steep-spectrum emission. FR2 type structures have fairly robust measurements of because the leading edges of each emission lobe are usually bright and are detected at high signal-to-noise ratio (SNR). However, FR1-type structures become dimmer further from the core and so their values may vary substantially from map to map. Since only a few of these sources have an intermediate FR2/FR1 radio structure (see Section 4), most measurements do not vary much from map to map (5%). For some sources, maps unaffected by undersampling were not available. Values taken from maps that may be undersampled affect 16 sources only and are listed as lower limits in Table 1.
3.1.2 Peak to Peak Angular Size
The angular size (columns 6 & 7 in Table 1) is the angular distance from the peak flux point in one lobe to the peak in the other lobe (see Figure 1) and is similar to the for edge brightened sources. Although not as good a measure of the “total” size of a source (i.e., ), this measurement is more robust than the measurement because it is relatively independent of the sensitivity or frequency of the map from which it was taken. The measurement is only slightly affected by resolution and is not affected by undersampling. Values of taken from different maps of the same source typically have variations of only 2-3%. In general, was measured from the highest resolution maps available because these maps give the most precise position of the lobe peaks.
3.1.3 Projected Bending Angle
The projected bending angle (column 8 in Table 1) is defined to be the angle between the two intersecting lines that run from the peak flux point of each lobe through the core (see Figure 1). Beta is a measure of the non-collinearity of the source. This quantity was measured to the nearest degree. Measurements from different maps of the same source give variations of 2-3∘. This quantity is best measured from the highest resolution maps available because these maps give the most precise peak and core positions and so these values were taken from the same maps as . For 7 sources, no radio core was detected in any map, in which case the optical position was used as the radio core position. Since the errors in these optical positions are typically 1 arcsec, values calculated using optical positions are more uncertain than those using radio core positions (which have typical errors of 0.1-0.3 arcsec). Therefore, all values calculated using an optical position rather than a radio core position are marked with a colon. This uncertainty can be especially important for the smaller sources () where a small difference between the optical and radio core position can result in a substantial change in the value of (and as well; the ratio is less sensitive to the core position).
3.1.4 Lobe Length Asymmetry
The lobe length asymmetry (column 10 in Table 1) is defined to be where is the distance from the core to the farther lobe peak and is the distance from the core to the closer lobe peak (see Figure 1). Measurements from different maps of the same source give typical variations of 5-10% in . Because the values of and were also used in the calculation of the ratio (see below), they were generally taken from maps showing the largest amount of extended structure. Occasionally, some of these maps had much poorer resolution than the maps from which and were measured. For these 17 cases, was taken from the high resolution maps and these values are marked with an asterisk in column 10 of Table 1. For most values, the map reference and frequency band are given in column 12. For values marked with an asterisk, the map reference and frequency band are given in column 9. Values of marked with a colon were obtained using an optical position rather than a radio core, as discussed above.
3.1.5 Fanaroff-Riley Ratio
As discussed previously, the ratio (column 11 of Table 1) was developed by Fanaroff & Riley (1974) to help classify the structure of radio galaxies. It was originally defined as / (see Figure 1). However, the ratio used in Rector et al. (1995) and herein is slightly different. It is defined to be where and are defined as above and and are the distances from the core to the farthest extent of the lobes (see Figure 1). Like the original ratio of Fanaroff & Riley (1974), it is a measure of the position of the lobe peaks relative to the lobe edges. For most sources, the two definitions of this ratio yield nearly identical values. Differences can occur for sources with large bending angles and for sources with an substantially larger than the angular size measured along the radio axis (i.e., sources with large regions of extended emission transverse to the radio axis). For some sources it was even unclear whether or not the farthest detectable emission actually belonged to either of the lobes (e.g., 3C 171). So, in order to remain consistent, we chose to always make the measurements along the line containing the core and the lobe peak flux point. Values of computed with measurements substantially smaller () than the distance to the farthest detectable emission are marked with a dagger.
Because the ratio can be dependent on the resolution, sensitivity and frequency of the map, values from different maps varied by 5-10%. In order to maximize sensitivity to the extended lobe emission, measurements were usually taken from the L-band map. The few values taken from maps at higher frequencies should be considered slightly suspect because it is uncertain whether or not the full extended structure was detected in these maps. Such values have no distinguishing mark (as the map frequency is given in column 12). Measurements taken from maps that may be undersampled can underestimate the values of and so these values of are given as upper limits. Values of marked with a colon were obtained using an optical position rather than a radio core, as discussed above.
3.2 Comments on Individual Sources
In general, comments on individual sources made herein are restricted to those sources either with difficulties and/or new, unpublished information which relates directly to the measurement of the radio structure parameters in Table 1. More detailed comments on these sources can be found in Harvanek (1999). A few problems are generic to several sources and we discuss them first. There are four sources in Table 1 (3C 48, 3C 196.1, 3C 273 & 3C 345) with core-jet type structure and one point source (3C 93.1), so that the geometry assumed by Figure 1 is not applicable. Thus, several of the quantities described in Section 3.1 could not be measured for these sources and so entries for them are left blank in Table 1. As noted previously, several sources have L-band maps which suffer from some undersampling; values taken from these maps are noted as limits in Table 1. Additionally, despite higher frequency maps being available, some sources have no detected core. In this instance, values affected adversely are marked with colons. Unless the only available maps are quite deficient and/or the source structure is quite complex, the errors introduced into the current measurements are modest (i.e., creating additional errors of only a few sigma). Only the most difficult cases of the above problems are discussed individually below.
3C 28: Although the optical position has been used for measurements, a very faint core has been detected at 5 GHz (C band) that is coincident with the optical ID (J.T. Stocke, unpublished).
3C 93.1: This source appears point-like in all maps available to us. Thus, our value of is given as an upper limit in Table 1 and values for the other parameters could not be measured, and so appear as as blanks in Table 1.
3C 99: Because the L-band maps of this source have relatively modest dynamic range, the and size values reported in Table 1 are quite uncertain. Also, varies from 2.3-4.7 depending upon the low-frequency map used (408 MHz or 1.4 GHz). Therefore, the high value for this source is very uncertain.
3C 225B: No core detection is known for this somewhat small source and so the optical position marked on the C-band map of Giovannini et al. (1988) is used for all measurements. Since the angular size of this source is small (6.3′′) and the errors in the optical position are relatively large (), structural parameters measured using the optical position are highly uncertain and the actual values could vary substantially from those quoted in Table 1. Note, however, that none of the values listed in Table 1 are unusual. The C-band map of Giovannini et al. (1988) shows two typical lobes. The source is not resolved in the only L-band map available (Macdonald, Kenderdine & Neville 1968).
3C 275: No core has been detected for this small source and so the optical position of Baum et al. (1988) was used for all measurements. This optical position differs from that of Spinrad et al. (1991) (which is listed in Table 1 of Paper 1) by nearly 4′′ in right ascension (the declinations agree). The errors in the position of Baum et al. (1988) are given as 0.65′′ while those of Spinrad et al. (1991) are given in Kristian, Sandage & Katem (1974) as 1′′ (in each direction). Since the positions do not agree within the errors, we have chosen to use the position quoted to better accuracy. Although the errors in this optical position are smaller than most used in this work, the angular size of this source is so small (6.8′′) that the structural parameters measured using this optical position must be considered uncertain. Note, however, that none of the values listed are peculiar. The C-band map of Mantovani et al. (1992) shows two typical lobes. No L-band map was available for this source and we did not observe it in L-band because of its small angular size.
3C 288: The southern lobe extends to the west away from the radio axis by more than the peak-to-peak source size and then extends further to the south. The northern lobe continues beyond the peak to the north by more than the peak-to-peak source size and also extends to the west (although not as far as the southern lobe). This northern extension gives the source its low value. Possible undersampling of the map may hide even larger regions of extended emission. According to Bridle et al. (1989), the radio core in their C-band map is coincident with the optical position marked on their L-band map (the cross closer to the southern peak) and so the value taken from the L-band map is not marked with a colon. The value measured from the L-band map is 32% larger than the value taken from the C-band map listed in Table 1. This large difference is probably due to differences in resolution.
3C 299: Due in part to the large lobe length asymmetry of this source, the eastern lobe of this source was once thought to be a separate compact steep-spectrum source, which is why many maps show only the eastern component. Using the core position from the L-band map of Leahy, Bridle & Strom (1997), the L-band map of Liu, Pooley & Riley (1992) was used for measurements because the L-band map of Leahy et al. (1997) is probably undersampled. The values from these two maps differ by 17%, probably due to differences in resolution. The value from the higher resolution map of Leahy et al. (1997) is listed in Table 1.
3C 303.1: No core has been detected for this small source and so the optical position of Spinrad et al. (1991) is used for all measurements. Since the errors in the optical position are comparable to the angular size of the source, structural parameters measured using the optical position are highly uncertain and could vary substantially from those quoted in Table 1. Note, however, that none of the listed values are peculiar. The X-band map of Akujor & Garrington (1995) is used for and ratio measurements because the L-band maps show no additional extended structure.
3C 313: Maps of this giant source are almost certainly undersampled and it is likely that large regions of emission are missing. The values of and the ratio are definitely suspect. The eastern lobe shows a small extension to the north but fully sampled maps are needed before the structure of this source can be assessed accurately. The X-band map of Bogers et al. (1994) is used for and ratio measurements because the L-band maps either show no additional structure or have poor resolution.
3C 319: No core is detected for this source and so the optical position marked on the L band map of Leahy & Williams (1984) is used for all measurements. This optical position agrees with that of Spinrad et al. (1991). Although the angular size of this source is large, the values of , and are all uncertain because, in addition to the uncertain core position, the peak in the western lobe is weak, not well-defined and lies relatively close to the optical position.
3C 320: All maps suffer from poor resolution and show only two featureless lobes. The and converted physical size taken from our map may be slightly overestimated due to both the poor resolution and the elongated beam shape. A radio core is not apparent in any map but when the two lobes are removed from our X-band map, a structure resembling a core remains (see Harvanek & Hardcastle 1998 for further details). An attempt was made to place this core position on the L-band map of Gregorini et al. (1988) for ratio measurements but the coordinates of the L-band map appear to be inconsistent with those of our map because the core was not in the same position relative to the lobe peaks. Thus, for the ratio measurements, the optical position marked on the L-band map was used. Values of and taken from the L-band map agreed, within the errors, with those listed in Table 1, which were taken from our X-band map. This indicates that the optical position marked on the L-band map of Gregorini et al. (1988) is close to that of our radio core position even though the coordinates are discrepant. The low ratio (0.46) may be due to the poor map resolution rather than the actual radio structure and so is listed as uncertain (marked with a “?”) in Table 1.
3C 459: The value measured from our L-band map is 25% larger than the value listed in Table 1, which was taken from the U-band map of van Breugel (private communication). However, the C-band map of Morganti, Killeen & Tadhunter (1993) detects a weak western component, not seen by any other observations. If this component is real, then 1.5. Therefore, the large value for this source is very uncertain.
3C 460: The difference in the values measured from the U- and L-band maps of van Breugel (private communication) is substantial (the U-band map value is 32% larger). Most of this discrepancy is probably due to the fact that the resolution of the U-band map is better (which is why the U-band value is listed in Table 1). Since no core was detected in the L-band map, measurements from this map were made using the core position from the U-band map and so differences in the coordinates of the two maps also could contribute to the discrepancy in the values. The low value of the ratio may be due, at least partially, to the L-band map resolution.
4 Correlations With the Radio Structure Properties
4.1 Comparison Between Radio Galaxies and Quasars
In Paper 1 we compared the galaxy environments of radio galaxies and quasars in order to test the two hypotheses that relate these two types of objects. We found that the orientation angle hypothesis of Barthel (1989) cannot account for the difference in the clustering environments of the two types of objects at seen in Paper 1, whereas the evolutionary hypothesis of EYG actually predicts the difference seen. This result appears to rule out Barthel’s orientation angle hypothesis as the primary means of relating quasars and radio galaxies, and favors the “evolutionary hypothesis” of EYG. However, orientation angle may still play a secondary role in this relationship (i.e., SOME quasars are beamed radio galaxies, like the core-jet sources mentioned above).
While the radio galaxy and quasar samples used here are not matched precisely in redshift and radio power, we compare their radio structures here for two reasons: (1) to verify that orientation effects do not dominate the results found (in which case the differences in size and morphology between quasars and radio galaxies would be large) and (2) to make certain that there are no systematic biases in measurements of Rector et al. (1995) for the quasars and our own 3CR radio galaxy and quasar measurements in Table 1.
A comparison of the quasar and radio galaxy distributions for each of the radio structure properties in Table 1 was done using a Kolmogorov-Smirnov test (KS test hereafter). The likelihood that the quasar and radio galaxy distributions came from the same parent population is 35% for the projected physical size, 48% for the projected bending angle, 98% for the ratio and 92% for the lobe length asymmetry. The latter two properties ( and ) are not expected to show an orientation angle effect, but neither is there any significant evidence for quasars and radio galaxies being systematically different in the other two properties; e.g., the difference in projected physical size distributions between our two samples is three times less significant than the difference found by Barthel (1989) for his samples. We do not mean to challenge Barthel’s result by our analysis because we have not attempted to match our quasar and radio galaxy samples as closely as is necessary to conduct this test with accuracy, and there already are published conflicting results in the literature (see references cited in the Introduction). For our quasar and radio galaxy samples, both the mean and median of the the projected physical size and bending angle distributions were compared and the differences were small (). Thus, we feel justified in combining these two samples into a single “FR2” sample. From power level considerations, all of these quasar and radio galaxy sources are FR2s, and so the combined sample is ideal to search for evidence of an ICM using distortions in the radio structure, because an FR1-like radio structure (e.g., low ratio) for a source in this sample cannot be attributed to a low radio power (see Table 1 in Paper 1 for P178 values).
4.2 Radio Structure vs.
The search for evidence of an ICM around these sources is performed by looking for correlations between the richness of the galaxy environment () and the radio structure properties that could be affected by interactions with a dense surrounding medium. This technique implicitly assumes that a richer galaxy environment possesses a denser ICM, which may not be the case at all redshifts included in the sample. A dense ICM interacting with the radio structure should tend to confine and distort the structure, making it smaller, more bent (larger ) and more asymmetric (larger ) and thus would lower its physical size and FR ratio.
The overall comparisons using the combined quasar + radio galaxy “FR2” sample shows little correlation between the environment and the radio structure parameters, yielding correlation coefficients of and for with the physical size, , ratio and , respectively (with confidence levels of and , respectively). Since the weak correlation between environment and is in the opposite direction expected for an interaction with a dense medium (and is due primarily to three sources with uncertain values; see Section 3.2), the only evidence at all for a dense ICM using these statistics is the weak anti-correlation between environment and FR ratio. Therefore, we conclude either that the morphology of FR2s is unaffected by the surrounding ICM or that a dense ICM has yet to form around those sources with high values in our sample.
However, it is possible that the ICM is actually forming in these clusters during the epochs studied here (i.e., ; see Section 1) and so its effects may be detectable only after a certain epoch. Indeed, this is the prediction of the “evolutionary hypothesis” discussed in the Introduction; i.e., when the ICM begins to develop, the quasars fade, leaving only radio galaxies in clusters at the lower redshifts. The further fading of FR2s into FR1s would then be accompanied by observable morphology changes at and below the redshifts where the ICM begins to form. Given the richness of the clusters (Abell class 0-1) we have found around these FR2s, =0.4 is a reasonable epoch in a low- universe for the formation of a dense ICM (Perrenod 1978; Stocke & Perrenod 1981; Eke, Cole & Frenk 1996).
In order to investigate this possibility, the data were divided into low () and high () redshift subsamples and the correlation analysis was performed for each subsample separately. The separation at was chosen both because it nearly divides the sample evenly and because of the results of Paper 1 and EYG; i.e., at 0.4 only radio galaxies, not quasars, are found in clusters. Figures 2, 3, 4 & 5 show plots of the various radio structure parameters vs. environment for both the low- and high-z subsamples. The correlation coefficients for the data in each plot are given in the figure captions.
The plots of projected physical size ( converted to physical dimensions) vs. environment () in Figure 2 show some evidence for an ICM, but only at the lower redshifts. The low-z panel shows a correlation although both the coefficient and the confidence level are somewhat low (; confidence level of ). The correlation is such that smaller sources tend to be found in richer environments and, taken alone, is slight evidence for an ICM around the higher sources at . The high-z panel shows no correlation.
The presence of a dense ICM is most noticeable in Figure 3, which plots ratio vs. . While very few FR2s at have ratios that approach the 0.5 dividing line between FR1 and FR2 morphology, over 25% of the low-z subsample have ratios near the dividing line, including almost all the sources with 500 Mpc1.77. The low- panel of Figure 3 shows a relatively strong correlation between ratio and environment (; confidence level of ). The correlation is such that sources with a lower ratio are found almost exclusively in richer environments and is strong evidence for an ICM around the sources with high values at . The high-z panel shows no such correlation. Therefore, the weak correlation seen in this relationship over the entire redshift range is due entirely to the subsample.
The other two parameters, lobe length asymmetry and bending angle, show no correlation with environment at any redshift covered by this sample. While the low- panel of Figure 4 appears to show a slight anti-correlation between lobe length asymmetry () and environment, the correlation coefficient is very weak () and the confidence level of suggests it is likely not significant; the high- panel indicates a similar strength anti-correlation. In both cases it is obvious that most of these correlations come from points representing uncertain data; i.e., the single high point (3C 99) at high- and two high points (3C 459 and 3C 460) at low- (see Section 3.2). Without these points there is no correlation in either redshift range. Also, these anti-correlations are in the opposite sense to the expected effect that a denser ICM would have on the lobe length asymmetry.
The low- panel of Figure 5 appears to show an anti-correlation between bending angle () and environment but the coefficient indicates that it is not significant ( at a confidence level of ). The high- vs. Bgg plot shows a similarly weak positive correlation. Three of the four high- points () in Figure 5 are very distorted sources with poorly determined values (Rector et al., 1995). The one high , high Bgg point is the highly-distorted quasar 3CR 215. Thus, neither nor show any evidence for being affected by an ICM surrounding some of these sources.
The results of the correlation analyses for and vs. are evidence for an ICM at , but not at , despite the high values for many clusters around quasars and radio galaxies in that redshift range. The lack of the appropriate - and - correlations in any redshift interval covered by our samples are indications that large and are caused by something other than an interaction with a dense ICM. For example, such structural features may be due to a redirection of the radio jet and/or lobe caused by an inelastic collision between the radio jet/lobe and a nearby galaxy or dense intergalactic cloud as discussed in Stocke et al. (1985). That paper predicted that inelastic jet-cloud collisions can cause both large and .
The lack of a correlation between and is also important because both previously (Hintzen & Scott 1978) and currently (Blanton et al. 2000), a large has been proposed as an indicator for rich clusters around powerful radio sources. If this were true, bent radio sources would be a very powerful method for discovering extremely distant clusters of galaxies. As Figure 5 shows, sources with occur at widely different values, ranging from to Mpc1.77. Thus, an FR2 type radio source with a large bending angle does not appear to constrain the richness of its environment at all. We conclude that, while the “bent” morphology of FR1 type sources is strong evidence for a dense ICM, a large in an FR2 source is not an unambiguous indicator of a rich cluster environment.
The Blanton et al. (2000) results utilize the radio survey called “Faint Images of the Radio Sky at Twenty centimeters” (FIRST), which has a nominal survey limit of 1 mJy. Since detection of a core and two lobes are required to define a large , a minimum total flux of 5-10 mJy is required for this determination in FIRST data. Because the most luminous FR1s have log P 25.3 W Hz-1, the maximum redshift at which FIRST can detect an FR1 is 0.5. Beyond that redshift, any bent source in FIRST would be an FR2, not an FR1. Based upon the analysis presented herein, which fails to find any correlation between large and high value for FR2s, a deeper survey than FIRST would need to be performed in order to discover rich clusters at 0.5 using this method.
To illustrate the morphological differences indicated by the correlation between ratio and environment at low redshift (), radio maps of four 3CR sources in rich environments (500 Mpc1.77) and four 3CR sources in poor environments ( Mpc1.77) in this redshift range are shown in Figures 6 and 7, respectively. Based on their radio power, all sources in Figures 6 and 7 are easily within the range of FR2 type sources. Specifically, the four sources in rich environments have the following logarithmic radio power levels at 178 MHz in W Hz-1 in parentheses: 3C 173.1 (27.90); 3C 348 (28.66); 3C 401 (27.66) and 3C 346 (27.16). Note that 3 of the 4 sources in rich environments (Figure 6) have a low ratio () which is characteristic of FR1 type radio structure. The brightness and prominence of the jet(s), the absence of very well-defined, leading-edge hot spots and the overall breadth and distortion of the lobes of these 3 sources are also similar to FR1 type structure, despite their FR2 power levels. Thus, these three sources are examples of the morphological type originally described by Owen & Laing (1989) as “fat doubles” or FR1/FR2 hybrid sources. In Figure 6, only the source in the upper left panel (3C 173.1) lacks some obvious FR1 morphological characteristics. In contrast, the 4 sources in poor environments (Figure 7) all have an ratio (i.e., typical of FR2s) and lack other FR1 type characteristics as well. Thus, it is apparent that at redshifts of , sources with FR2 power levels are much more likely to have some FR1 type structural characteristics if they are in rich galaxy environments. Not only is this evidence of an ICM in the richer environments at , but their “fat double”, or intermediate FR1/FR2, morphologies suggests that these FR2 radio sources may eventually evolve into FR1 sources at later times, as the cluster ICM thickens around them.
Figure 6 shows only 4 of the 6 sources with and Mpc1.77. The other 2 sources also have FR1 type characteristics. 3C 28 has a somewhat high ratio (0.73) but has a two-sided jet and extremely “fat” and distorted radio lobes (both of which are characteristics of FR1s). 3C 320 has a low ratio (0.46) and might be described as a “fat double”, but this measurement and impression may be due to poor map resolution. Of these 6 sources, 3C 173.1 (Figure 6, upper left panel) is the only source lacking some FR1 type characteristics and so the maps in Figure 6 are a fair representation of sources with high at 0.4.
Although not all sources with and Mpc1.77 have and lack FR1 type characteristics, most do and so the maps of Figure 7 are also representative of the low- subsample. Also, all maps in Figure 7 except 3C 18 (upper left panel) are quite colinear; 3C 18 has a bent or “dog-leg” type structure with specific features attributable to a jet-cloud collision (Stocke et al., 1985). For example, the lobe closer to the core is significantly broader than the other lobe, as expected from an inelastic collision. This source is a good example of why a large is not an unambiguous indicator of a rich (or poor) cluster around an FR2 type radio source (Figure 5). Although this source clearly has a large bending angle () the surrounding galaxy environment is quite poor ( Mpc1.77; i.e., its surrounding galaxy surface density is actually less than the average background for its redshift). As mentioned above, at least four of the cluster radio sources at 0.4 in our sample (the three in Figure 6 plus 3C 28) can be described as “fat doubles” (Owen & Laing 1989), and one additional cluster FR2 source (3C 320) could be “fat” but the map resolution is insufficient to be certain. Additionally, three other FR2s at 0.4 with an ratio 0.5 can be described as “fat doubles” (3C 213.1, 3C 219 and 3C 288) but lack deep imaging to determine if a cluster is present. We predict that: (1) a higher resolution, L-band map of 3C 320 will find that it has similar morphology to the sources in Figure 6 and (2) clusters will be discovered around 3C 213.1, 3C 219 and 3C 288. Conversely, only 3C 173.1 is found in a rich galaxy environment and is not “fat” and, no non-cluster 3CR source at 0.4 is demonstrably “fat”. The only quasar in our sample which might be described as a “fat double” is 3C 215 (=1000 Mpc1.77 at z=0.411). Recent ROSAT and CHANDRA X-ray observations confirm the presence of a dense ICM around 4 of the 7 “fat doubles” at 0.4: 3C 28 (Feretti et al., 1984, using an Einstein image), 3C 348 (Gizani & Leahy, 1999), 3C 219 (Hardcastle & Worrall, 1999) and 3C 346 (Worrall & Birkinshaw, 2001). Other claimed ICM detections were made with the ROSAT HRI around 0.5 FR2s (Hall et al. 1995; Wan & Daly 1996; Hall, Ellingson & Green 1997; Hardcastle & Worrall 1999) with measured X-ray source sizes close to the resolution limits of the HRI (particularly once spacecraft “wobble” during long exposures is taken into account; see Morse 1994 and Rector, Stocke & Perlman 1999). Thus, we judge all these detections to be tentative. Nevertheless, recent CHANDRA observations of 3C 220.1 (=0.620; =451 Mpc1.77; ratio0.88) obtained by Worrall et al. (2002) and 3C 295 (=0.461; =1030 Mpc1.77; ratio=0.78) obtained by Harris et al. (2000) have detected definite extended cluster emission. The 3C 295 detection is expected from its high- value and from its radio structural parameters in Table 1. However, the 3C 220.1 detection is unexpected given its rather modest value and it classical double radio structure at high-. While it is possible that this FR2 is projected onto a cluster (i.e., 3C 220.1 is in the outskirts of a cluster similar to the case of Cygnus A; Owen et al., 1997), the discovery of even one or two more cases like 3C 220.1 (i.e., high , classical FR2 structure but with a dense ICM) would be significant evidence against the inferences about the presence or absence of a dense ICM made herein. With that in mind, imaging spectroscopy with CHANDRA should be obtained for the other few 3CR FR2s with tentative ROSAT detections (see Hardcastle & Worrall, 1999). If the inferences herein are correct, no dense ICM should be detected around 3C 334 and 3C 275.1 (although this latter case is a less obvious prediction because there is a significant galaxy cluster with =1125 Mpc1.77 but the source is not demonstrably “fat”) but extended X-ray emission should be found surrounding 3C 215 (=0.411; =1000 Mpc1.77; ratio=0.65).
4.3 Are the Observed Correlations Due to Radio Power or Redshift?
Because the vast majority of the sources studied herein come from the flux-limited 3CR Catalog, there is a strong correlation between radio power and redshift in our sample. Since Paper 1 and EYG found correlations between and redshift for large subsets of our sample, the morphology- correlations found in the previous section could be due to radio power instead. So, in this section, we investigate the possibility of correlations between the radio structure properties and both the radio power and the redshift. The correlation analyses were performed over the entire redshift range () and also over both redshift subsamples ( and ) separately. Dividing the data into two redshift subsamples provides a comparison of the evolution over these two epochs which may be different if the ICM around these AGN is indeed forming at as suggested above.
The analyses relating the various radio structure properties to the radio power revealed no significant correlations. We find only a very weak correlation with r=+0.127 at a confidence level of 77% between radio power and ratio for our full sample. The correlations were even poorer for the high and low- subsamples separately (r=+0.047 and -0.057 respectively; both at a 50% confidence level). Since the ratio vs. anti-correlation is in the low- subsample, the above correlations (particularly the last one) are far too weak to explain the correlation found in the last section. Also, we find no significant correlation between radio power and projected physical size or , either for the full sample or for either subsample. Bending angle is weakly anti-correlated with radio power in the full sample (r=-0.112 at 71% confidence level), but even more weakly correlated in the subsamples. While correlations between radio structure and radio power level would be expected from the classification scheme of Fanaroff & Riley (1974), all the sources studied here are well above the nominal FR1/FR2 dividing line. Thus, since no truly low power sources (FR1s) are present in our sample, it appears that the range of radio powers is not large enough to detect these previously known correlations. However, these results do show that a variation in radio power over the range represented by the sources in this study ( log (W Hz-1) 29.0) is not sufficient to significantly influence the radio structure. This indicates that variations in radio power are not the dominant factor in causing the distortions in the radio morphology.
The relationships between the various radio structure properties and redshift were also examined. A correlation between ratio and redshift was found for the low- data and all data, both having a coefficient of at confidence levels of 95% and 99.5%, respectively. No correlation was detected for the high- data alone. This result shows that there is no evolution in this property until , at which point the ratio decreases with decreasing , consistent with our earlier interpretation that a dense ICM is forming around these sources at . No other correlations between radio structure properties and redshift are found except for a marginal correlation between projected physical size and redshift ( at a confidence level of 68%) in the high- subsample alone. If real, this marginal anti-correlation could be due to radio sources expanding with time until 0.4, when the developing ICM begins to confine them more strongly. The lack of correlations between and redshift and and redshift are a further indication that the ICM is not the dominant factor in creating large and .
We conclude that there is no strong evidence that radio power is responsible for the morphological differences seen at 0.4 in our sample. While overall power level, and thus jet power level, might be expected to make morphological differences in extended radio sources, this cannot be the cause of the differences found here.
5 Comparisons with X-ray Luminous Clusters
A confusing factor in the interpretation of these results is that FR1 type sources have been discovered in clusters at redshifts comparable to the range studied here (e.g., HL and Stocke et al., 1999). In this section we show that the clusters which contain FR1s at =0.15 to 0.83 are demonstrably richer than those found around the FR2 quasars and radio galaxies in Paper 1. Since the clusters found to contain FR1s by Stocke et al. (1999) are all X-ray luminous, there is direct evidence that these clusters already contain a dense ICM.
The Einstein Extended Medium Sensitivity Survey (hereafter EMSS; Gioia et al. 1990; Stocke et al. 1991; Maccacaro et al. 1994) is one of the largest and best studied surveys for faint X-ray sources made to date. The EMSS surveyed nearly 800 deg-2 of sky, discovering 835 faint sources at 5 x 10 fx (ergs cm-2 s-1) 3 x 10-12. Over one hundred of these sources are identified as distant clusters of galaxies, including some objects at substantial soft X-ray luminosities (1045 ergs s-1) and redshifts (0.8).
The EMSS cluster sample observed by Stocke et al. (1999) with the VLA is composed of 19 EMSS clusters in the redshift range . Since this sample is small and does not match the redshift range studied herein, an expanded sample, which includes all EMSS clusters with (59 sources), is also discussed. Stocke et al. (1999) provide detailed information (maps, fluxes, optical IDs, etc.) on the radio sources detected in their 0.3 EMSS cluster survey. All sources known to be associated with these EMSS clusters have an FR1 type radio structure and radio power level. For the 40 additional clusters in the extended sample of all EMSS clusters with , examinations by one of us (JTS) of the VLA C-array snapshot data summarized in Gioia & Luppino (1994) found only two sources with radio power near that of an FR2 (log P W Hz-1). Both of these sources were unresolved in the snapshot data and with optical counterparts as yet unconfirmed as clusters members, so that further observations must be made before the presence of FR2 radio sources in these EMSS clusters can be ruled out completely. Therefore, it appears very likely that all radio sources in EMSS clusters at have an FR1 type radio structure and power level.
The values for the entire EMSS cluster sample, along with cluster names and redshifts, are listed in Table 2. Clusters marked with an asterisk are those in the sample of Stocke et al. (1999). If available, values provided by Yee & Ellingson (2002) are used. These values were computed in the same manner as the values of Paper 1 and Yee & Ellingson (1993) and are identified by a “Yee” in the “Comments” column. Otherwise, we have estimated the value from the X-ray luminosity as follows: the cluster X-ray luminosity was converted to a central galaxy density, (the number of excess galaxies with -19 within 0.5 Mpc of the cluster center), using the correlations () given in Abramopoulos & Ku (1983) and Yee & Ellingson (2002). The values were then obtained using the scaling needed to convert values into the values supplied by Yee & Ellingson (2002). This is consistent with the scaling factors derived in Paper 1 and in HL. Cooling flow clusters are denoted by a “CF” in the “Comments” column. Because a cooling flow appears to add “extra” X-ray emission to a cluster (increasing the X-ray luminosity per unit central galaxy density), a downward (factor of two) correction was made to the value of the one cooling flow cluster (MS0735+74) with no measured value by Yee & Ellingson (2002).
In Figure 8, the distributions of the two EMSS samples (left two histograms) are shown compared to AGN-selected clusters in this survey (right two histograms) with the 0.3 only samples at the top and the full samples at bottom. Although the distributions of AGN-selected and X-ray-selected cluster richnesses overlap in the range =500-1000 Mpc1.77, the EMSS clusters in the mean are much richer than the environments of the sources in the 3CR radio galaxy and quasar samples. KS tests were performed to quantify the differences in these distributions. For the 0.3 samples, KS-test probabilities were found with only 210-5%, 210-3% and 810-5% likelihoods that the EMSS distribution came from the same parent population as (respectively) the full radio galaxyquasar sample, the radio galaxies alone, and the quasars alone. For the full 0.15 EMSS & AGN samples, these KS probabilities are all %.
So, EMSS clusters, which are moderately rich to extremely rich environments ( Mpc1.77), and which are known to possess a dense ICM, contain only FR1 type radio sources. At the same redshifts, the FR2 type radio galaxies and quasars are found in poor to moderately rich environments ( to Mpc1.77). However, some of the radio galaxies found in the richer environments () at appear to have an FR1/FR2 transition type structure (see Figure 6), which we argue is indirect evidence of a dense ICM forming in these environments. We expect, but cannot yet prove, that the clusters found around FR2s at 0.4, do not yet contain a dense ICM. Thus, all current radio galaxy data are consistent both with FR1s being exclusively present when a dense ICM is present and also with FR2s being present when a dense ICM is absent. “Fat Doubles” (intermediate FR1/FR2s) are present when a dense ICM has first formed.
Since X-ray selected rich clusters have now been discovered out to 1 (Rosati et al. 1998), the formation of a dense ICM in poorer clusters at 0.4 is consistent with the theoretical expectation that the epoch of ICM formation is dependent upon the richness of the galaxy environment (e.g., Perrenod 1978).
6 Conclusion
6.1 A Summary of the Findings
In Paper 1 of this series, evidence was presented that quasars and FR2 radio galaxies are primarily related, not by orientation as previously proposed by Barthel (1989), but by evolution (EYG); i.e., quasars in clusters at 0.5 fade to become FR2 radio galaxies at 0.25, and continue to fade to become FR1 radio galaxies at 0. In order to further test the “evolutionary hypothesis”, we have scrutinized the radio morphologies for a large sample of quasars and radio galaxies at =0.15-0.65 to search for indirect evidence of a dense ICM around some of these sources. This was accomplished using various morphology parameters that measure the confinement and distortion of the extended radio source. We then determined whether these morphology parameters were correlated with a quantitative measurement of galaxy richness () from Paper 1. These morphology parameters included: projected physical size, hot spot location (Fanaroff-Riley or ratio), projected bending angle () and lobe length asymmetry (). Using the radio structure measurements and values for a combined sample of 63 radio galaxies and 35 quasars in the above redshift range we find the following results:
1. When the radio structure data for the radio galaxies and quasars are divided into low- (0.4) and high- (0.4) subsamples, correlations between environment and projected physical size and between environment and ratio show evidence for the presence of a dense ICM in the richer environments ( Mpc1.77) only at . There are no correlations and, thus no evidence for an ICM around the sources at . This suggests that the formation of a dense ICM in environments of Mpc1.77 occurs at .
2. There is no correlation between projected bending angle and environment or between lobe length asymmetry and environment at any redshift within the sample. This indicates that bending angle distortions and asymmetry distortions in the radio structure are not caused by an interaction with the ICM. Instead, a collision between the radio jet/lobe and a nearby galaxy or dense intergalactic cloud may be responsible (e.g., Stocke et al., 1985).
3. The lack of a correlation between bending angle and environment also demonstrates that for FR2 type radio sources, a large bending angle is not a reliable predictor of a rich galaxy environment. Thus, it should not be used as a indicator of a cluster of galaxies around an FR2 at high-, as has been previously proposed by Hintzen & Scott (1978) and recently reproposed by Blanton et al. (2000).
4. No significant correlations between radio structural properties and radio power are found within the range of radio powers used in this study: 26.8 log P178 (W Hz-1) 29.0. Specifically, all sources studied are FR2s, significantly above the FR2/FR1 dividing line in radio power. Thus, the differences in radio structure seen in our sample are not due to variations in radio power but rather due to interaction with a dense ICM.
5. At 0.4, the sources found in clusters with 500Mpc1.77 almost exclusively have morphologies that can be described as “fat doubles” (Owen & Laing, 1989), with brightest spots within the extended lobes which are well back from the leading edges of the lobes, and often in luminous jets. Three of these sources (3C 28, 3C 346 & 3C 348) have detected extended X-ray emission surrounding them (Hardcastle & Worrall, 1999; Gizani & Leahy, 1999; Worrall & Birkinshaw, 2001) so that for these cases, there is both direct and indirect evidence for a dense ICM. Additional observations of AGN clusters with CHANDRA will be able to test directly the inferences made here (see Section 6.2).
6. Correlations between redshift and ratio and between redshift and projected physical size support an ICM formation at in environments of 500-1000 Mpc1.77.
7. Numerous X-ray selected clusters are known to exist in the redshift range of our sample. These clusters have radio galaxy populations which are exclusively FR1 in morphology and power level (e.g., Stocke et al., 1999). However, these clusters are substantially richer than the environments of the sources in our radio galaxy and quasar samples at the same redshift, indicating that the formation epoch of a dense ICM depends, as expected theoretically, on cluster richness. In fact, the poorest of the EMSS cluster environments are comparable to the richest galaxy environments in the radio galaxy and quasar samples.
Thus, the results of this study are consistent with the predictions of the “evolutionary hypothesis” for radio-loud AGN first suggested by EYG. Specifically, in EYG and in Paper 1, evidence was presented that quasars found in clusters at 0.5 fade quickly (“e-fading” timescale of 0.9 Gyrs for H0=50 km s-1 Mpc-1) to become, first FR2 radio galaxies at 0.25, and then FR1 radio galaxies at the current epoch. While the physical mechanism for this fading is unknown, in Paper 1 we speculated that if radio-loud AGN are powered by a rapidly spinning Black Hole (e.g., Blandford & Znajek, 1977; Begelman, Blandford & Rees, 1980; Wilson & Colbert, 1995), the development of a deep gravitational potential and a dense ICM around these AGN would prevent further “spin up” by preventing the formation of new, supermassive Black Hole binaries. These binaries would not form because any galaxy-galaxy collisions in this cluster would be both at much higher relative velocities than previously and also would be relatively gas free, so that bound binary formation would be much less likely. In the absence of additional mechanisms to spin up the supermassive Black Hole, each radio outburst would extract spin energy that could not be replaced and so each consecutive outburst would be less powerful. Since the suggested timescale for radio outbursts (108 years; Begelman et al. 1984) is short compared to the AGN fading timescale measured in Paper 1, the radio source power and structure would “track” the fading. So, while this scenario is consistent with a duty cycle of , our data do not address directly the question of AGN duty cycle. And, while the spin down of a supermassive Black Hole seems to us to be the most attractive scenario to account for the fading of cluster AGN, it is also possible to imagine that an accretion powered AGN could have its fueling stifled by the development of a dense ICM (Stocke & Perrenod, 1981).
6.2 Prediction for Future Observations
The important aspects of our conclusions which are amenable to test currently include the presence or absence of a dense ICM based upon the FR2 radio source morphology and the possibility that FR1s in clusters were FR2s in the past. In both cases these tests involve CHANDRA imaging spectroscopy.
The first prediction is in two parts. First, we predict that a dense X-ray emitting ICM will be found around the “fat doubles” at 0.4, some of which are shown in Figure 6. In the cases of 3C 348, 3C 346 and 3C 28 there is already considerable evidence for extended X-ray emission around these three AGN (e.g., Gizani & Leahy, 1999). Two other AGN with small ratios at slightly higher (the quasar 3C 215 with =0.65 at =0.411 and the radio galaxy 3C 295 with =0.78 at =0.461) also have X-ray evidence from ROSAT for a dense ICM as their radio morphologies and values (1000 and 1030 Mpc1.77 respectively; see Paper 1) predict. In fact, Harris et al. (2000) have already detected extended cluster X-ray emission around 3C 295 with CHANDRA. The other “fat doubles” should also be imaged with CHANDRA to make sure that the presence of an ICM is generic to this class of sources. While necessary, this first prediction is insufficient to test completely our use of radio morphology to locate a dense ICM. It is also important to verify that there is no ICM present around quasars and FR2s of “classical double” morphology (i.e., high ratios). In our survey this type of source is found both in low- regions at all redshifts and in high- regions at 0.4. Of particular importance are the quasars with high- at high-, which are candidates for clusters whose ICM has yet to form. Examples of this class include the quasars 3C 263 (=0.646; =993 Mpc1.77), 3C 275.1 (=0.557; =1125 Mpc1.77) and PKS 0155-109 (=0.616; =777 Mpc1.77). 3C 275.1 is particularly important to observe with CHANDRA both because it has a large (see map in Stocke et al., 1985), and because there is a tentative ICM detection made with the ROSAT HRI. Our analysis in this paper suggests that, despite the large and the large value (Abell richness class 1), CHANDRA observations will fail to confirm the tentative HRI detection of a dense cluster ICM around 3C 275.1. Since one definite CHANDRA detection already has been made (Worrall et al. 2001) of a dense ICM around a “classical double” FR2 at high- (3C 220.1, =0.620, =418 Mpc1.77), a few others would call into question the methodology used herein to infer the presence or absence of a dense ICM from the radio source morphology.
Perhaps the most controversial hypothesis put forward in this paper and Paper 1 is the idea that FR2s in clusters at high-, fade and become FR1s in current epoch clusters. However, the recent CHANDRA discovery of “holes” in the ICM X-ray emission in some clusters may offer a means of testing this hypothesis by discovering “fossil” evidence of FR2s around FR1s. In at least one case of an X-ray “hole” around the FR1 radio galaxy in Abell 4059 (Heinz et al., 2002), the inferred power required to evacuate the “hole” of X-ray emitting gas by work is much larger than the power inferred to be present in the FR1 (51042 ergs s-1) averaged over its 108 yr lifetime (Reynolds, Heinz & Begelman 2001, which uses the prescriptions in Bicknell, Dopita & O’Dea 1997). The X-ray cavity walls also do not correspond with the current boundaries of the radio source lobes. Both the anomalously large size and power requirements of the X-ray cavity in Abell 4059 suggest that the radio source was both larger and more powerful in the recent past; i.e., the previous outburst was an FR2. Also, on the basis of the interpretation put forward in this paper, the ICM of Abell 4059 could have been much less dense in the recent past than now, also making the cavity easier to create. On the basis of the current work, we predict that this one case is not unique, but that other, similar examples will be found with CHANDRA. Indeed, the “fat doubles” in our sample are ideal targets to search for such evidence since, from the “evolutionary hypothesis”, the most recent outburst of these sources is the first after a dense ICM has formed around them.
References
- Abramopoulos & Ku (1983) Abramopoulos, F. & Ku, W.H-M. 1983, ApJ, 271, 446
- Akujor & Garrington (1995) Akujor, C.E., & Garrington, S.T. 1995, A&AS, 112, 235
- Akujor, Spencer & Wilkinson (1990) Akujor, C.E., Spencer, R.E., & Wilkinson, P.N. 1990, MNRAS, 244, 362
- Akujor et al. (1991) Akujor, C.E., Spencer, R.E., Zhang, F.J., Davis, R.J., Browne, I.W.A., & Fanti, C. 1991, MNRAS, 250, 215
- Alexander (1987) Alexander, P. 1987, MNRAS, 225, 27
- Alexander & Leahy (1987) Alexander, P., & Leahy, J.P. 1987, MNRAS, 225, 1
- Antonucci (1985) Antonucci, R.R.J. 1985, ApJS, 59, 499
- Antonucci (1993) Antonucci, R.R.J. 1993 ARA&A, 31, 781
- Barthel (1989) Barthel, P.D. 1989, ApJ, 336, 606
- Baum et al. (1988) Baum, S.A., Heckman, T., Bridle, A., van Breugel, W., & Miley, G. 1988, ApJS, 68, 643
- Begelman, Blandford & Rees (1980) Begelman, M.C., Blandford, R.D., & Rees, M.J. 1980, Nature, 287, 307
- Begelman, Blandford & Rees (1984) Begelman, M.C., Blandford, R.D., & Rees, M.J. 1984, Rev.Mod.Phys., 56, 255
- Bicknell, Dopita & O’Dea (1997) Bicknell, G.V., Dopita, M.A., & O’Dea, C. 1997, ApJ, 485, 112
- Blandford & Znajek (1977) Blandford, R.D., & Znajek, R.L. 1977, MNRAS, 179, 433
- Blanton et al. (2000) Blanton, E.L., Gregg, M.D., Helfand, D.J., Becker, R.H., & White, R.L. 2000, ApJ, 531, 118
- Bogers et al. (1994) Bogers, W.J., Hes, R., Barthel, P.D., & Zensus, J.A. 1994, A&AS, 105, 91
- Bondi et al. (1996) Bondi, M., et al. 1996, A&A, 308, 415
- Branson et al. (1972) Branson, N.F.B.A., Elsmore, B., Pooley, G.G., & Ryle, M. 1972, MNRAS, 156, 377
- Bridle et al. (1989) Bridle, A.H., Fomalont, E.B., Byrd, G.G., & Valtonen, M.J. 1989, AJ, 97, 674
- Bridle et al. (1994) Bridle, A.H., Hough, D.H., Lonsdale, C.J., Burns, J.O., & Laing, R.A. 1994, AJ, 108, 766
- Bridle & Perley (1984) Bridle, A.H., & Perley, R.A. 1984, ARA&A, 22, 319
- Bridle, Perley & Henriksen (1986) Bridle, A.H., Perley, R.A., & Henriksen, R.N. 1986, AJ, 92, 534
- Browne et al. (1982a) Browne, I.W.A., Clark, R.R., Moore, P.K., Muxlow, T.W.B., Wilkinson, P.N., Cohen, M.H., & Porcas, R.W. 1982a, Nature, 299, 788
- Browne et al. (1982b) Browne, I.W.A., Orr, M.J.L., Davis, R.J., Foley, A., Muxlow, T.W.B., & Thomasson, P. 1982b, MNRAS, 198, 673
- Burns et al. (1984) Burns, J.O., Basart, J.P., De Young, D.S., & Ghiglia, D.C. 1984, ApJ, 283, 515
- Burns, Owen & Rudnick (1979) Burns, J.O., Owen, F.N., & Rudnick, L. 1979, AJ, 84, 1683
- Clarke et al. (1992) Clarke, D.A., Bridle, A.H., Burns, J.O., Perley, R.A., & Norman, M.L. 1992, ApJ, 385, 173
- Clarke & Burns (1991) Clarke, D.A., & Burns, J.O. 1991, ApJ, 369, 308
- Conway et al. (1993) Conway, R.G., Garrington, S.T., Perley, R.A., & Biretta, J.A. 1993, A&A, 267, 347
- Donahue et al. (1998) Donahue, M., Gioia, I.M., Luppino, G.A., Hughes, J.P., & Stocke, J.T. 1998, ApJ, 502, 550
- Downes et al. (1986) Downes, A.J.B., Peacock, J.A., Savage, A., & Carrie, D.R. 1986, MNRAS, 218, 31
- Dreher & Feigelson (1984) Dreher, J.W., & Feigelson, E.D. 1984, Nature, 308, 43
- Eilek et al. (1984) Eilek, J.A, Burns, J.O., O’Dea, C.P., & Owen, F.N. 1984, ApJ, 278, 37
- Eke, Cole & Frenk (1996) Eke, V.R., Cole, S., & Frenk, C.S. 1996, MNRAS, 252, 428
- Ellingson, Yee, & Green (1991) Ellingson, E., Yee, H.K.C., & Green, R.F. 1991, ApJ, 371, 49 (EYG)
- Falcke et al. (1995) Falcke, H., Gopal-Krishna, & Biermann, P.L. 1995 A&A, 298, 395
- Fanaroff & Riley (1974) Fanaroff, B.L., & Riley, J.M. 1974, MNRAS, 167, 31P (FR)
- Fanti et al. (1985) Fanti, C., Fanti, R., Parma, P., Schilizzi, R.T., & van Breugel, W.J.M. 1985, A&A, 143, 292
- Fanti et al. (1989) Fanti, C., et al. 1989, A&A, 217, 44
- Feretti et al. (1984) Feretti, L., Gioia, I.M., Giovannini, G., Gregorini, L., & Padrielli, L. 1984, A&A, 139, 50
- Fernini, Burns & Perley (1997) Fernini, I., Burns, J.O., & Perley, R.A. 1997, AJ, 114, 2292
- Fernini et al. (1991) Fernini, I., Leahy, J.P., Burns, J.O., & Basart, J.P. 1991, ApJ, 381, 63
- Garrington, Conway & Leahy (1991) Garrington, S.T., Conway, R.G., & Leahy, J.P. 1991, MNRAS, 250, 171
- Gioia & Luppino (1994) Gioia, I.M., & Luppino, G.A. 1994, ApJS, 94, 583
- Gioia et al. (1990) Gioia, I.M., Maccacaro, T., Schild, R.E., Wolter, A., Stocke, J.T., Morris, S.L., & Henry, J.P. 1990, ApJS, 72, 567
- Giovannini, Feretti & Gregorini (1987) Giovannini, G., Feretti, L., & Gregorini, L. 1987, A&AS, 69, 171
- Giovannini et al. (1988) Giovannini, G., Feretti, L., Gregorini, L., & Parma, P. 1988, A&A, 199, 73
- Giovannini et al. (1994) Giovannini, G., Feretti, L., Venturi, T., Lara, L., Marcaide, J., Rioja, M., Spangler, S.R., & Wehrle, A.E. 1994, ApJ, 435, 116
- Gizani & Leahy (1999) Gizani, N.A.B., & Leahy, J.P. 1999, New Astronomy Reviews, 43, 639
- Gower & Hutchings (1984) Gower, A.C., & Hutchings, J.B. 1984, AJ, 89, 1658
- Gregorini et al. (1988) Gregorini, L., Padrielli, L., Parma, P., & Gilmore, G. 1988, A&AS, 74, 107
- Hall et al. (1997) Hall, P.B., Ellingson, E., & Green, R.F. 1997, AJ, 113, 1179
- Hall et al. (1995) Hall, P.B., Ellingson, E., Green, R.F., & Yee, H.K.C. 1995, AJ, 110, 513
- Hardcastle et al. (1997) Hardcastle, M.J., Alexander, P., Pooley, G.G., & Riley, J.M. 1997, MNRAS, 288, 859
- Hardcastle & Worrall (1999) Hardcastle, M.J., & Worrall, D.M. 1999, MNRAS, 389, 969
- Hargrave & McEllin (1975) Hargrave, P.F., & McEllin, M. 1975, MNRAS, 173, 37
- Harris et al. (2000) Harris, D.E., et al. 2000, ApJ, 530, L81
- Harvanek (1999) Harvanek, M. 1999, Ph.D. thesis, University of Colorado, Boulder
- Harvanek et al. (2001) Harvanek, M., Ellingson, E., Stocke, J.T., & Rhee, G.H. 2001, AJ, in press (Paper 1)
- Harvanek & Hardcastle (1998) Harvanek, M., & Hardcastle, M.J. 1998, ApJS, 119, 25
- Heckman, van Breugel & Miley (1984) Heckman, T.M., van Breugel, W.J.M., & Miley, G.K. 1984, ApJ, 286, 509
- Heckman, Chambers & Postman (1992) Heckman, T, Chambers, K.C. & Postman, M.P. 1992 ApJ, 391, 39
- Heinz et al. (2002) Heinz S., Choi Y.Y., Reynolds C.S., Begelman M.C., 2002, ApJL, submitted
- Hes et al. (1996b) Hes, R., Barthel, P.D., & Hoekstra, H. 1995 A&A, 303, 8
- Hes et al. (1996a) Hes, R., Barthel, P.D., & Fosbury, R.A.E. 1993 Nature 362, 326
- Hill & Lilly (1991) Hill, G.J., & Lilly, S.J. 1991, ApJ, 367, 1 (HL)
- Hintzen & Scott (1978) Hintzen, P., & Scott, J.S. 1978, ApJ, 224, L47
- Hintzen, Ulvestad & Owen (1983) Hintzen, P., Ulvestad, J., & Owen, F. 1983, AJ, 88, 709
- Hutchings et al. (1998) Hutchings, J.B., Dewey, A., Chaytor, D., Ryneveld, S., Gower, A.C., & Ellingson, E. 1998, PASP, 110, 111
- Jackson & Browne (1990) Jackson, N. & Browne, I.W.A. 1990 Nature, 343, 43
- Jenkins, Pooley & Riley (1977) Jenkins, C.J., Pooley, G.G., & Riley, J.M. 1977, MmRAS, 84, 61
- Johnson, Leahy & Garrington (1995) Johnson, R.A., Leahy, J.P., & Garrington, S.T. 1995, MNRAS, 273, 877
- Katz-Stone & Rudnick (1997) Katz-Stone, D.M., & Rudnick, L. 1997, ApJ, 479, 258
- Kollgaard, Wardle & Roberts (1989) Kollgaard, R.I., Wardle, J.F.C., & Roberts, D.H. 1989, AJ, 97, 1550
- Kristian et al. (1974) Kristian, J., Sandage, A., & Katem, B. 1974, ApJ, 191, 43
- Kronberg & Reich (1983) Kronberg, P.P., & Reich, W. 1983, A&A, 125, 146
- Laing (1981) Laing, R.A. 1981, MNRAS, 195, 261
- Laing (1989) Laing, R. 1989, Hot Spots in Extragalactic Radio Sources, edited by K. Meisenheimer and H.-J. Röser (Springer, Berlin), p. 27
- Laing, Riley & Longair (1983) Laing, R.A., Riley, J.M. & Longair, M.S. 1983 MNRAS, 204, 151
- Laing et al. (1994) Laing, R.A., Jenkins, C.R., Wall, J.V. & Unger, S.W. 1994 in The Physics of AGN, edited by G.V. Bicknell, M.A. Dopita & P.J. Quinn (ASP: Provo), p. 201
- Leahy (1996) Leahy, J.P. 1996, Vistas in Astronomy, 40, 173
- Leahy et al. (1997) Leahy, J.P., Bridle, A.H., & Strom, R.G. 1997, at URL: http://www.jb.man.ac.uk/atlas/
- Leahy, Muxlow & Stephens (1989) Leahy, J.P., Muxlow, T.W.B., & Stephens, P.W. 1989, MNRAS, 239, 401
- Leahy & Perley (1991) Leahy, J.P., & Perley, R.A. 1991, AJ, 102, 537
- Leahy, Pooley & Riley (1986) Leahy, J.P., Pooley, G.G., & Riley, J.M. 1986, MNRAS, 222, 753
- Leahy & Williams (1984) Leahy, J.P., & Williams, A.G. 1984, MNRAS, 210, 929
- Lilly & Prestage (1987) Lilly, S.J., & Prestage, R.M. 1987, MNRAS, 225, 531
- Liu & Pooley (1990) Liu, R., & Pooley, G. 1990, MNRAS, 245, 17P
- Liu & Pooley (1991a) Liu, R., & Pooley, G. 1991a, MNRAS, 249, 343
- Liu & Pooley (1991b) Liu, R., & Pooley, G. 1991b, MNRAS, 253, 669
- Liu, Pooley & Riley (1992) Liu, R., Pooley, G., & Riley, J.M. 1992, MNRAS, 257, 545
- Longair & Seldner (1979) Longair, M., & Seldner, M. 1979, MNRAS, 189, 433
- Lonsdale & Morison (1983) Lonsdale, C.J., & Morison, I. 1983, MNRAS, 203, 833
- Maccacaro et al. (1994) Maccacaro, T., Wolter, A., McClean, B., Gioia, I.M., Stocke, J.T., Della Ceca, R., Burg, R., & Faccini, R. 1994, Astrophys. Lett. Commun., 29, 267
- Macdonald, Kenderdine & Neville (1968) Macdonald, G.H., Kenderdine, S., & Neville, A.C. 1968, MNRAS, 138, 259
- Mackay (1969) Mackay, C.D. 1969, MNRAS, 145, 31
- Mantovani et al. (1992) Mantovani, F., Junor, W., Fanti, R., Padrielli, L., Browne, I.W.A., & Muxlow, T.W.B. 1992, MNRAS, 257, 353
- Mantovani et al. (1997) Mantovani, F., Junor, W., Fanti, R., Padrielli, L., & Saikia, D.J. 1997, A&AS, 125, 573
- Mantovani et al. (1990) Mantovani, F., Saikia, D.J., Browne, I.W.A., Fanti, R., Muxlow, T.W.B., & Padrielli, L. 1990, MNRAS, 245, 427
- McCarthy, van Breugel & Kapahi (1991) McCarthy, P.J., van Breugel, W., & Kapahi, V.K. 1991, ApJ, 371, 478
- McCarthy, van Breugel & Spinrad (1989) McCarthy, P.J., van Breugel, W., & Spinrad, H. 1989, AJ, 97, 36
- Meisenheimer et al. (2001) Meisenheimer, K., Haas, M., Muller, S.A.H., Chini, R., Klaas, U. & Lemke, D. 2001, A&A, 372, 719
- Miller, Rawlings & Saunders (1993) Miller, P., Rawlings, S., & Saunders, R. 1993, MNRAS, 263, 425
- Morganti, Killeen & Tadhunter (1993) Morganti, R., Killeen, N.E.B., & Tadhunter, C.N. 1993, MNRAS, 263, 1023
- Morse (1994) Morse, J.A. 1994, PASP, 106, 675
- Myers & Spangler (1985) Myers, S.T., & Spangler, S.R. 1985, ApJ, 291, 52
- Neff, Roberts & Hutchings (1995) Neff, S.G., Roberts, L., & Hutchings, J.B. 1995, ApJS, 99, 349
- Ogle et al. (1997) Ogle, P.M., Cohen, M.H., Miller, J.S., Tran, H.D., Fosbury, R.A.E. & Goodrich, R.W. 1997 ApJ, 482, L37
- Owen (1975) Owen, F.N. 1975, AJ, 80, 263
- Owen & Laing (1989) Owen, F.N., & Laing, R.A. 1989, MNRAS, 238, 357
- Owen, Ledlow & Keel (1996) Owen, F.N., Ledlow, M.J. & Keel, W.C. 1996, AJ, 111, 53
- Owen et al. (1997) Owen, F.N., Ledlow, M.J., Morrison, G.E., & Hall, J.M. 1997, ApJ, 488, L15
- Owen & Rudnick (1976) Owen, F.N., & Rudnick, L.E. 1976, ApJ, 205, L1
- Owen & White (1991) Owen, F.N., & White, R.A. 1991, MNRAS, 249, 164
- Pearson, Perley & Readhead (1985) Pearson, T.J., Perley, R.A., & Readhead, A.C.S. 1985, AJ, 90, 738
- Pedelty et al. (1989) Pedelty, J.A., Rudnick, L., McCarthy, P.J., & Spinrad, H. 1989, AJ, 98, 1232
- Perley et al. (1980) Perley, R.A., Bridle, A.H., Willis, A.G., & Fomalont, E.B. 1980, AJ, 85, 499
- Perley, Fomalont & Johnston (1980) Perley, R.A., Fomalont, E.B., & Johnston, K.J. 1980, AJ, 85, 469
- Perley & Taylor (1991) Perley, R.A., & Taylor, G.B. 1991, AJ, 101, 1623
- Perrenod (1978) Perrenod, S.C. 1978, ApJ, 226, 566
- Pooley & Henbest (1974) Pooley, G.G., & Henbest, S.N. 1974, MNRAS, 169, 477
- Prestage & Peacock (1988) Prestage, R.M., & Peacock, J.A. 1988, MNRAS, 230, 131
- Price et al. (1993) Price, R., Gower, A.C., Hutchings, J.B., Talon, S., Duncan, D., & Ross, G. 1993, ApJS, 86, 365
- Rantakyrö, Bååth & Matveenko (1995) Rantakyrö, F.T., Bååth, L.B., & Matveenko, L. 1995, A&A, 293, 44
- Rantakyrö et al. (1992) Rantakyrö, F.T., Bååth, L.B., Pauliny-Toth, I.I.K., Matveyenko, L.I., & Unwin, S.C. 1992, A&A, 259, 8
- Rector et al. (1995) Rector, T.A., Stocke, J.T., & Ellingson, E. 1995, AJ, 110, 1492
- Rector et al. (1999) Rector, T.A., Stocke, J.T., & Perlman, E.S. 1999, ApJ, 145, 162
- Reid et al. (1995) Reid, A., Shone, D.L., Akujor, C.E., Browne, I.W.A., Murphy, D.W., Pedelty, J., Rudnick, L., & Walsh, D. 1995, A&AS, 110, 213
- Rendong et al. (1991) Rendong, N., Schilizzi, R.T., Fanti, C., & Fanti, R. 1991, A&A, 252, 513
- Reynolds, Heinz & Begelman (2001) Reynolds, C.S., Heinz, S., & Begelman, M.C. 2001, ApJ, 549, L179
- Rhee et al. (1996) Rhee, G., Marvel, K., Wilson, T., Roland, J., Bremer, M., Jackson, N., & Webb, J. 1996, ApJS, 107, 175
- Riley & Pooley (1975) Riley, J.M., & Pooley, G.G. 1975, MmRAS, 80, 105
- Rocca-Volmerange et al. (1994) Rocca-Volmerange, B., Adam, G., Ferruit, P., & Bacon, R. 1994, A&A, 292, 20
- Roettiger, Loken & Burns (1997) Roettiger, K., Loken, C., & Burns, J.O. 1997, ApJS, 109, 307
- Roos (1981) Roos, N. 1981, A&A, 104, 218
- Rosati et al. (1998) Rosati, P., Della Ceca, R., Norman, C., & Giacconi, R. 1998, ApJ, 492, L21
- Rudnick & Adams (1979) Rudnick, L., & Adams, M.T. 1979, AJ, 84, 437
- Sanghera et al. (1995) Sanghera, H.S., Saikia, D.J., Ludke, E., Spencer, R.E., Foulsham, P.A., Akujor, C.E., & Tzioumis, A.K. 1995, A&A, 295, 629
- Sarazin (1986) Sarazin, C.L. 1986, Rev.Mod.Phys., 58, 1
- Schilizzi & de Bruyn (1983) Schilizzi, R.T., & de Bruyn, A.G. 1983, Nature, 303, 26
- Simon et al. (1990) Simon, R.S., Readhead, A.C.S., Moffet, A.T., Wilkinson, P.N., Booth, R., Allen, B., & Burke, B.F. 1990, ApJ, 354, 140
- Singal (1993) Singal, A.K., 1993 MNRAS, 263, 139
- Smith et al. (1976) Smith, H. E., Spinrad, H., & Smith, E. O. 1976, PASP, 88, 621
- Spangler, Myers & Pogge (1984) Spangler, S.R., Myers, S.T., & Pogge, J.J. 1984, AJ, 89, 1478
- Spangler & Pogge (1984) Spangler, S.R., & Pogge, J.J. 1984, AJ, 89, 342
- Spangler & Sakurai (1985) Spangler, S.R., & Sakurai, T. 1985, ApJ, 297, 84
- Spencer et al. (1989) Spencer, R.E., McDowell, J.C., Charlesworth, M., Fanti, C., Parma, P., & Peacock, J.A. 1989, MNRAS, 240, 657
- Spencer et al. (1991) Spencer, R.E., et al. 1991, MNRAS, 250, 225
- Spinrad et al. (1985) Spinrad, H., Djorgovski, S., Marr, J., & Aguilar, L. 1985, PASP, 97, 932
- Spinrad et al. (1991) Spinrad, H., et al. 1991, electronic version of The Revised 3C Catalog of Radio Sources.
- Stocke (1978) Stocke, J.T. 1978, AJ, 83, 348
- Stocke et al. (1985) Stocke, J.T., Burns, J.O., & Christiansen, W.A. 1985, ApJ, 299, 799
- Stocke et al. (1991) Stocke, J.T., Morris, S.L., Gioia, I.M., Maccacaro, T., Schild, R.E., Fleming, T.A., & Henry, J.P. 1991, ApJS, 76, 813
- Stocke et al. (1999) Stocke, J.T., Perlman, E.S., Gioia, I.M., & Harvanek, M. 1999, AJ, 117, 1967
- Stocke & Perrenod (1981) Stocke, J.T., & Perrenod, S.C. 1981, ApJ, 245, 375
- Strom et al. (1990) Strom, R.G., Riley, J.M., Spinrad, H., van Breugel, W.J.M., Djorgovski, S., Liebert, J., & McCarthy, P.J. 1990, A&A, 227, 19
- Swarup, Sinha & Hilldrup (1984) Swarup, G., Sinha, R.P., & Hilldrup, K. 1984, MNRAS, 208, 813
- Taylor & Perley (1992) Taylor, G.B., & Perley, R.A. 1992, A&A, 262, 417
- Ulvestad (1985) Ulvestad, J.S. 1985, ApJ, 288, 514
- Unwin & Wehrle (1992) Unwin, S.C., & Wehrle, A.E. 1992, ApJ, 398, 74
- Urry & Padovani (1985) Urry, C.M. & Padovani, P. 1985, PASP, 715, 803
- van Breugel et al. (1992) van Breugel, W.J.M., Fanti, C., Fanti, R., Stanghellini, C., Schilizzi, R.T., & Spencer, R.E. 1992, A&A, 256, 56
- van Breugel, Miley & Heckman (1984) van Breugel, W., Miley, G., & Heckman, T. 1984, AJ, 89, 5
- Vigotti et al. (1989) Vigotti, M., Grueff, G., Perley, R., Clark, B.G., & Bridle, A.H. 1989, AJ, 98, 419
- Waak et al. (1988) Waak, J.A., Simon, R.S., Spencer, J.H., & Johnston, K.J. 1988, AJ, 95, 1023
- Wan & Daly (1996) Wan, L., & Daly, R.A. 1996, ApJ, 467, 145
- Wilkinson et al. (1991) Wilkinson, P.N., Tzioumis, A.K., Benson, J.M., Walker, R.C., Simon, R.S., & Kahn, F.D. 1991, Nature, 352, 313
- Wilson & Colbert (1995) Wilson, A.S., & Colbert, E.J.M. 1995, ApJ, 486, 62
- Worrall & Birkinshaw (2001) Worrall, D.M., & Birkinshaw, M. 2001, ApJ, 551, 178
- Worrall et al. (2002) Worrall, D.M., Birkinshaw, M., Hardcastle, M.J. & Lawrence, C.R. 2001, MNRAS, 326, 1127
- Yee & Ellingson (1993) Yee, H.K.C., & Ellingson, E. 1993, ApJ, 411, 43
- Yee & Ellingson (2002) Yee, H.K.C., & Ellingson, E. 2002, in preparation
- Zensus, Cohen & Unwin (1995) Zensus, J.A., Cohen, M.H., & Unwin, S.C. 1995, ApJ, 443, 35
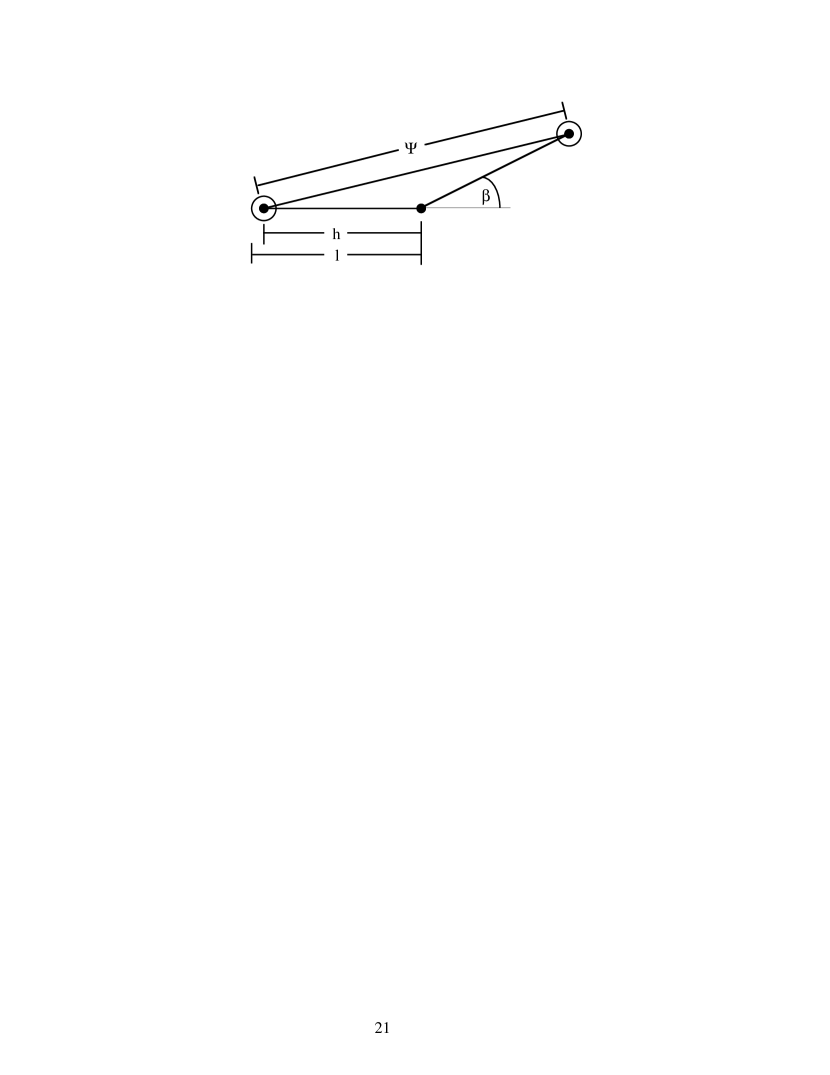


![[Uncaptioned image]](/html/astro-ph/0207304/assets/x10.png)
![[Uncaptioned image]](/html/astro-ph/0207304/assets/x11.png)


![[Uncaptioned image]](/html/astro-ph/0207304/assets/x14.png)
![[Uncaptioned image]](/html/astro-ph/0207304/assets/x15.png)


![[Uncaptioned image]](/html/astro-ph/0207304/assets/x18.png)
![[Uncaptioned image]](/html/astro-ph/0207304/assets/x19.png)


| Source | LAS | Size | Ref., | Size | Ref., | Ref., | Other Radio Refs. | |||||
|---|---|---|---|---|---|---|---|---|---|---|---|---|
| (3CR#) | (′′) | (kpc) | Band | (′′) | (kpc) | (∘) | Band | Band | ||||
| (1) | (2) | (3) | (4) | (5) | (6) | (7) | (8) | (9) | (10) | (11) | (12) | (13) |
| 16.0 | 0.406 | 80.3 | 577 | 41,X | 70.7 | 507 | 13: | 62,L | 2.1: | 0.91: | 62,L | 62,83,46,12,60,41 |
| 17.0 | 0.2197 | 60.0 | 286 | 80,C | 18.0 | 86 | 36 | 107,C | 1.6* | 0.47 | 107,L | 107,80,116 |
| 18.0 | 0.188 | 65.8 | 279 | 80,C | 51.9 | 220 | 25 | 116,L | 1.2 | 0.85 | 116,L | 107,80,116 |
| 19.0 | 0.482 | 7.5 | 59 | 73,X | 6.5 | 51 | 8 | 60,L | 1.0 | 0.90 | 60,L | 46,73,60,116 |
| 28.0 | 0.1952 | 50.2 | 219 | 33,C | 32.8 | 143 | 19: | 58,L | 1.1: | 0.73: | 58,L | 107,96,72,29,33,58,116,60 |
| 42.0 | 0.395 | 33.2 | 235 | 62,L | 28.9 | 204 | 7 | 30,C | 1.0 | 0.86 | 62,L | 72,62,46,60,30 |
| 46.0 | 0.4373 | 174.4 | 1308 | 37,L | 150.6 | 1130 | 7 | 60,L | 1.5 | 0.87 | 60,L | 71,46,37,60,82,119 |
| 47.0 | 0.425 | 79.3 | 585 | 59,L | 69.7 | 514 | 5 | 59,L | 1.2 | 0.91 | 59,L | 71,89,14,21,31,90,16,60,59 |
| 48.0 | 0.367 | 0.9 | 6 | 121,L | — | — | — | 121,L | — | — | 3,118,83,117,105,90,94,101,60,121,1 | |
| 49.0 | 0.621 | 1.2 | 11 | 99,C | 1.0 | 9 | 21 | 99,C | 2.3 | 0.83 | 99,C | 3,83,117,105,27,28,94,99,82 |
| 61.1 | 0.186 | 200.2 | 841 | 62,L | 185.5 | 780 | 8 | 62,L | 1.2 | 0.92 | 62,L | 107,71,14,40,56,62,60,82,5 |
| 63.0 | 0.175 | 45.2 | 181 | 41,X | 18.9 | 76 | 4 | 116,C | 1.4* | 0.65 | 41,L | 10,116,41,95,113 |
| 67.0 | 0.3102 | 3.2 | 19 | 52,X | 2.5 | 15 | 2 | 99,C | 2.3 | 0.78 | 99,L | 3,118,83,117,105,27,94,48,51,70,60,99,1,53,52,49 |
| 79.0 | 0.2559 | 91.1 | 485 | 102,L | 87.3 | 465 | 10 | 38,X | 1.3 | 0.95 | 102,L | 107,96,71,102,7,38,60,39 |
| 93.0 | 0.358 | 39.4 | 262 | 12,L | 33.0 | 220 | 10 | 12,X | 1.1 | 0.83 | 12,L | 90,12,50 |
| 93.1 | 0.244 | 1.5 | 8 | 105,L | — | — | — | 105,L | — | — | 3,105,83,1 | |
| 99.0 | 0.426 | 5.8 | 43 | 76,L | 4.4 | 32 | 2 | 75,X | 4.7 | 0.78 | 76,L | 76,73,82,75 |
| 109.0 | 0.3056 | 101.7 | 611 | 35,L | 93.5 | 562 | 13 | 35,L | 1.0 | 0.95 | 35,L | 96,71,14,56,10,7,60,35 |
| 142.1 | 0.4061 | 54.5 | 391 | 12,L | 49.6 | 356 | 7 | 12,X | 2.0 | 0.90 | 12,L | 12,9,116 |
| 169.1 | 0.633 | 57.9 | 526 | 41,X | 45.9 | 417 | 18 | 41,X | 1.5* | 0.70 | 41,L | 72,115,41,82 |
| 171.0 | 0.2384 | 35.1 | 178 | 107,L | 9.0 | 45 | 4 | 42,U | 1.1 | 0.63 | 42,L | 107,89,56,42,10,7,38,116,60,82,39,34 |
| 173.1 | 0.292 | 63.1 | 368 | 62,L | 58.5 | 341 | 4 | 38,X | 1.2 | 0.93 | 62,L | 107,71,62,46,38,60,39,34 |
| 196.1 | 0.198 | 10.0 | 44 | 82,L | — | — | — | 82,L | — | — | 10,82 | |
| 200.0 | 0.458 | 27.3 | 210 | 12,L | 14.5 | 111 | 7 | 60,C | 1.4* | 0.54 | 12,L | 21,32,46,37,12,60 |
| 213.1 | 0.194 | 45.7 | 198 | 37,L | 5.9 | 26 | 10 | 1,X | 2.2 | 0.19 | 1,L | 107,3,105,37,1 |
| 215.0 | 0.411 | 63.6 | 460 | 32,L | 29.9 | 216 | 42 | 16,C | 2.2* | 0.65 | 45,L | 72,89,14,32,43,110,90,16,44,60,45 |
| 219.0 | 0.1744 | 205.1 | 820 | 119,L | 147.9 | 591 | 10 | 22,L | 1.0 | 0.81 | 22,L | 71,14,18,86,23,22,60,82,119 |
| 220.1 | 0.620 | 45.5 | 409 | 41,L | 30.1 | 271 | 2 | 21,C | 1.3 | 0.88 | 21,C | 71,21,46,41 |
| 225.0B | 0.582 | 6.3 | 55 | 34,C | 5.0 | 43 | 10: | 34,C | 2.0: | 0.79: | 34,C | 71,14,46,9,116,34 |
| 228.0 | 0.5524 | 51.1 | 435 | 47,L | 46.1 | 392 | 0 | 47,L | 1.2 | 0.91 | 47,L | 72,21,46,116,47 |
| 234.0 | 0.1848 | 123.2 | 515 | 63,L | 110.7 | 463 | 10 | 38,X | 1.4 | 0.89 | 63,L | 96,71,64,21,38,60,63,82,39,116,6,4 |
| 244.1 | 0.428 | 61.8 | 458 | 64,L | 52.2 | 387 | 4 | 30,C | 1.2 | 0.81 | 64,L | 71,64,56,46,58,60,63,82,34,30,6 |
| 249.1 | 0.311 | 50.0 | 304 | 61,L | 23.5 | 143 | 9 | 79,C | 2.0* | 0.53 | 61,L | 72,89,21,79,61,69,16,60 |
| 263.0 | 0.646 | 59.8 | 548 | 45,L | 43.9 | 402 | 1 | 16,C | 1.7* | 0.78 | 45,L | 71,89,61,16,12,93,45 |
| 268.2 | 0.362 | 113.2 | 758 | 41,L | 96.4 | 646 | 6 | 82,L | 1.0 | 0.85 | 41,L | 96,71,109,41,82 |
| 268.3 | 0.371 | 1.9 | 13 | 27,L | 1.4 | 9 | 15 | 70,C | 3.1 | 0.75 | 70,C | 3,118,83,105,27,94,70,60,1,82 |
| 273.0 | 0.158 | 25.2 | 93 | 24,L | — | — | — | 24,L | — | — | 87,24,19,55 | |
| 274.1 | 0.422 | 170.5 | 1253 | 63,L | 150.2 | 1104 | 3: | 64,L | 1.1: | 0.90: | 64,L | 71,64,109,46,60,63,6 |
| 275.0 | 0.480 | 6.8 | 54 | 74,C | 5.4 | 42 | 11: | 74,C | 2.4: | 0.78: | 74,C | 10,74,73,9,116,75 |
| 275.1 | 0.557 | 36.0 | 307 | 45,L | 15.6 | 133 | 21 | 108,C | 1.6 | 0.58 | 68,L | 32,108,65,46,68,66,12,57,45 |
| 277.0 | 0.414 | 158.8 | 1154 | 41,L | 131.9 | 958 | 5 | 41,L | 1.7 | 0.83 | 41,L | 71,109,116,41 |
| 277.1 | 0.320 | 2.4 | 15 | 99,L | 1.6 | 10 | 0 | 99,L | 2.5 | 0.63 | 99,L | 3,118,83,105,93,116,99,1 |
| 284.0 | 0.2394 | 190.5 | 966 | 63,L | 174.4 | 885 | 2 | 38,X | 1.5 | 0.91 | 64,L | 107,96,71,64,37,38,60,63,39,6 |
| 287.1 | 0.2159 | 139.4 | 656 | 41,L | 112.1 | 527 | 6 | 107,C | 1.4 | 0.85 | 41,L | 107,7,25,41 |
| 288.0 | 0.246 | 36.0 | 186 | 15,L | 14.9 | 77 | 17 | 15,C | 1.5* | 0.46 | 15,L | 89,15,98,68,66,60 |
| 295.0 | 0.4614 | 6.2 | 48 | 2,L | 4.7 | 36 | 2 | 111,U | 1.5 | 0.78 | 88,X | 89,56,2,10,111,116,60,88 |
| 299.0 | 0.367 | 12.9 | 87 | 68,C | 11.7 | 79 | 5 | 60,L | 3.0* | 0.74 | 68,L | 3,106,67,118,83,115,117,105,94,68,66,116,60,1 |
| 300.0 | 0.270 | 107.4 | 593 | 63,L | 99.0 | 547 | 5 | 38,X | 2.4 | 0.88 | 64,L | 107,96,71,64,38,116,60,63,39,6 |
| Radio Structure Parameters (continued) | ||||||||||||
| Source | LAS | Size | Ref., | Size | Ref., | Ref., | Other Radio Re fs. | |||||
| (3CR#) | (′′) | (kpc) | Band | (′′) | (kpc) | (∘) | Band | Band | ||||
| (1) | (2) | (3) | (4) | (5) | (6) | (7) | (8) | (9) | (10) | (11) | (12) | (13) |
| 303.1 | 0.267 | 2.7 | 15 | 83,C | 1.7 | 9 | 3: | 1,X | 1.0: | 0.70: | 1,X | 3,83,117,105,27,94,99,1 |
| 306.1 | 0.441 | 108.0 | 814 | 41,L | 91.8 | 692 | 0 | 116,C | 1.1 | 0.83 | 41,L | 115,116,41 |
| 313.0 | 0.461 | 135.1 | 1044 | 10,C | 127.1 | 982 | 1 | 12,X | 1.3 | 0.97 | 12,X | 71,10,12,9 |
| 319.0 | 0.192 | 112.1 | 483 | 64,L | 65.9 | 284 | 17: | 64,L | 2.4: | 0.62: | 64,L | 71,64,46,38,60,63,39,6 |
| 320.0 | 0.342 | 37.2 | 240 | 41,X | 15.3 | 99 | 7 | 41,X | 1.2* | 0.46? | 37,L | 72,37,98,41 |
| 323.1 | 0.264 | 76.2 | 414 | 36,L | 70.2 | 382 | 1 | 79,C | 1.4 | 0.91 | 12,L | 71,89,14,79,110,36,12 |
| 327.1 | 0.4628 | 20.8 | 161 | 12,L | 14.3 | 111 | 23 | 12,X | 2.0 | 0.74 | 12,L | 10,80,12,116 |
| 330.0 | 0.550 | 73.8 | 626 | 61,L | 61.7 | 524 | 3 | 30,C | 1.1* | 0.83 | 61,L | 71,56,61,77,46,58,30 |
| 332.0 | 0.1515 | 101.0 | 361 | 107,L | 69.8 | 249 | 12 | 107,C | 1.1 | 0.70 | 107,L | 107,96,71,14,7,98,116 |
| 334.0 | 0.555 | 61.8 | 527 | 61,L | 45.7 | 390 | 4 | 16,C | 1.6 | 0.78 | 61,L | 71,32,61,43,46,90,16,12,45 |
| 337.0 | 0.635 | 47.7 | 434 | 85,L | 42.6 | 388 | 2 | 85,C | 1.8 | 0.90 | 85,L | 71,14,46,85,84,11 |
| 341.0 | 0.448 | 79.8 | 607 | 62,L | 71.1 | 540 | 7 | 17,C | 1.3* | 0.90 | 62,L | 71,62,46,17,37,60 |
| 345.0 | 0.594 | 29.7 | 262 | 100,C | — | — | — | 100,C | — | — | 83,20,54,114,13,19,100,45,120,122,91,92,55 | |
| 346.0 | 0.161 | 17.5 | 66 | 117,L | 7.8 | 29 | 9 | 1,L | 2.6* | 0.48 | 117,L | 107,89,3,106,117,10,116,60,1 |
| 348.0 | 0.154 | 201.7 | 730 | 41,L | 109.8 | 397 | 8 | 41,L | 1.1 | 0.55 | 41,L | 26,116,41 |
| 349.0 | 0.205 | 89.4 | 404 | 38,X | 83.9 | 379 | 2 | 38,X | 1.1 | 0.94 | 62,L | 107,71,56,62,46,38,60,39 |
| 351.0 | 0.371 | 76.2 | 518 | 62,L | 63.2 | 430 | 5 | 62,L | 1.3 | 0.91 | 62,L | 96,72,14,56,79,61,62,90,16,93,60 |
| 357.0 | 0.1664 | 117.6 | 453 | 41,L | 75.5 | 291 | 17 | 41,C | 1.4 | 0.72 | 41,L | 107,96,71,116,41 |
| 379.1 | 0.256 | 88.1 | 469 | 104,C | 76.1 | 405 | 0 | 104,L | 1.3 | 0.92 | 104,L | 107,71,40,56,104,81 |
| 381.0 | 0.1605 | 83.5 | 312 | 62,L | 68.9 | 258 | 3 | 62,L | 1.1 | 0.90 | 62,L | 107,96,71,14,56,62,7,38,60,39 |
| 401.0 | 0.201 | 26.4 | 118 | 41,L | 14.7 | 66 | 10 | 60,L | 1.4* | 0.53 | 41,L | 72,14,21,56,46,38,60,41,39 |
| 411.0 | 0.467 | 31.9 | 248 | 103,L | 27.2 | 211 | 2 | 82,C | 1.0 | 0.87 | 82,L | 89,103,82 |
| 427.1 | 0.572 | 32.8 | 284 | 61,L | 21.2 | 184 | 12 | 57,C | 1.2 | 0.77 | 82,L | 71,89,14,56,61,58,57,82 |
| 434.0 | 0.322 | 21.3 | 132 | 41,X | 13.1 | 81 | 1 | 41,L | 1.1 | 0.72 | 41,L | 89,41 |
| 435.0A | 0.471 | 15.5 | 121 | 78,L | 11.5 | 90 | 11 | 82,C | 1.4 | 0.74 | 78,L | 72,78,116,82,97 |
| 436.0 | 0.2145 | 127.1 | 595 | 113,L | 100.7 | 471 | 2 | 60,L | 1.3 | 0.81 | 113,L | 107,96,71,38,60,39,113 |
| 455.0 | 0.5427 | 4.7 | 40 | 105,L | 3.2 | 27 | 19 | 12,X | 2.7 | 0.73 | 12,X | 3,46,105,12,50,8,116,1,45 |
| 456.0 | 0.2330 | 12.0 | 60 | 41,L | 8.1 | 40 | 1 | 41,C | 1.1* | 0.62 | 41,L | 107,41 |
| 458.0 | 0.290 | 232.2 | 1347 | 116,L | 190.3 | 1104 | 14 | 107,C | 1.2 | 0.78 | 116,L | 107,116 |
| 459.0 | 0.2199 | 12.6 | 60 | 41,L | 8.3 | 40 | 5 | 116,U | 5.0* | 0.65 | 41,L | 112,80,116,41,95 |
| 460.0 | 0.268 | 8.6 | 47 | 116,L | 5.1 | 28 | 2 | 116,U | 5.0* | 0.60 | 116,L | 107,89,56,116,34,116 |
| EMSS | Bgg | Comments | |
|---|---|---|---|
| Cluster | (Mpc1.77) | ||
| MS0011.7+0837 | 0.163 | 1028. | |
| MS0015.9+1609∗ | 0.546 | 2350. | Yee |
| MS0026.4+0725 | 0.170 | 708. | |
| MS0109.4+3910 | 0.208 | 527. | |
| MS0147.8-3941 | 0.373 | 703. | |
| MS0159.1+0330 | 0.165 | 567. | |
| MS0302.5+1717∗ | 0.425 | 564. | Yee |
| MS0302.7+1658∗ | 0.426 | 1163. | |
| MS0353.6-3642 | 0.320 | 1188. | |
| MS0418.3-3844 | 0.350 | 672. | |
| MS0433.9+0957 | 0.159 | 1092. | |
| MS0440.5+0204 | 0.190 | 906. | Yee |
| MS0451.5+0250 | 0.202 | 1275. | Yee |
| MS0451.6-0305∗ | 0.545 | 2664. | Yee |
| MS0735.6+7421 | 0.216 | 715. | CF |
| MS0810.5+7433 | 0.282 | 697. | |
| MS0811.6+6301∗ | 0.312 | 725. | |
| MS0821.5+0337∗ | 0.347 | 651. | |
| MS0839.8+2938 | 0.194 | 1203. | Yee; CF |
| MS0849.7-0521 | 0.192 | 618. | |
| MS0906.5+1110 | 0.180 | 1238. | |
| MS1004.2+1238 | 0.166 | 554. | |
| MS1006.0+1202 | 0.221 | 1554. | Yee |
| MS1008.1-1224∗ | 0.301 | 1758. | Yee |
| MS1020.7+6820 | 0.203 | 623. | |
| MS1054.4-0321∗ | 0.823 | 1529. | |
| MS1125.3+4324 | 0.181 | 507. | |
| MS1137.5+6625∗ | 0.782 | 1400. | |
| MS1147.3+1103∗ | 0.303 | 828. | |
| MS1201.5+2824 | 0.167 | 782. | |
| MS1208.7+3928∗ | 0.340 | 784. | |
| MS1219.9+7542 | 0.240 | 641. | |
| MS1224.7+2007∗ | 0.327 | 724. | Yee |
| MS1231.3+1542 | 0.238 | 1180. | Yee; CF |
| MS1241.5+1710∗ | 0.555 | 1500. | |
| MS1244.2+7114 | 0.225 | 1036. | |
| MS1253.9+0456 | 0.230 | 948. | |
| MS1305.4+2941 | 0.241 | 672. | |
| MS1308.8+3244 | 0.245 | 740. | |
| MS1335.2-2928 | 0.189 | 643. | |
| MS1358.4+6245∗ | 0.327 | 1601. | Yee; CF |
| MS1401.9+0437 | 0.230 | 541. | |
| MS1409.9-0255 | 0.221 | 585. | |
| MS1421.0+2955 | 0.261 | 662. | |
| MS1426.4+0158∗ | 0.320 | 1020. | |
| MS1455.0+2232 | 0.259 | 508. | Yee; CF |
| MS1512.4+3647∗ | 0.372 | 540. | Yee; CF |
| MS1532.5+0130∗ | 0.320 | 714. | |
| MS1546.8+1132 | 0.226 | 921. | |
| MS1617.1+3237 | 0.274 | 618. | |
| MS1618.9+2552 | 0.161 | 817. | |
| MS1621.5+2640∗ | 0.426 | 1496. | Yee |
| MS1910.5+6736 | 0.246 | 1099. | |
| MS2053.7-0449∗ | 0.583 | 1239. | |
| MS2137.3-2353 | 0.313 | 1917. | |
| MS2142.7+0330 | 0.239 | 672. | |
| MS2255.7+2039 | 0.288 | 786. | |
| MS2301.5+1506 | 0.247 | 968. | |
| MS2318.7-2328 | 0.187 | 1334. |