Massive Stars and The Creation of our Galactic Center
Abstract
Our Galactic Center hosts over 10% of the known massive stars in the Galaxy. The majority of these stars are located in three particularly massive clusters that formed within the past 5 Myr. While these clusters are extraordinary, their formation repesents about half of the total inferred star formation rate in the Galactic Center. There is mounting evidence that the clusters are just present-day examples of the hundreds of such similar clusters that must have been created in the past, and whose stars now comprise the bulk of all stars seen in the region. I discuss the massive stellar content in the Galactic Center and present a new analysis that suggests that effects of continuous star formation in the Galactic Center can be seen in the observed luminosity functions newly-obtained HST/NICMOS and Gemini AO data.
STScI, 3700 San Martin Drive, Baltimore, MD 21218
JHU, 34th and Charles Street, Baltimore, MD 21218
1. Introduction
Over 10% of the known massive stars (Minit20 M⊙) in the Galaxy reside in three clusters of young stars located within 30 pc of the Galactic Center. These clusters are the most massive young clusters in the Galaxy and contain approximately 30 Wolf-Rayet (WR) stars, at least 2 Luminous Blue Variables (LBV), approximately a half dozen red supergiants, and approximately 300 O stars. Together, they emit enough ionizing radiation to account for roughly half of the thermal radio emission in the central few degrees of the Galaxy, suggesting that the young clusters contain approximately half of the stars recently formed in this region. An additional collection of young stars exists in the region, with members scattered about the central 50 pc; some have evolved to the WR stage, while others are still deeply embedded within their natal dust cacoons.
The current star formation rate can be approximated by dividing the mass in newly formed stars by their ages, i.e. 5(104) M⊙/5 Myr0.01 M⊙/yr, or a star formation rate density of 10-7 M⊙/yr pc-3. This rate is approximately 250 times higher than the mean rate in the Galaxy, and about the same factor lower than the rate in starburst galaxies. Clearly, the Galactic Center has formed a plethora of stars in the past 5 Myr, but it is less apparent when the millions of stars in the central 50 pc formed. If we assume that the star formation rate in the past was similar to the present rate, then the total mass of stars formed over the past 10 Gyr is 108 M⊙ within a radius of 30 pc of the Galactic Center, or an order of magnitude greater than this amount over the whole Central Molecular Zone, as first suggested by Serabyn & Morris (1996).
This review summarizes the current state of knowledge concerning the massive stars in the Galactic Center, and the history of star formation therein.
2. The Central Cluster
The first young stars discovered in the GC are within the central parsec of the Galaxy (Becklin & Neugebauer 1968). Rieke & Lebofsky (1982) and Lebofsky, Rieke, & Tokunaga (1983) confirmed the identification of blue and red supergiants in the region, claiming that these stars formed in a burst of star formation 1 Myr ago and that their presence could account for the nearby ionized gas and heated dust. Forrest et al. (1987) discovered a blue supergiant in the center having a broad Brackett- emission line, and Allen, Hyland, & Hillier (1990) identified this same star as having a spectrum similar to those for evolved massive stars in the Magellanic Clouds. Further studies discovered that many of the blue supergiants are evolved massive stars with spectra having prominent He i emission lines, firmly establishing a starburst event roughly 5 Myr ago (Krabbe et al. 1991; 1995, Allen 1994, Rieke & Rieke 1994, Blum et al. 1995, Eckart et al. 1995, Genzel et al. 1996, Tamblyn et al. 1996).
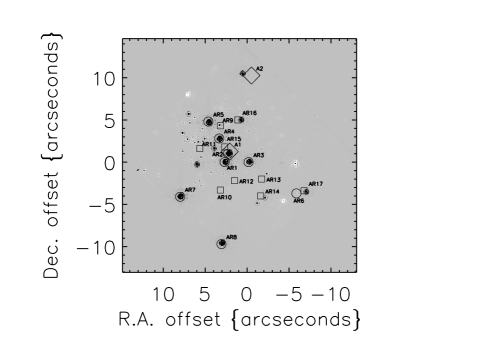
We now know that the Central Cluster contains over 30 evolved massive stars having Minitial 20 M⊙. A current estimate of the young population includes 9 WR stars, 20 stars with Ofpe/WN9-like K-band spectra, several red supergiants, and many luminous mid-infrared sources in a region of 1.6 pc in diameter centered on Sgr A∗ (Genzel et al. 1996). In addition, I estimate that it contains 100 O-stars (O7 and later) still on the main sequence. Najarro et al. (1994) modeled the infrared spectrum of the “AF” star finding that it is a helium-rich blue supergigant/Wolf-Rayet star, characterized by a strong stellar wind and a moderate amount of Lyman ionizing photons. Najarro et al. (1997) expanded this work by analyzing spectra of 8 blue supergiants in the center, finding extremely strong stellar winds ( 5 to 80 ), relatively small outflow velocities ( 300 to 1,000 km s-1), effective temperatures from 17,000 K to 30,000 K, stellar luminosities of 1 to L⊙, and spectral characteristics consistent with an “Ofpe/WN9” classification. They concluded that the He i emission line stars power the central parsec and belong to a young stellar cluster of massive stars which formed a few million years ago. More recently, Paumard et al. (2001) reviewed the emission-line stellar population in the central parsec, using new narrow-band infrared imaging. They found that the brightest emission-line stars divide into two categories, bright narrow-line (200 km s-1) and faint broad-line (1000 km s-1) stars, the former being clustered within a few arcseconds of Sgr A*, and the latter being distributed between 5′′ and 10′′ from the center.
Eckart et al. (1999) and Figer et al. (2000) identified massives stars within a few AU of the supermassive black hole. Evidently, a significant fraction of this small group of stars are young () and require extraordinarily dense pre-collapse cores () or formation sites much further away from the central black hole than their present location would suggest. Early results from proper-motion studies suggest that at least some of the stars in this cluster are bound to the black hole and are not on highly elliptical orbits (Ghez et al. 2001; Eckart et al. 2002); therefore they are likely to be near to their formation sites.
3. The Quintuplet Cluster
The Quintuplet Cluster is located approximately 30 pc, in projection, to the northeast of the Galactic Center (Glass, Catchpole, & Whitelock 1987). In addition to the five bright stars for which the Quintuplet was named (Nagata et al. 1990; Okuda et al. 1990), the Quintuplet cluster contains a variety of massive stars, including four WN, five WC (possibly ten, see below), two WN9/Ofpe, two LBV, one red supergiant and several dozen less-evolved blue supergiants (Figer et al. 1999a, 1999c). The five Quintuplet-proper members are massive stars (L 105 L⊙) embedded within dusty cacoons, although their spectral types and evolutionary status are unknown (Moneti et al. 2001). Figer et al. (1996, 1999a) argue that these stars are dust-enshrouded WCL stars, similar to WR 140 (Monnier et al. 2002) and WR 98A (Monnier et al. 1999). In addition to these post-main sequence stars, it is likely that 100 O-stars still on the main sequence exist in the cluster, assuming a flat to Salpeter IMF. The total cluster mass is estimated to be 104 M⊙; of this, the stars with certain spectral identifications, i.e. the most massive ones, contribute a few 103 M⊙. Given the extended distribution of the cluster, the implied mass density is greater than few thousand M⊙ pc-3. The total ionizing flux is 1051 photons s-1, enough to ionize the nearby “Sickle” HII region (G0.180.04). The total luminosity from the massive cluster stars is 107.5 L⊙, enough to account for the heating of the nearby molecular cloud, M0.200.033.
The two LBVs are added to the list of 6 LBVs in the Galaxy. They include the Pistol Star (Moneti et al. 1994; Figer et al. 1995a, 1995b, 1998, 1999b; Cotera 1995; Cotera et al. 1996), one of the most luminous stars known, and a newly identified LBV (Geballe et al. 2000) that is nearly as luminous as the Pistol Star. Both stars are luminous, “blue,” and variable, and the Pistol Star has ejected 10 M⊙ of material in the past 104 yrs, as evidenced by the remarkable Pistol nebula of ionized gas surrounding the star (Figer et al. 1999b; Moneti et al. 2001). Most of the luminous stars in the cluster are thought to be 35 Myr old, but significant age differences remain, i.e., the Pistol Star is thought to be 2 Myr old.


4. The Arches Cluster
First discovered about 10 years ago as a compact collection of a dozen or so emission-line stars (Cotera et al. 1992; Nagata et al. 1995; Figer 1995a; Cotera 1995; Cotera et al. 1996; Blum et al. 2001), the Arches cluster contains thousands of stars, including at least 160 O stars, according to Figer et al. (1999c). Figer et al. (1999c) used HST/NICMOS observations to estimate a total cluster mass (104 M⊙) and radius (0.2 pc) to arrive at an average mass density of 3(105) M⊙ pc-3 in stars, suggesting that the Arches cluster is the densest, and one of the most massive, young clusters in the Galaxy. They further used these data to estimate an initial mass function (IMF) which is relatively flat ( 0.60.1) with respect to what has been found for the solar neighborhood ( 1.35, Salpeter 1955) and other Galactic clusters (Scalo 1998). Stolte et al. (2002) recently confirmed this flat slope by analyzing the same data and recently obtained Gemini AO data. Figer et al. (2002) estimated an age of 2.50.5 Myr, based on the magnitudes, colors, mix of spectral types, and quantitative spectral analysis of stars in the cluster. Given the current state of knowledge about this cluster, it now seems apparent that we have observed a firm upper-mass cutoff, as shown in Figure 1. Note that we should expect at least 10 stars more massive than Minitial=300 M⊙. Indeed, we should even expect one star with an initial mass of 1,000 M⊙! Of course, it is questionable how long such a star would live; however, it is clear that the Arches cluster IMF cuts off at around 150 M⊙. Finally, even if we steepen the IMF slope to the Salpeter value, we still should expect at least 4 stars more massive than 300 M⊙.
Figer et al. (2002) conclude that the most massive stars are bona-fide Wolf-Rayet (WR) stars and are some of the most massive stars known, having Minitial 100 M⊙, and prodigious winds, 10-5 Myr-1, that are enriched with helium and nitrogen. These findings are largely based upon the spectra and narrow-band equivalent widths shown in Figure 2, and a detailed quantitative analysis of these data (also see Najarro 2002). Figer et al. (2002) found an upper limit to the velocity dispersion of 22 km s-1, implying an upper limit to the cluster mass of 7(104) M⊙ within a radius of 0.23 pc, and a bulk velocity of v+55 km s-1 for the cluster. It appears that the cluster happens to be ionizing, and approaching, the surface of a background molecular cloud, thus producing the Thermal Arched Filaments. They estimate that the cluster produces 4(1051) ionizing photons s-1, more than enough to account for the observed thermal radio flux from the nearby cloud. Commensurately, it produces 107.8 L⊙ in total luminosity, providing the heating source for the nearby molecular cloud, L L⊙. These interactions between a cluster of hot stars and a wayward molecular cloud are similar to those seen in the “Quintuplet/Sickle” region. Finally, note that significant work is being done on this cluster at radio and x-ray wavelengths, i.e. shown in Figure 3.
5. The Star Formation History of the Galactic Center
The evidence for recent (10 Myr) star formation in the Galactic Center abounds. The Lyman continuum flux emitted in the central few degrees of the Galaxy is about 1052 photons/s (Cox & Laureijs 1989), with half coming from stars in the three massive clusters. This flux is about 10% of the that for the whole Galaxy, and the number of massive stars (Minitial 20 M⊙) in the GC is about 10% of the number in the whole Galaxy. However, note that the star formation rate in the GC is about one one-hundredth of that for the whole Galaxy. Such a low star formation rate as a function of Lyman continuum photon production necessarily follows from the relatively flat initial mass function (IMF) slope used in estimating the mass of stars formed in the young clusters.


The recent star formation history () in the Galactic Center is relatively clear. Embedded HII regions trace star formation at the present time (Figer 1995, Cotera 1995, Cotera et al. 1999), while the young clusters trace star formation that occured 2.55 Myr ago. The lack of red supergiants (M and Minitial8 M⊙) in the region provides evidence for a very low star formation rate from 520 Myr ago. Indeed, a burst the size of that seen in the three clusters at 20 Myr ago would have produced 40 red supergiants, yet we see none (other than those associated with the young clusters).
The constraints on this activity are very strong, i.e. there were fewer than 5(103) M⊙ formed in stars over this time period, assuming the type of star formation that spawned the three massive clusters. Looking beyond 20 Myr, the picture becomes less clear because it is difficult to separate old low-mass red giants from much younger high-mass AGB stars with photometric data alone. Using spectroscopy, Blum et al. (1996) have shown that there is a relative dearth of stars with ages between 10 and 100 Myr in the central few parsecs. Given their conclusions, I estimate a low star formation rate during this period. These same authors, and Haller (1992), identified stars with ages on the order of a few hundred Myr in the central few arcminutes. Sjouwerman (1999) identified a population of OH/IR stars with a narrow range of expansion velocities, indicating intermediate ages and a starburst event a few Gyr ago. In addition, Frogel et al. (1999) identified an excess of bright stars in the fields they observed within 02 of the Galactic Center.
In order to infer the past star formation rate, I modeled the observed surface number density of stars (Figure 4) as a function of star formation history using the Geneva stellar evolution models, assuming a range of power-law initial mass functions (IMFs), metallicity, and wind mass-loss rates. I considered: an ancient burst, episodic bursts, continuous formation, and combinations of these three. I used these models to produce synthetic luminosity functions for comparison with HST/NICMOS data. The surface number density in the observed luminosity functions has been set by dividing the number of stars per half magnitude bin by the area of the observations. The NICMOS fields vary in location from about 15 pc from the GC to 55 pc, and the sample was culled of forground and background stars by limiting the data to stars with 1.0mF160WmF205W3.0 (1.7AK6.5). The results are presented in Figure 5.
In general, I find that the presently observed luminosity function is very well fit by continuous star formation at the level of 0.05 to 0.1 Myr-1. The total mass of stars formed is 108 M⊙ in these models, although the present-day mass is less as a result of mass-loss via steady winds or supernovae.
An ancient burst model is not consistent with the presence of bright stars (K08.0), nor is it consistent with an enhanced brightness of the red clump (although the observational evidence for such an enhancement is controversial). Episodic bursts are essentially indistinguishable from continuous star formation when using the luminosity function as a metric; clearly, one needs to examine a subset of all stars in distinguishing burst widths and periodicities. The continuous star formation model reproduces the bright end of the luminosity function, although note that the bulk of the observed bright stars are not red supergiants, so that there must be a gap in significant star formation activity during recent times, excepting the last 5 Myr. I find that variations in metallicity, IMF slope, or mass-loss rate, do not qualitatively affect our conclusion that continuous star formation produces synthetic luminosity functions that best fit the observed luminosity function, compared with the other star formation scenarios examined.
I acknowledge very useful discussions with Paco Najarro, Bob Blum, Laurant Sjouwerman, Mike Rich, Mark Morris, Sungsoo Kim, and Jay Frogel.
References
Allen, D. A., Hyland, A. R. & Hillier, D. J. 1990, MNRAS, 244, 706
Allen, D.A., 1994, in The Nuclei of Normal Galaxies, eds. R. Genzel & A. I. Harris (Dordrecht: Kluwer), 293
Becklin, E. E., & Neugebauer, G., 1968, ApJ, 151, 145
Blum, R. D., Depoy, D. L., & Sellgren, K. 1995, ApJ, 441, 603
Blum, R. D., Schaerer, D., Pasquali, A., Heydari-Malayeri, M., Conti, P. S., & Schmutz, W. 2001, AJ, 122, 1875
Cotera, A. S., Erickson, E. F., Simpson, J. P., Colgan, S. W. J., Allen, D. A., & Burton, M. G. 1992, American Astronomical Society Meeting, 181, 8702
Cotera, A. S. 1995, Ph.D. Thesis, Stanford University
Cotera, A. S., Erickson, E. F., Colgan, S. W. J., Simpson, J. P., Allen, D. A., & Burton, M. G. 1996, ApJ, 461, 750
Cotera, A. S., Simpson, J. P., Erickson, E. F., Colgan, S. W. J., Burton, M. G., & Allen, D. A. 1999, ApJ,
Cox, P. & Laureijs, R. 1989, IAU Symp. 136: The Center of the Galaxy, 136, 121
Eckart, A., Genzel, R., Hofmann, R. Sams, B. J., & Tacconi-Garman, L. E., 1995, ApJ, 445, L26
Eckart, A., Ott, T., & Genzel, R. 1999, A&A, 352, L22
Eckart, A., Genzel, R., Ott, T., & Schödel, R. 2002, MNRAS, 331, 917
Figer, D. F., Najarro, F., Morris, M., McLean, I. S., Geballe, T. R., Ghez, A. M., & Langer, N. 1998, ApJ, 506, 384
Figer, D. F. et al. 2000, ApJ, 533, L49
Figer, D. F., Morris, M., & McLean, I. S. 1996, The Galactic Center, San Francisco: ASP 102, 263
Figer, D. F., McLean, I. S., & Morris, M. 1995b, ApJ, 447, L29
Figer, D. F. 1995a, Ph.D. Thesis, University of California, Los Angeles
Figer, D. F., Kim, S. S., Morris, M., Serabyn, E., Rich, R. M., & McLean, I. S. 1999c, ApJ, 525, 750
Figer, D. F., McLean, I. S., & Morris, M. 1999a, ApJ, 514, 202
Figer, D. F., Morris, M., Geballe, T. R., Rich, R. M., Serabyn, E., McLean, I. S., Puetter, R. C., & Yahil, A. 1999b, ApJ, 525, 759
Figer, D. F., et al. 2002, ApJ, submitted
Forrest, W.J., Shure, M.A., Pipher, J.L., Woodward, C.A., 1987, in AIP Conf. 155, The Galactic Center, ed. D.Backer (New York: AIP), 153
Frogel, J.A., Tiede, G.P., & Kuchinski, L.E. 1999, AJ, 117, 2296
Geballe, T.R., Figer, D.F., & Najarro, F. 2000, ApJ, 530, 97
Genzel, R., Thatte, N., Krabbe, A., Kroker, H. & Tacconi-Garman 1996, ApJ, 472, 153
Ghez, A. M., Kremenek, T., Tanner, A., Morris, M., & Becklin, E. 2001, Black Holes in Binaries and Galactic Nuclei, 72
Glass, I. S., Catchpole, R. M., & Whitelock, P. A. 1987, MNRAS, 227, 373
Haller, J. W. 1992, Ph.D. Thesis, The University of Arizona
Krabbe, A., Genzel, R., Drapatz, S. & Rotaciuc, V. 1991, ApJ, 382, L19
Krabbe, A. et al. 1995, ApJ, 447, L95
Lang, C. C., Goss, W. M., & Rodríguez, L. F. 2001, ApJ, 551, L143
Lang, C. C. 2002, this volume
Lebofsky, M. J., Rieke, G. H., & Tokunaga, A. T. 1982, ApJ, 263, 736
Moneti, A., Glass, I. S., & Moorwood, A. F. M. 1994, MNRAS, 268, 194
Moneti, A., Stolovy, S., Blommaert, J. A. D. L., Figer, D. F., Najarro, F. 2001, A&A, 366, 106
Monnier, J. D., Tuthill, P. G., & Danchi, W. C. 2002, ApJ, 567, L137
Monnier, J. D., Tuthill, P. G., & Danchi, W. C. 1999, ApJ, 525, L97
Nagata, T., Woodward, C. E., Shure, M., Pipher, J. L. & Okuda, H. 1990, ApJ, 351, 83
Nagata, T., Woodward, C. E., Shure, M., & Kobayashi, N. 1995, ApJ, 109, 1676
Najarro, F., Hillier, D. J., Kudritzki, R. P., Krabbe, A., Genzel, R., Lutz, D., Drapatz, S. & Geballe, T. R. 1994, A&A, 285, 573
Najarro, F., Krabbe, A., Genzel, R., Lutz, D., Kudritzki, R. P., & Hillier, D. J. 1997, A&A, 325, 700
Najarro, F. 2002, this volume
Okuda, H, Shibai, H., Nakagawa, T., Matsuhara, H., Kobayashi, Y., Kaifu, N., Nagata, T., Gatley, I. & Geballe, T. R. 1990, ApJ, 351, 89
Paumard, T., Maillard, J. P., Morris, M., & Rigaut, F. 2001, A&A, 366, 466
Rieke, G. H. & Lebofsky, M. J. 1982, AIP Conf. Proc. 83: The Galactic Center, 194
Rieke, G. H., & Rieke, M. J., 1994, in The Nuclei of Normal Galaxies, ed. R. Genzel & A. I. Harris (Dordrecht: Kluwer), 283
Salpeter, E. E. 1955, ApJ, 121, 161
Scalo, J. 1998, in The Stellar Initial Mass Function, G. Gilmore and D. Howell (eds.), vol. 142 of 38th Herstmonceux Conference, San Francisco: ASP, 201
Serabyn, E., & Morris, M. 1996, Nature, 382, 602
Sjouwerman, L. O., Habing, H. J., Lindqvist, M., van Langevelde, H. J., & Winnberg, A. 1999, ASP Conf. Ser. 186: The Central Parsecs of the Galaxy, 379
Stolte, A., Grebel, E. K., Brandner, W., & Figer, D. F. 2002, å, in press
Tamblyn, P., Reike, G., Hanson, M., Close, L., McCarthy, D., Reike, M. 1996, ApJ, 456, 206
Yusef-Zadeh, F., Law, C., Wardle, M., Wang, Q. D., Fruscione, A., Lang, C. C., & Cotera, A. 2002, ApJ, 570, 665