Hot Flashes on Miras
Abstract
Short time scale variations have been reported for a few Miras, including sudden 0.2 magnitude or more brightening in the visual lasting from a few hours to a few days. Are these flashes real? Are they hot? What are they? Almost all the natural time scales for variation in the atmosphere and wind of a Mira variable are months to years long. What could cause such short-term variations? One intriguing possibility is that the variations are associated with the interaction of a Jovian planet with the time-dependent outflow of a Mira wind. Here we discuss observable features of such an interaction in terms of order-of-magnitude estimates and phenomenology, and make one clear prediction requiring observational followup. Future work needs to include both theoretical calculations and the development of systematic methods for searching for such events.
1 Introduction: The Normal Variability of Miras
The light curves of Miras are characterized by large amplitudes (2.5 visual magnitudes or more), long periods (typically a year and ranging from about 100 to over 600 days), and relatively stable periodicity, but with erratic cycle-to-cycle variations and small period changes on decade-long time scales. The typical light curve has a more rapid rise than its decline and shows nearly straight-line variation in magnitude with time on the declining branch (corresponding to an exponential decay in brightness). There are often extended “bumps” occurring on the rising or descending branches at about the same phase every cycle. The timing and magnitudes of the bumps and of maximum light are typically variable on a scale of , both phenomena most likely associated with the emergence of shocks through the visible-light photosphere (see e.g., Maffei & Tosti (1995)) and quite unrelated to the topic of this paper.
These normal variations can be understood, at least qualitatively, based on models such as those by G. H. Bowen (Bowen (1988); reviewed by Willson (2000)). The star pulsates radially in a manner similar to that of the Cepheids and RR Lyrae stars, except that in this case it is a combination of hydrogen and helium (first) ionization that provides the “valve” for the pulsation (Wood (1974), Keeley (1970)). In the atmosphere, these waves build up to become shock waves that propagate out through the atmosphere and into the wind. There are typically two shocks formed per cycle, providing a natural explanation for the “bumps” and perhaps also for those objects showing double maxima. An outflow is generated, either by the pulsation alone or, in some stars, also by radiation pressure on dust grains formed in “refrigerated” zones in the atmosphere.
Mira variables have pulsation periods around one year, and this is also about how long it takes material and shocks to travel, at typical speeds of , one to two AU, or about one stellar radius. This is then the natural time scale for variation.
Other mechanisms that have been suggested as possibly influencing the visual brightness include large-scale convective cells and solar-type flares. The natural time scale for variations linked to convection will also be of the same order as that for the pulsation. Solar-type flares, although quick, would need to be very bright - orders of magnitude brighter than flares observed on any other single star - to contrast with these very luminous stars. There is no evidence for the kinds of magnetic fields that would be required. (For a discussion of this point, see Soker & Zoabi (2002).)
Not seeing a plausible mechanism for short-time-scale high-contrast events, we have been very slow to accept reports of these, at least until some systematic effects could be established in a homogeneous data set. Such data are now emerging, and with further reflection we are also seeing some interesting possibilities for what the data may be telling us.
2 Mira “Flash” Events From the Literature
A few years back, Bradley Schaefer collected some data suggesting that there were shorter period variations on some Miras (Schaefer, 1991). His collection of events was rather heterogeneous, with a factor of 100 variation in time scale, changes in magnitude from 0.4 to 1.4, phases from maximum to mimimum, appearance on both rising and falling branches, and methods including visual, photographic, and radio observations. Three stars are listed for repeat events in his list, but unlike the de Laverny report discussed below, none of them showed a pattern of repeating at the same phase. So we did not take this report very seriously. A more recent paper by Maffei & Tosti (1995), apparently discussing the same thing, turns out on closer inspection to be focused on the behavior near maximum light. However, de Laverny, et al. (1998) found possibly short-term variations in the Hipparcos data for of the Miras observed. That is a large percentage, although note that some of their cases were decreases in brightness and not “flashes”. Again here, the data are not compelling by themselves; most instances are single-datapoint departures from the expected light curve.
There were some patterns noticed by de Laverny et al. that we find very suggestive. First, these events were systematically found away from maximum, most likely again because the star is dimmer rather than indicating that the phenomenon is phase-dependent. This is a natural result if the flash has a limited visual brightness and only shows up when the contrast is highest (when the star is faintest). Second, the stars showing flashes were systematically among the latest in spectral type, perhaps because the later types usually have bigger amplitudes (and are thus fainter near minimum light) or because the later types typically also have more massive winds. Finally, there were several stars that showed repeated flashes, with these showing up twice at the same phase in each star (but at different phases for different stars). De Laverny et al. said “…In nearly half of these cases, the variations occur at virtually the same phase: RT Boo, X Hya, W Vel. In two instances (X Ant and RX Mon) the phases are almost symmetric with respect to minimum of brigthness. The two variations of Z Oct belongs to one of these two cases. Furthermore, two of the three variations of X CrB and AM Cyg have the same phase, whereas the third one of X CrB is symmetric with respect to . However, the number of stars with two detections is too small to draw conclusions about a link between rapid variations and phases. One can only say that, if such a link exists, the phase of occurance depends on the stars.”
One way to check the reality of these events is to see what the AAVSO data look like. However, we run into a problem here. The probable duration of the events, deduced from the spacingbetween observations in nearly all cases because just one data point was high, is a few hours to several days. Phenomena on such a short time scale will not show up at all obviously in AAVSO data, since each observer observes a given star at most once per week (for good reasons) and the observations typically have a moderately broad scatter anyway at such red colors. We have looked at the AAVSO light curves for the times of flashes reported by de Laverny et al. and found no compelling evidence for or against these events in the data.
Two stars were found by de Laverny et al. to have 3 flashes. The flash data for these two stars is reproduced in Table 1. Note that the phase of repeat is not minimum light, but 0.1 to 0.2 in phase earlier.
| JD | Phase | Duration | |
|---|---|---|---|
| 2440000+ | in hours | ||
| phase of min = 0.54 | |||
| 8116.0 | 0.41 | 0.23 | 2.48 |
| 8607.3 | 0.42 | 0.40 | 6.06 |
| 8639.8 | 0.55 | 0.58 | 2.13 |
| phase of min = 0.6 | |||
| 8302.5 | 0.40 | 0.56 | 138.67 |
| 8446.7 | 0.78 | 0.32 | 2.48 |
| 9036.6 | 0.38 | 1.11 | 115.27 |
A couple of others were found to have two events, again at nearly the same phase. This repetition at a fixed phase suggests that whatever is creating the event is located at some fixed distance from the center of the star, so that the pulsation-induced shock comes through at about the same phase in every cycle. One may also speculate that the preference for phases near 0.4 in these two stars could result from the competing demands that the stellar flux be low (sooner after maximum light) and that the shock still be in a region with relatively high density (closer to minimum light). With greater sensitivity we would expect to see events at earlier and earlier phases.
3 Energetics and Contrast
In their paper, de Laverny et al. show a histogram of the phases of the detection of short-term events in the Hipparcos data. It resembles very closely the light-curve of a Mira variable plotted “upside down”, with brightest points at the bottom. This supports the idea that the preference for some phases is mainly that it is easier to see a flash when the star is faint. However, we note that some of their events were dimmings, and this argument does not explain why those should be concentrated towards minimum. They did not indicate which events were dips and which were peaks; we are looking back through the data to check this.
Most of the energy radiated by a Mira comes out in wavelengths between 1 and 5 microns. Near visual maximum, the visual brightness is much greater than the Sun’s, but near minimum, particularly for a large-amplitude star, the visual brightness may be only about the same as the Sun’s, even though the star is still radiating several times as much power as the Sun does. If we are to see an event with a contrast of 0.1 or 0.2 magnitudes, then this event must by itself be emitting ten to twenty percent of the visual flux. If the peak of the flash output is in the visual (a “hot” flash of 5000-10,000K equivalent temperature) the we get the minimum energy that must go into the flash for us to see it.
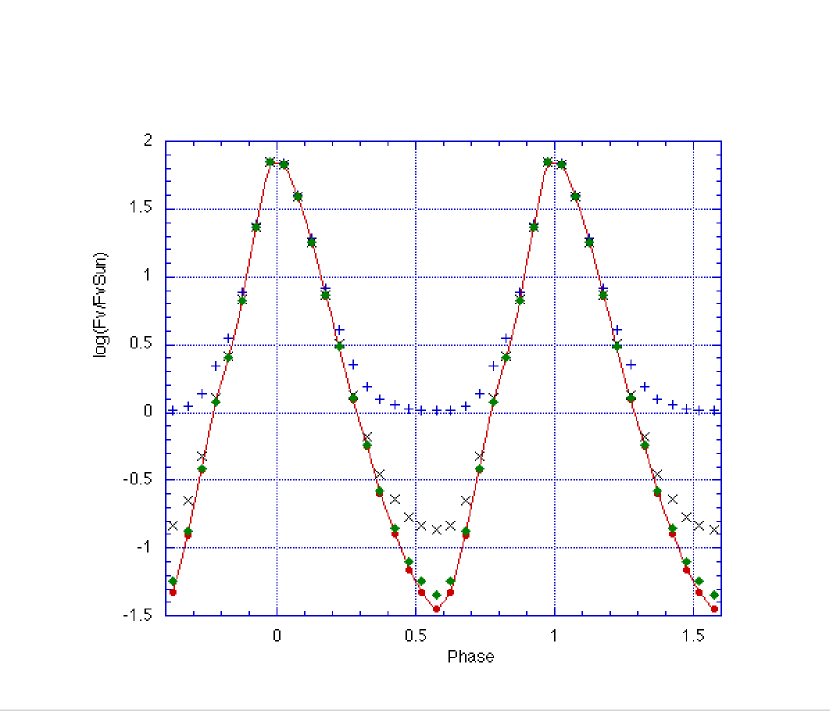
Figure 1 shows the mean light curve of Cyg in units of log (). To get this, we took a distance to Cyg of about 100 pc as is indicated by its period and the P-L relation for Miras (see discussion in Willson (2000)). We transformed this to power units using the magnitude formula
log(Fvis/Fvis, Sun) =3D -0.4(Mvis-Mvis, Sun)
The other three curves in Figure 1 are the result of adding 0.01, 0.1 and 1.0 times the brightness of the Sun to the flux of the Mira. It is clear that it is much easier to see an event that occurs when the star is faint; when the star is bright the contrast is too small, giving a small change in the magnitude. From Figure 1 we see that a flash with visual output equal to our Sun’s would be visible over a large range of phases for Cyg - roughly 0.2 to 0.8 - while one with a visual output of 10% that of our Sun would be visible from 0.35 to 0.7. The minimum energy required to get 10% of the Sun’s visible output is about for a color temperature of about 6000K.
The observational data may then be summarized as follows:
* The events, if real, last from a few hours to several days.
*The total power involved may be as low as 0.1 solar luminosity if we take the ideal “hot flash” condition (T = 6000K) but is likely to be more.
4 Possible, Probable, and Improbable Models
Any model that is to account for the “hot flashes” must give (a) enough energy being released in a single flash, (b) flashes appearing at about the same phase in more than one cycle, (c) flashes appearing more often in the light curves of stars of later spectral types, and (d) flashes lasting hours to a few days.
We know that there are short-term variations on the Sun, solar flares, and that these show up with greater contrast in late-type main sequence stars. Could the “flash” events on Miras be solar-type flares? Solar flares result from the transfer of energy from the magnetic field into particle motion and radiation. On the Sun, these last from a few minutes to an hour or so and have power output typically or . What determines the power, color, and time-scale of a solar-type flare? On the Sun, flares are relatively unpredictable events, occurring where the magnetic field crosses itself in a particular geometry. The ultimate cause of the flare is the windup of magnetic field lines in the Sun as a result of differential rotation. In a Mira, a windup of field could occur as the result of convective motions, and might even yield the necessary brightness, but this model doesn’t naturally produce events repeating at a single phase (different from minimum), and does not lend itself to modeling at the present time because too many factors are unknown. (See Soker & Zoabi (2002) for a discussion of these and related points.)
Another phenomenon that could give rise to a short-lived “flash” is what we have termed “shock coalescence”. In some computer models of Miras there is a tendency for some shocks to run slow and some to run fast, so that two shocks sometimes coalesce. This occurs as a result of nonlinear instabilities in the atmosphere, and since there is no communication from one part of the outflowing wind to another part some distance around the star, this instability should give rise to hot patches in the circumstellar outflow. However, like the flares, these events should not be periodic, and there are reasons to think that they may be rare in real stars because as the models have become more realistic the shocks have become more periodic. Finally, the “coalescence” events in models occur some considerable distance from the star, while to produce enough energy they would have to occur quite close to the star.
Two other ideas come from looking at the chemistry of the atmosphere. Stencel, et al. (2000) and Stencel, et al. (2001) suggested that there might be abrupt changes due to “molecular catastrophes” that result from the fact that CO is very good at radiating away energy. When the gas is too hot to have CO in it, then it also cools slowly. As soon as CO forms, the gas begins to cool quickly. This could abruptly change the opacity of the atmosphere, allowing more or less visible light to leak out (like making smoke signals with a blanket). Similarly, when dust grains form, they pick up momentum from the stellar radiation and begin to move away from the star; the gas is dragged along with the dust as dust grains and atoms collide. This expansion of the atmosphere produces cooling which further increases the rate of dust formation. Both of these mechanisms are very interesting and I would suspect are present in the real stars. They also could show phase stability, if they occur at a certain distance from the star where the density is “just right”. However, neither one seems likely to produced sudden and short-lived brightenings in the star; even if the onset is quick, it should take a time more like a pulsation cycle to get out of the “hole” of more CO or more dust. (Note, however, that this kind of opacity effect may be of interest in explaining the variations seen around maximum light.)
Our preference is to interpret the flash as being the result of some phenomenon associated with a shock passing an orbiting Jovian planet or brown dwarf companion star. One way to accommodate the short time scale is to consider the time it takes something moving around 5 to 10 km/s (such as an outward moving shock) to cross the sphere of influence of a planet. The extreme times are 6 hours to 3 days; 6 hours at 10 km/s covers 216,000 km and 5 km/s for 3 days covers 1,296,000 km. For comparison, 216,000 km = just over AU or about 1/3 of the current solar radius. These match well with estimates for the sphere of influence for Jupiter, taken as the sphere within which the local escape velocity from Jupiter is greater than the wind flow velocity.
There are two ways that energy could be stored over a cycle and then released abruptly in this context: (a) there could be some sort of magnetic windup associated with the planet’s interaction with the wind; or (b) the energy could be stored as kinetic energy in a circumplanetary disk. Aspects of the first model are discussed by Cuntz, et al. (2000); we are concentrating on exploring the second variety.
Consider the possibility that the “event” is caused by the interaction of the wind with a planet. The energy constraint is then a strong constraint. Suppose two amounts of mass with total mass M are colliding with a velocities of relative to their center of mass; then the energy released will be about and this must be at least as large as if the event persists over one to three days. If is 5-10 km/s (typical speeds) then the minimum mass involved is at least . This value is about what you would get if you could use the integrated mass loss of a typical Mira over three days in all directions, . But we have already argued that we have to be dealing with a small volume, implying that only a small fraction of the wind is allowed to be involved.
We seem to have reached an impasse, but that would be a premature conclusion. While taking just the amount of material available during a few days of wind flow near a Jupiter would not yield enough energy, the gravity of such a planet is such that it will not tend to create a distant bow shock but rather will pull wind material down into an accretion disk. The direction of the circulation in the accretion disk will depend on the direction of the planet’s motion and on whether the wind is flowing out from or falling back towards the star. In any location at all close to a Mira, for about half the cycle material is flowing out and for the other half, falling in. So the direction of flow reverses twice during a pulsation cycle, first abruptly, when the shock passes, and later more gently, about half-way between shocks. When the direction of preferred orbital motion about the planet changes, the new material will run head-on into the “old” material accreted during the other half-cycle. The result could be a rather sudden release of a lot of energy. How much energy? Simple estimates show that this could yield about a tenth of a solar luminosity for a moderately large Jovian planet to perhaps a solar luminosity for a brown dwarf - about what we need. We would expect to see this for several cycles at about the same phase (when the pulsation-shock reaches the orbit of the planet), and then perhaps not see it for several cycles while the planet is behind the star. We would expect cycle-to-cycle variations in the brightness of the flash as we view the interaction from different angles. The time scale for the “event’ could plausibly be about the time it takes all the material in the accretion disk to make one orbit around the planet - and this comes out to hours to a few days for reasonable parameters for the planet.
The above is the simplest model - one in which the energy is stored as kinetic energy. It is also possible to store and release magnetic energy in this situation, taking advantage of the winding up of the magnetic field in the circumplanetary accretion disk. We are concentrating for now on the simpler case, for our modeling, but note that the fundamental predictions of this paper are the same whether the release has a magnetic component or not.
How can we test this hypothesis that the flashes result from the interaction of the outflow with a Jovian planet? We are proposing to carry out more detailed calculations in order to make some very quantitative predictions about the character of the events and their influence on the winds. Meanwhile, there is one clear prediction that our model suggests: As the planet orbits around the star, taking perhaps ten years to do so, it will sometimes be between us and the star and sometimes behind the star when the shock passes. We would expect, then, to see a longer cycle (the orbital period of the planet) in the appearance and disappearance of the flashes in at least some of these stars. Over the orbital period, the flashes should appear, strengthen, then weaken and disappear as the planet circles the star. The flashes should appear at the same phase when they appear, but would not be present in every cycle. To check this prediction, we need first to identify a group of reliably flashing stars, and then monitor them for 10 to 20 years in a manner calculated to detect and follow flash events. This would be a new kind of observing program for the AAVSO and we are working to set it up.
To return to the questions we asked at the beginning, concerning the hot flashes: Are they real? We aren’t sure, but there are some interesting hints that they may be real. Are they hot? Short-lived events that are not “hot” () are unlikely to show up in contrast with the stellar brightness, so if they are real then they are almost certainly hot. What are they? We have proposed an interesting possibility, namely that these events could signal the presence of a Jovian planet in orbit around a dying star.
References
- Bowen (1988) Bowen, G. H. 1988, ApJ, 329, 299
- Cuntz, et al. (2000) Cuntz, M., Saar, S. H., & Musielak, Z. E. 2000, ApJ, 533, 151
- de Laverny, et al. (1998) de Laverny, P., Mennessier, M. O., Mignard, F., & Mattei, J. A. 1998, A&A, 330, 169
- Keeley (1970) Keeley, D. A. 1970, ApJ, 161, 657
- Maffei & Tosti (1995) Maffei, P., & Tosti, G. 1995, AJ, 109, 6
- Schaefer (1991) Schaefer, B. 1991, ApJ, 366, 39
- Soker (1998) Soker, N. 1998, MNRAS, 299, 1242
- Soker & Zoabi (2002) Soker, N. & Zoabi, E. 2002, MNRAS, 329, 204
- Stencel, et al. (2001) Stencel, R. E., Phillips, A., Jurgenson, C., & Ostrowski-Fukuda, T. 2001, BAAS, 199, 9219
- Stencel, et al. (2000) Stencel, R. A., et al. 2000, in HIPPARCOS and the Luminosity Calibration of the Nearer Stars, 24th meeting of the IAU, Joint Discussion 13, August 2000, Manchester, England
- Willson (2000) Willson, L. A. 2000, ARA&A, 38, 573
- Wood (1974) Wood, P. R. 1974, ApJ, 190, 609