Mixing by Non-linear Gravity Wave Breaking on a White Dwarf Surface
Abstract
We present the results of a simulation of a wind-driven non-linear gravity wave breaking on the surface of a white dwarf. The “wind” consists of H/He from an accreted envelope, and the simulation demonstrates that this breaking wave mechanism can produce a well-mixed layer of H/He with C/O from the white dwarf above the surface. Material from this mixed layer may then be transported throughout the accreted envelope by convection, which would enrich the C/O abundance of the envelope as is expected from observations of novae.
1 Introduction
Classical novae result from the ignition (and subsequent explosive thermonuclear burning) of a ( m) layer of hydrogen-rich material that has accreted from a main sequence companion onto the surface of a white dwarf Truran (1982); Shara (1989); Starrfield (1989); Livio (1994). Observed abundances and explosion energies estimated from observations indicate that there must be significant mixing of the heavier material of the C/O or O/Ne white dwarf into the lighter accreted material (H/He). This mixing is critical because otherwise hydrogen burning would be too slow to reproduce observed nova characteristics in outburst. Further, without this mixing it is difficult to understand the observed abundances of intermediate-mass nuclei in the ejecta. Accordingly, nova models must incorporate a mechanism that will dredge up the heavier white dwarf material (Rosner et al., 2001, and references therein).
A recently proposed mixing mechanism is the breaking of non-linear resonant gravity waves at the C/O surface Rosner et al. (2000); Alexakis, Young, and Rosner (2002); Rosner et al. (2001). The gravity waves, driven by the “wind” of accreted material, can break, forming a layer of well-mixed material. This mixed layer may then be transported upward by convection, thereby enriching the accreted material. Because the length scale of this mixed layer may be very small (much smaller than the length scale of convection), previous precursor simulations have not captured this effect.
In this manuscript, we present a simulation of a wind-driven non-linear gravity wave breaking on the surface of a white dwarf. The simulation was performed with FLASH, a parallel, adaptive-mesh simulation code for the compressible, reactive flows found in many astrophysical environments Fryxell et al. (2000); Calder et al. (2000). This simulation is part of an ongoing study of this mechanism to assess its efficacy for mixing white dwarf material with envelope material.

2 Theory and Simulation Details
This work applies the theory of gravity wave generation (originally developed for the air over water interface) (Miles, 1957, and references therein) to a white dwarf with an accreted envelope. The control parameters for this model are , which is the ratio of potential to kinetic energy of the wind ( is the constant gravitational acceleration, is the maximum wind speed, and is the characteristic length scale of the wind profile) and the ratio of densities at the interface, . For this simulation, the domain was cm by cm, cm/s, and , with a density of the white dwarf material at the interface of gm/cm3. The white dwarf and accreted envelope materials are modeled as simple gases with the white dwarf material composed (by mass) of a 50/50 C/O mix and the accreted material composed of a 75/25 H/He mix.
The density and pressure profiles were obtained by integrating the equation of hydrostatic equilibrium
| (1) |
which for the case of a compressible, gamma-law gas gives
| (2) |
and
| (3) |
Here is the pressure at the interface and is the density immediately above or below the interface. The wave was created by forcing the interface to be sinusoidal and perturbing the pressure and adding a velocity via a prescription similar to linear theory.
The wind profile is given by
| (4) |
with cm and . The boundary conditions were isothermal hydrostatic on the upper and lower boundaries and periodic on the sides. The simulation was performed with seven levels of adaptive mesh refinement, for an effective resolution of zones.
3 Results
Figure 1 shows the potential energy of the wave and the amount of mixed material during the course of the simulation. The left panel is a plot of potential energy vs. time showing the result from the simulation and the potential energy given by the linear theory as . The growth rate in this expression (140) comes from the control parameter , and (erg) is the initial potential energy of the wave Alexakis, Young, and Rosner (2002). The two potential energies agree reasonably well until the wave breaks at about 0.04 s. The right panel is a plot of mixed C/O mass per unit area vs. time. The figure demonstrates the dramatic increase in the amount of mixed material that occurs above , the point during the course of the simulation at which the wave begins to break.
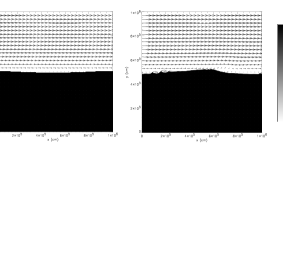
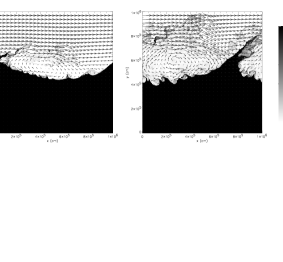
Figure 2 shows gray scale images of the log of density with velocity vectors at early times in the simulation. The longest velocity arrows, at the top of the images, correspond to cm/s, the maximum wind speed. The left panel shows the initial conditions, and the right panel shows the configuration at = 0.015 s. Visible in the right panel is the development of Kelvin-Helmholtz instability on the upwind (left) side of the wave. Figure 3 shows similar gray scale images of the log of density with velocity vectors at later times in the simulation. By s (left panel), the wave has begun to break, and the images show vorticity downwind from the crest of the wave. At s (right panel), there is substantial mixing and obvious vorticity.
4 Conclusions
The simulation presented in this manuscript demonstrates the proposed breaking wind-driven non-linear gravity wave mixing mechanism. The results show the development of well-mixed zone just above the surface of the white dwarf. This simulation will be one part of a study of this mixing mechanism investigating effects of wind profiles and speeds. Complete details of the study will appear in Alexakis, et al. (2002).
The expectation is that the breaking of non-linear gravity waves on the surface of the white dwarf will lead to a thin well-mixed layer of material that may then be transported throughout the the envelope by convection. This study investigating the mixing mechanism should provide quantitative information about the mixing rate that will allow for the development of subgrid models that may be applied to multidimensional convection simulations to study the enrichment of the envelope. A preliminary simulation of this kind is also presented in this volume Dursi, et al. (2002).
References
- Truran (1982) Truran, J. W., 1982, “Nuclear Theory of Novae,” in Essays in Nuclear Astrophysics, edited by C. A. Barnes, D. D. Clayton, and D. N. Schramm, Cambridge University Press, Cambridge, 1982, pp. 467-493
- Shara (1989) Shara, M. M., PASP 101 5-31 (1989)
- Starrfield (1989) Starrfield, S., “Thermonuclear Processes and the Classical Nova Outburst,” in Classical Novae, edited by N. Evans and M. Bode, Wiley, New York, 1989, pp. 39-60
- Livio (1994) Livio, M., Mem. Soc. Astron. Ital., 65 49-57 (1994)
- Rosner et al. (2001) Rosner, R., Alexakis, A., Young, Y.-N., Truran, J. W., and Hillebrandt, W., ApJ 562 L177-L179 (2001)
- Rosner et al. (2000) Rosner, R., et al., BAAS 32 1538 (2000)
- Alexakis, Young, and Rosner (2002) Alexakis, A., Young, Y.-N., and Rosner, R., Phys. Rev. E 65 026313 (2002)
- Fryxell et al. (2000) Fryxell, B., et al., ApJS 131 273-334 (2000)
- Calder et al. (2000) Calder, A. C., et al., “High Performance Reactive Fluid Flow Simulations Using Adaptive Mesh Refinement on Thousands of Processors,” in Proc. Supercomputing 2000, 2000, IEEE Computer Soc., http://sc2000.org/proceedings/
- Miles (1957) Miles, J., J. Fluid Mech. 3 185-204 (1957)
- Alexakis, et al. (2002) Alexakis, A., et al., In prep. (2002)
- Dursi, et al. (2002) Dursi, L. J., et al., This volume (2002)