Modelling SCUBA sources in a CDM cosmology: hot starbursts or cold extended galactic dust?
Abstract
Previous modelling has demonstrated that it is difficult to reproduce the SCUBA source counts within the framework of standard hierarchical structure formation models if the sources are assumed to be the high-redshift counterparts of local ultra-luminous infrared galaxies with dust temperatures in the range 40 – 60 K. Here, we show that the counts are more easily reproduced in a model in which the bulk of the sub-millimetre emission comes from extended, cool (20 – 25 K) dust in objects with star formation rates of 50 – 100 . The low temperatures imply typical sizes of arcsec, a factor two to three larger than those predicted using starburst-like spectral energy distributions. Low dust temperatures also imply a ratio of optical/UV to 850-m flux which is 30 – 100 times smaller, for the same optical depth, than expected for objects with a hot, starburst-like SED. This may help explain the small overlap between SCUBA sources and Lyman–break galaxies.
keywords:
submillimetre – galaxies: high-redshift – galaxies: starburst – galaxies: evolution – galaxies: luminosity function – infrared: galaxies1 Introduction
Studies of galaxy properties in the infrared (IR) have added much to our understanding of how and when galaxies form their stars (e.g. Rowan-Robinson et al. 1997; Meurer et al. 1997; Dickinson 1998; Lutz et al. 1998; Pettini et al. 1998; Flores et al. 1999; Meurer, Heckman & Calzetti 1999; Steidel et al. 1999). At low redshifts, the bright end of the infrared galaxy luminosity function is dominated by strongly starbursting systems, which show a rapid increase in space density towards larger redshifts (see review by Sanders & Mirabel 1996). The large number of bright submillimetre (sub-mm) sources that were detected by the SCUBA instrument on the JCMT nevertheless came as a surprise (Smail, Ivison & Blain 1997; Hughes et al. 1998; Barger, Cowie & Sanders 1999; Blain et al. 1999b; Eales et al. 2000; Scott et al. 2002). If the the sub-mm sources are the high-redshift equivalent of the strong starbursts observed at low redshifts, the high number counts imply that strong evolution in the space density of bright IR sources would have to continue beyond 3 – 4.
Many authors have devised phenomenological models to reproduce the sub-mm source counts. These models assume a local luminosity function of the sources and a parametrized law for the evolution of the sources in luminosity and/or density that is constrained to fit the counts at various wavelengths (see Rowan-Robinson 2001 and references therein).
It is nevertheless important to understand the observed sub-mm counts within the standard cosmological paradigm. Previous modelling based on semi-analytic (Guiderdoni et al. 1998; Devriendt & Guiderdoni 2000) or gas dynamical (Fardal et al., 2001) simulations, has encountered considerable difficulties in reproducing the brightest sub-mm sources. If the bright SCUBA sources are the high-redshift counterparts of the local ultra-luminous infrared galaxies (ULIRGs), their dust temperature should be high (40 – 60 K). They are then inferred to be forming stars at rates of a few hundred to a thousand solar masses per year, the exact value depending on the detailed assumptions regarding extinction, initial mass function and the duration of the burst. Such extreme star formation rates are very difficult to achieve in standard hierarchical galaxy formation models. Devriendt & Guiderdoni (2000) show that under these assumptions, they are only able to reproduce the sub-mm counts with a model in which essentially all baryons present in massive dark matter haloes at redshifts turn into stars over timescales of order years. They propose that high merging rates in the early Universe may be responsible for this extremely efficient conversion of gas into stars, but do not attempt to model this in detail. On the other hand, Blain et al. (1999a) have modelled the merging rates of dark matter haloes in hierarchical cosmologies and find that, in order to fit the counts, the halo mass-to-infrared light ratio of a typical galaxy merger must be 200 times smaller at redshift 3 than at the present day. This is clearly an extreme requirement.
The form of the spectral energy distribution (SED) of the sub-mm galaxies is, however, a source of major uncertainty in the predictions. Recently Fardal et al. (2001) modelled the sub-mm counts using N-body plus smoothed particle hydrodynamics simulations and showed that better agreement with the data was obtained if the dust temperatures were at the lower end of the range usually assumed for starbursting galaxies. This follows suggestions by Rowan-Robinson (2001) and Efstathiou & Rowan-Robinson (2002, hereafter ERR) that the sub-mm emission from high-redshift galaxies could arise from cirrus-like emission of cold extended dust. An extended distribution of cold dust may, for example, be caused by wind-driven dust outflows (Heckman, Armus & Miley 1990; Alton, Davies & Bianchi 1999).
In this paper, we explore the degeneracy between the inferred star formation rate and dust temperature explicitly and treat temperature as a free parameter when fitting the sub-mm counts. We demonstrate that hierarchical galaxy formation models can reproduce the sub-mm counts with moderate star formation rates if the sub-mm emission arises from cool, extended dust and discuss the implications for the size of the emitting region. We use the galaxy formation model described in Kauffmann, White & Guiderdoni (1993) and Kauffmann et al. (1999) and the diffuse cirrus emission SEDs of ERR.
In §2, we describe the galaxy formation model used to predict the star formation rates and outline the difficulties of hierarchical models in accommodating a high space density of strong starbursts out to large redshifts. §3 discusses our modelling of the SED and explores the degeneracies in the dust models. In §4, we present our results and a comparison with observations and in §5 we discuss their implications for the nature of the sub-mm sources. §6 presents our conclusions.
2 The galaxy formation model
2.1 Star formation in hierarchical galaxy formation models
We have used the star formation rates predicted by the semi-analytic galaxy formation model of Kauffmann et al. (1993). Here, we briefly recapitulate some of the assumptions of the model relevant for our predictions of the sub-mm counts. The model and semi-analytic prescriptions are described in detail in the above reference and elsewhere (Lacey & Cole 1993; Kauffmann et al. 1999; Somerville & Primack 1999; Cole et al. 2000). The calculations are for a flat CDM model with and kms-1Mpc-1. The model follows the formation and evolution of galaxies within a merging hierarchy of dark matter haloes. Simple prescriptions take into account the dissipative cooling of the gas, the formation of stars, feedback from supernovae and the merging rates of galaxies located within the same dark matter halo. Star formation is modelled by the following equation:
| (1) |
where is the star formation rate, is the mass of the available cold gas, is the dynamical time of the galaxy, and is a parameter controlling the efficiency of star formation. depends on the cooling rate of the hot gas in the dark matter halo, the star formation rate and the efficiency of supernovae in heating the gas. In the model, is a free parameter that is set to reproduce the luminosity of a Milky Way-type galaxy. The star formation efficiency is enhanced by a factor if a merging event takes place. The duration of the period of high efficiency star formation, , scales with the dynamical time of the galaxy and is another parameter of the model. (See also Balland, Devriendt & Silk 2002)
2.2 The space density of starbursting galaxies at high redshift

Fig. 1 shows the space density of galaxies as a function of star formation rate at a series of different redshifts. Overall, the typical star formation rates increase towards higher redshift. This is because the dynamical times of high-redshift galaxies are shorter, implying higher star formation rates, and because galaxies are typically more gas-rich at high . However, the space density of galaxies with star formation rates above 50 – 100 drops at redshifts greater than 2–3. Such systems only occur in the most massive dark matter haloes, which are rare at early epochs. Objects with star formation rates of a few hundred to a thousand are very rare at all epochs.

To demonstrate that this is a genuine feature of all hierarchical galaxy formation models and not an artefact of the particular star formation and feedback prescriptions we have chosen, we have carried out the following simple exercise. We assign a fiducial star formation rate to each dark matter halo in the Universe by assuming that at any given epoch, one tenth of the available baryons in the halo are forming stars over a timescale . The star formation rate per halo may then be written as , where , (Bania, Rood & Balser, 2002) and ( and are the baryonic and total co-moving mass densities in the Universe and is the mass of the halo harbouring the galaxy). We consider two cases: quiescent star formation with , and bursty star formation with and calculate halo abundances using the standard Press-Schechter formula. Fig. 2 shows the redshift evolution of the space density of objects with different star formation rates. As can be seen, the space density of massive haloes with is small and drops very rapidly towards larger redshifts.
Scott et al. (2002) derived a density Mpc-3 for SCUBA sources. Figs. 1 and 2 demonstrate that in ‘realistic’ models such space densities are only achieved for objects with much lower star formation rates of . The common solution of making the star formation more ‘bursty’ does not help us match these high space densities unless star formation timescales are considerably shorter than we have assumed. This argues in favour of lower star formation rates of the SCUBA sources than those inferred by Scott et al. (2002) unless the star formation efficiency in the SCUBA sources is extremely high.
3 Spectral Energy Distributions
3.1 Grey-body models of the Far-Infrared SED
For a given illuminating radiation field, optical depth and age, the spectral energy distribution of a galaxy in the far-infrared (FIR) and sub-mm part of the spectrum is determined by the dust temperature and grain size. This part of the SED is relatively featureless (Fioc & Rocca-Volmerange 1997; Silva et al. 1998; Devriendt, Guiderdoni & Sadat 1999; Efstathiou, Rowan-Robinson & Siebenmorgen 2000), because in clouds that are optically thick to optical/UV radiation, the dust emission can be qualitatively represented by a single large grain model whose extinction efficiency changes with the inverse of the grain size. The presence of grains of smaller size results in a distortion of the grey-body SED of the single grain model. We write the grey-body SED as , where is the spectral luminosity of the galaxy, is the Planck function, and is the dust emissivity function. In the simple, single-component dust model, . The presence of smaller grains results in . Provided that the grain size distribution is not changed through creation and destruction of different-sized grains, depends only weakly on temperature. In this paper, is taken as a free parameter of the model and the effective temperature of the dust, T, is the second adjustable parameter.

Fig. 3 shows grey-body fits to the SEDs of Efstathiou et al. (2000) and ERR in the wavelength range m. The fit to the FIR emission is indeed very good. We therefore take a simple grey-body parameterization for the SED to predict the counts from our galaxy formation model. We have compared counts calculated using SEDs from full radiative transfer models with those calculated from grey-body fits. The results are in agreement to within per cent.
The next step is to determine the normalization of the SED. We adopt the common practice of relating the bolometric luminosity of a galaxy to its instantaneous star formation rate through a linear relationship, ignoring the cumulative effect of old stars, and thus the star formation history of the source. We do this in order to keep the number of dust parameters small. The form of the assumed initial mass function (IMF), the evolution of the metallicity and the dust mixture and the timescale of star formation all contribute to the uncertainty in the proportionality constant of the model,
| (2) |
In the literature to for a range of IMFs (see review by Blain et al. 2002). Here, we adopt a value of and note that it is uncertain by a factor of two in either direction. We further assume that the galaxies are optically thick at visible and UV wavelengths and that most starlight is absorbed and re-radiated by dust, i.e. .
It is customary to allow the high frequency limit of the slope of the SED to be another parameter of a grey-body SED model. The effect of this parameter in our calculation is very small since we are interested in the flux far beyond the FIR peak. This parameter only affects the normalization of the SED and its effect is a change in of per cent or a change of K in the temperature. We shall therefore omit it in the interest of keeping the number of parameters small.
3.2 The sub-mm counts within hierarchical models with a hot starburst-like SED
In §2.2, we saw that, in hierarchical galaxy formation models, the predicted space density of galaxies with star formation rates is small. This is the main reason for the difficulty encountered in fitting the sub-mm source counts when assuming a hot SED. Higher dust temperatures move the peak of the SED towards shorter wavelengths. Thus, for a given bolometric luminosity of the source, the hotter the SED, the smaller the proportion of the galaxy’s output in the sub-mm.
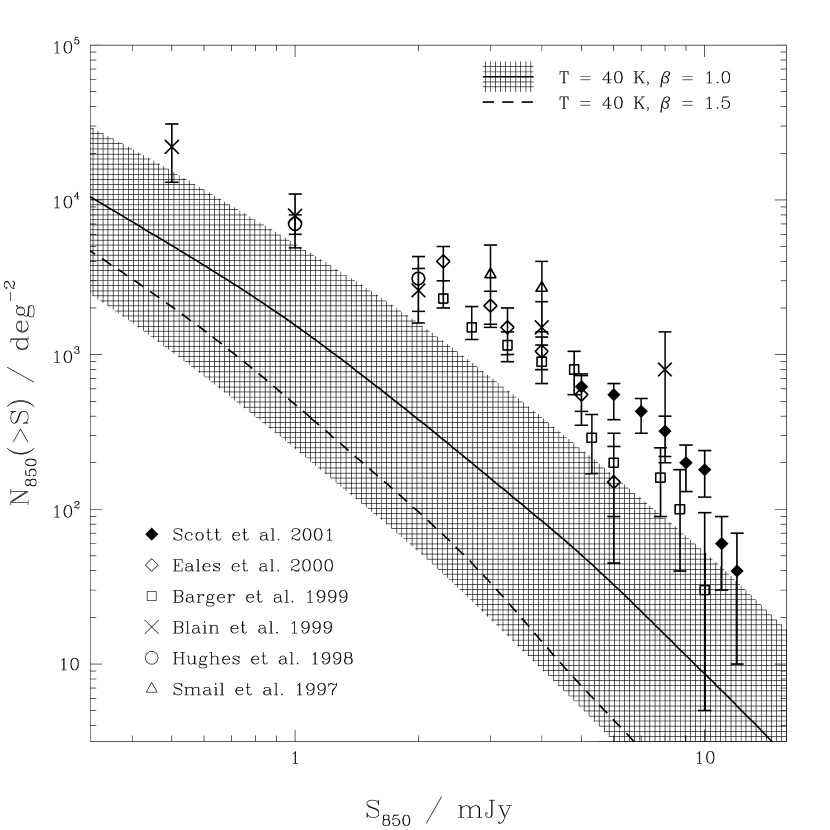
To demonstrate this more clearly, the curves in Fig. 4 show the sub-millimetre counts predicted for the semi-analytic models, assuming that all galaxies have hot SEDs. Results are shown for different values of the dust emissivity parameter, . Even though the temperature is at the lower end of the frequently assumed range (40 – 60 K), the predicted counts fall significantly short of the observed values. Increasing either the temperature or the emissivity index makes matters worse.
We saw in §2.2 that the abundance of sources with moderate star formation rates of the order 50 – 100 is sufficient to match the number of objects detected in sub-mm surveys. For these moderate star formation rates, it is unnecessary to assume a hot SED. In the next section, we explore the effect of varying the dust temperature more freely, while in §5.1, we will discuss the implications for the relation of sub-mm sources to Lyman-break galaxies.
3.3 Temperature as a free parameter in models with diffuse extended dust
In the literature, a range of temperatures has been used when fitting sub-mm counts, but most authors have refrained from allowing to vary outside the range 40 – 60 K, arguing that temperatures much below this are unrealistic in a starburst galaxy, where star formation takes place in optically thick giant molecular clouds (GMCs). In standard radiative transfer models, the dust temperature of a GMC is determined by its physical extent, which is in turn limited by the time before it is dispersed by supernovae. The bolometric luminosity of a galaxy then scales with the number of molecular clouds contained within it.

For galaxies with moderate star formation rates, it is plausible that most of the IR emission is due to a different geometrical configuration of the star/dust distribution, more similar to that responsible for the cirrus emission in spiral galaxies (ERR). If the starlight is absorbed by diffuse extended dust and re-radiated in the FIR, the intensity of the UV radiation heating the dust is not set by the properties of GMCs and much lower dust temperatures are expected. The peak in the FIR emission then moves much closer to 850 m and the resulting bolometric correction and the inferred star formation rate decrease strongly. Fig. 5 shows how the inferred star formation rate for a source with a flux of 1 mJy at 850 m varies as a function of redshift for a range of SEDs corresponding to different dust temperatures.
3.4 Further constraints on the dust models
The 850-m source counts are not able to constrain all the free parameters needed to predict the sub-mm emission from the galaxies in our model. We have thus chosen plausible values for two of our parameters, and yr.
One way to break the degeneracy between star formation rate and temperature is to consider the inferred size of the emitting region (Rowan-Robinson 2001). The predicted radius of the emitting region depends on its bolometric luminosity and its surface brightness as
| (3) |
Surface brightness and temperature are linked because of the equilibrium between absorbed UV/optical emission and emitted IR emission, . Higher UV/optical surface brightness, , will result in higher dust temperatures which in turn will result in a higher IR surface brightness.
In order to normalize the relation between the intensity of the radiation field and the emitted bolometric surface brightness, we have to make assumptions about the relative distribution of dust and stars. Observed sub-mm sources are generally very faint in the optical and UV and are therefore heavily obscured at these wavelengths. We will consider two limiting cases: a dust screen and an extended distribution of stars and dust. For a dust screen, the situation is basically the same as in the optically thin case. The dust layer located within about one optical depth from the stars will be heated to approximately the same equilibrium temperature as in the optically thin case. The surface brightness of starlight needed to reach a certain temperature is fixed and can be used to infer the bolometric FIR surface brightness and hence the size of the IR-emitting region.
The dust properties (composition, grain size distribution) will fix the dust emissivity index . The predicted surface brightness/size will increase/decrease with increasing star formation rate. The relations between temperature, bolometric luminosity, bolometric surface brightness and sub-mm flux can then be used to predict the sizes of sources of given sub-mm flux in our models, or, more generally, to infer a star formation rate from an observed sub-mm flux and size. We will discuss this in more detail in §4.2.
4 Results
4.1 Fitting the 850-m counts

In this section, we use the star formation rates given by the hierarchical galaxy formation model, described in §2, to calculate the 850-m counts. For simplicity, we have assumed that the sub-mm sources are all star-forming objects characterized by a single temperature SED. Of course, in reality, sources of a range of temperatures, most likely also belonging to different populations of sources (quiescently star-forming galaxies, starbursts, AGN, etc.), will contribute to the 850-m counts.
There is a certain amount of degeneracy between the temperature and the emissivity index. As illustrated in Fig. 6, the temperature required to obtain a reasonable fit to the data changes from 23 K to 21 K as we vary in the range 1.65 to 1.95. In physical terms, the value of is set by the precise nature and composition of the dust mixture, its optical depth, and how these vary as a function of the age of the stars that are responsible for the heating. Realistic radiative transfer models (Silva et al. 1998; Efstathiou et al. 2000; ERR) yield values in the range 1.5 – 2.0.
The parameter parameterizes the effect of the IMF on the energy output by a given mass of stars that is formed. A change in moves the count distribution horizontally. A change of the star formation time scale, , alters both the luminosity of the sources and the length of time they are ‘visible’, so its effect on the count distribution is more complex. The bright counts are dominated by the most strongly star-forming objects. Because the star formation rate function is very steep at the bright end (see Fig. 1), an increase in the luminosity of the sources tends to over-compensate for the drop in density. The faint end of the star formation rate function is shallow, so at fainter flux levels the normalization of the counts is determined by the space density of the sources. The cross-over of the two regimes takes place at mJy. Over the range of observed source fluxes, a lower value of will thus reduce the slope of the counts.
The effect of a scatter in the temperatures of the sub-mm emitting regions is to reduce the slope of the flux distribution, as lower temperature sources will make a large contribution to the counts at the bright end (Fardal et al., 2001).
4.2 Sizes of the Source Galaxies
Because of its large beam size, SCUBA is unable to constrain the sizes of the detected sub-mm sources. The only information we have so far on the sizes of these sources comes from observations with the Plateau de Bure interferometer which appear to have marginally resolved the SCUBA galaxy Lockman850.1 (Lutz et al., 2001). As we will discuss below, the size of this galaxy fits in with the assumption of low dust temperatures.
Let us define the SED of a source as , where is a normalized function. We can then use the flux redshift relation to relate flux and luminosity,
| (4) |
Here, is the luminosity distance. Equation 3 then gives an expression for the angular size of the object in terms of its bolometric surface brightness ,
| (5) |
As discussed in §3.4, for a given grain composition, the balance between absorbed and emitted energy establishes a tight relation between the intensity of the UV/optical radiation and the temperature (distribution) of the dust. In the case of an extended, optically thin dust distribution, this intensity will be given by the average surface brightness of the starlight (as is the case for cirrus emission from spiral galaxies). As discussed, the resulting FIR SED can be well fitted by a grey-body spectrum with an effective temperature and .

We have used the cirrus model of ERR to calculate the SED and the relation between temperature and . If the dust acts as a screen , while for an extended distribution of dust and stars . Fig. 7 shows the resulting angular sizes as a function of redshift for sources with mJy, assuming an extended dust distribution with . Results are shown for a range of different dust temperatures. The value of we assume is slightly larger than that adopted by ERR to fit the SEDs of non-starburst SCUBA sources. However, in order to have optical data, the sources they consider are necessarily less obscured. Note the obvious scaling . For a dust screen geometry, the predicted sizes would be larger by a factor three.
The angular size of the sources is almost constant at low redshifts. Once the k-correction no longer compensates for the redshift factor in equation 5, the angular sizes increase with redshift. For low dust temperatures, the sizes are around arcsec for redshifts less than and then increase by a factor in the redshift interval . We also show two models with temperature and emissivity appropriate for hot starburst SEDs. At a given redshift, the angular size of the source decreases approximately linearly with the assumed temperature. The cool, extended models predict significantly larger sizes than the hot SED models. A galaxy with would be two to three times as large as a hot source in the redshift range .
The weak redshift dependence of the angular sizes makes it possible to use observed sizes to constrain the dust temperature in the screen model and a combination of temperature and optical depth for the extended model.
The cross in Fig. 7 shows the size of SCUBA galaxy Lockman850.1 assuming that it is marginally resolved and scaled to an 850-m flux of 1 mJy (Lutz et al., 2001). This observation is in reasonably good agreement with our prediction for emission from cold extended dust. Note, however, that LE850.6, resolved in the radio seems to have a slightly smaller size (Ivison et al., 2002).

The corresponding proper sizes of the sources depend on the cosmology. With the same parameters as in Fig. 6, our model predicts sizes kpc (Fig. 8).
Changes in and require changes in the assumed dust temperature and emissivity index in order to maintain a good fit to the counts. An increase in means that the dust temperatures can be higher, since a smaller fraction of the stellar output is needed in the sub-mm. Thus the sources can be more compact, with larger surface brightnesses and smaller radii. Increasing the star formation timescale has the opposite effect. The bolometric source luminosities drop and cooler, more extended sources are required to match the observed sub-mm fluxes.
4.3 Redshift Distributions

Fig. 9 shows the redshift distribution of our sources down to various flux limits for a range of different parameters. The typical redshifts are in the range . This is very similar to previous modelling which has assumed hot starburst-like SEDs.
The solid curve shows the redshift distribution down to a flux level of 1 mJy with the parameter set . The median redshift of the sources is 2.6. The mean of the redshift distribution is 2.8 and its variance 1.4. The distribution has a high redshift tail that extends to . The distribution of the fainter sources is similar, but extends to larger redshifts (dotted) while the bright sources peak at slightly lower redshifts (short-dashed). The curves change little if we change the starburst time scale and the assumed IMF (long-dashed and dot-dashed, respectively)
Because the sub-mm counts are strongly biased towards high-redshift sources, counts at shorter wavelengths place rather little constraint on models for the sub-mm source population (see e.g. Granato et al. 2000).
5 Discussion
5.1 The nature of sub-mm sources and the relation to Lyman–break galaxies
As discussed in the previous section, low dust temperatures imply a star/dust distribution that is spatially extended over kpc. This is very different from typical violent starbursts at the centre of galaxies which are spatially compact with typical sizes pc. In our model, the sub-mm sources are more extended than Lyman–break galaxies which have typical sizes of 0.6 arcsec (Calzetti & Giavalisco, 2001).
The UV continuum slope of Lyman–break galaxies indicates that they are typically optically thick in the optical/UV (Pettini et al., 2001) and emit the bulk of their light in the IR. Typical correction factors to the bolometric luminosity range from 3 to 15 depending on the assumed reddening curve (Steidel et al., 1998). Furthermore, the spectra of Lyman–break galaxies exhibit many of the characteristics of nearby starbursts. It was thus expected that they would dominate the sub-mm source population and the lack of sub-mm detections of most Lyman–break galaxies came as a surprise (Hughes et al. 1998; Smail et al. 1998; Barger et al. 1999; Lilly et al. 1999; Chapman et al. 2000).
The larger spatial extent and smaller surface brightness predicted by our cold dust models may naturally explain the lack of overlap of the sub-mm sources and Lyman–break galaxies. Optical/UV selected samples of high-redshift galaxies will be strongly biased to high surface brightness objects. These will have high dust temperatures and, at the typical redshifts of these sources, the 850-m flux will come from far down the Raleigh-Jeans tail of the spectrum. Conversely, a larger fraction of the total emitted light of low surface brightness objects will be detected in the sub-mm. In this way, the UV to sub-mm flux ratio can differ by a factor 30 – 100 for objects with the same optical depth and star formation rate (see Fig. 5). A larger optical depth in sub-mm detected sources would obviously further increase this ratio (see Shu, Mao & Mo 2001 for a model where the bright sources are more strongly obscured).
5.2 Contribution from AGN
Active Galactic Nuclei (AGN) make a contribution to the FIR and sub-mm luminosities of Luminous IR Galaxies by heating the dust in torus enshrouding an AGN (e.g. Rowan-Robinson 1995). The debate on the fraction of the infrared luminosity due to AGN has not yet been settled, though recent surveys with Chandra seem to suggest that the contribution of AGN to SCUBA sources is not significant (Alexander et al., 2001). Observations of galaxies in the local universe suggest 70 – 80 per cent of ULIRGs () are starburst-dominated (Genzel et al., 1998). Only when the luminosity reaches that of a Hyper-luminous IR Galaxy (HLIRG, ), are AGN thought to dominate the far-IR emission (Farrah et al., 2002). For almost all the sources in our model . The average contribution from AGN to these galaxies is of order 1 per cent (Veilleux, Kim & Sanders, 1999).
5.3 Implications for source counts in the mid IR
The forthcoming Spectral and Photometric Image Receiver (SPIRE; Griffin, Swinyard & Vigroux 2001) on European Space Agency’s Herschel Space Observatory will image the sky at 250, 350, and 500 m. The high redshifts of our source population means that the first of these channels already looks at emission from beyond the FIR peak of our SEDs (). Only the brightest low-redshift SCUBA sources would be detectable in a 250 m SPIRE survey. At 350 m, SCUBA fluxes are almost unchanged for sources at the median redshift. The 500 m channel will see most objects with mJy over the whole redshift range. The point source sensitivity of the channels is adequate to measure the slope of the SED, and hence the temperature, of at least the brightest of the sources, directly. If sources exhibit some scatter in temperature (as is likely), all the above surveys will be biased toward the sources with higher temperatures than we have assumed in this paper.
6 Conclusions
The sub-mm source counts predicted by hierarchical models of galaxies formation have been studied for a wide range of SEDs.
We confirm the results of previous studies that, with plausible assumptions about star formation timescales, star formation efficiencies and IMF, hierarchical models for galaxy formation under-predict the number of bright sub-mm sources by a large factor if hot (40 – 60 K) starburst-like SEDs are assumed.
The sub-mm source counts alone do not constrain the dust temperatures and SEDs of the sources. Dust temperatures and inferred star formation rates are highly degenerate. Lower dust temperatures require substantially lower star formation rates to produce the same 850-m flux.
For dust temperatures in the range 20 – 25 K, the observed sub-mm counts agree very well with those predicted by hierarchical galaxy formation models. These low temperatures imply typical radii that correspond to angular sizes of arcsec if we assume an extended distribution of dust and stars with . This is a factor two to three larger than predicted for starburst-like SEDs. Observational limits on the size of sub-mm sources are scarce. Marginally resolved observations of the SCUBA galaxy Lockman850.1 with the Plateau de Bure interferometer, and follow up near infrared imaging, may indicate that the sub-mm sources are as large as predicted by our cold extended dust models. The typical redshift of the sources should then lie in the range , somewhat, but not significantly, smaller than in models which assume a starburst-like SED. These low temperatures substantially reduce the predicted mid-IR emission of the sub-mm sources. If our models are correct, SCUBA-selected sources may contribute less than expected to the counts in upcoming mid-IR surveys, which will be dominated by sources with hotter dust.
The low temperatures required to reconcile the sub-mm counts with the predictions of hierarchical galaxy formation models are not plausible for compact star-bursting galaxies, but they are expected if the emission comes from a more extended distribution of stars and dust. If most sub-mm galaxies have indeed extended distributions of cold dust with large sub-mm to UV/optical ratios this would naturally explain the small overlap with the population of Lyman–break galaxies, which is biased towards high surface brightness regions in actively star-forming galaxies.
7 Acknowledgements
We thank Andreas Efstathiou for making his code for the modelling of dust emission available, and the referee, J. E. G. Devriendt, for his helpful comments and suggestions.
References
- Alexander et al. (2001) Alexander D. M., Brandt W. N., Hornschemeier A. E., Garmire G. P., Schneider D. P., Bauer F. E., Griffiths R. E., 2001, AJ, 122, 2156
- Alton et al. (1999) Alton P. B., Davies J. I., Bianchi S., 1999, A&A, 343, 51
- Balland et al. (2002) Balland C., Devriendt J. E. G., Silk J., 2002, preprint (astro-ph/0210030)
- Bania et al. (2002) Bania T. M., Rood R. T., Balser D. S., 2002, Nature, 415, 54
- Barger et al. (1999) Barger A. J., Cowie L. L., Sanders D. B., 1999, ApJ, 518, L5
- Blain et al. (1999a) Blain A. W., Jameson A., Smail I., Longair M. S., Kneib J.-P., Ivison R. J., 1999a, MNRAS, 309, 715
- Blain et al. (1999b) Blain A. W., Kneib J.-P., Ivison R. J., Smail I., 1999b, ApJ, 512, L87
- Blain et al. (2002) Blain A. W., Smail I., Ivison R. J., Kneib J.-P., Frayer D. T., 2002, preprint (astro-ph/0202228)
- Calzetti & Giavalisco (2001) Calzetti D., Giavalisco M., 2001, Astrophysics and Space Science Supplement, 277, 609
- Chapman et al. (2000) Chapman S. C. et al., 2000, MNRAS, 319, 318
- Cole et al. (2000) Cole S., Lacey C. G., Baugh C. M., Frenk C. S., 2000, MNRAS, 319, 168
- Devriendt & Guiderdoni (2000) Devriendt J. E. G., Guiderdoni B., 2000, A&A, 363, 851
- Devriendt et al. (1999) Devriendt J. E. G., Guiderdoni B., Sadat R., 1999, A&A, 350, 381
- Dickinson (1998) Dickinson M., 1998, in The Hubble Deep Field Color-Selected High Redshift Galaxies and the HDF. pp 219+
- Eales et al. (2000) Eales S., Lilly S., Webb T., Dunne L., Gear W., Clements D., Yun M., 2000, AJ, 120, 2244
- Efstathiou & Rowan-Robinson (2002, hereafter ERR) Efstathiou A., Rowan-Robinson M., 2002, preprint (http://astro.ic.ac.uk/~mrr/cirrus2.ps)
- Efstathiou et al. (2000) Efstathiou A., Rowan-Robinson M., Siebenmorgen R., 2000, MNRAS, 313, 734
- Fardal et al. (2001) Fardal M. A., Katz N., Weinberg D. H., Davé R., Hernquist L., 2001, preprint (astro-ph/0107290)
- Farrah et al. (2002) Farrah D., Serjeant S., Efstathiou A., Rowan-Robinson M., Verma A., 2002, preprint (astro-ph/0205422)
- Fioc & Rocca-Volmerange (1997) Fioc M., Rocca-Volmerange B., 1997, A&A, 326, 950
- Flores et al. (1999) Flores H. et al., 1999, ApJ, 517, 148
- Genzel et al. (1998) Genzel R. et al., 1998, ApJ, 498, 579+
- Granato et al. (2000) Granato G. L., Lacey C. G., Silva L., Bressan A., Baugh C. M., Cole S., Frenk C. S., 2000, ApJ, 542, 710
- Griffin et al. (2001) Griffin M. J., Swinyard B. M., Vigroux L., 2001, The Promise of the Herschel Space Observatory. Eds. G.L. Pilbratt, J. Cernicharo, A.M. Heras, T. Prusti, & R. Harris. ESA-SP 460, p. 37, 460, 37+
- Guiderdoni et al. (1998) Guiderdoni B., Hivon E., Bouchet F. R., Maffei B., 1998, MNRAS, 295, 877
- Heckman et al. (1990) Heckman T. M., Armus L., Miley G. K., 1990, ApJS, 74, 833
- Hughes et al. (1998) Hughes D. H. et al., 1998, Nature, 394, 241
- Ivison et al. (2002) Ivison R. J. et al., 2002, preprint (astro-ph/0206432)
- Kauffmann et al. (1999) Kauffmann G., Colberg J. M., Diaferio A., White S. D. M., 1999, MNRAS, 303, 188
- Kauffmann et al. (1993) Kauffmann G., White S. D. M., Guiderdoni B., 1993, MNRAS, 264, 201+
- Lacey & Cole (1993) Lacey C., Cole S., 1993, MNRAS, 262, 627
- Lilly et al. (1999) Lilly S. J., Eales S. A., Gear W. K. P., Hammer F. ., Le Fèvre O., Crampton D., Bond J. R., Dunne L., 1999, ApJ, 518, 641
- Lutz et al. (2001) Lutz D. et al., 2001, A&A, 378, 70
- Lutz et al. (1998) Lutz D., Spoon H. W. W., Rigopoulou D., Moorwood A. F. M., Genzel R., 1998, ApJ, 505, L103
- Meurer et al. (1999) Meurer G. R., Heckman T. M., Calzetti D., 1999, ApJ, 521, 64
- Meurer et al. (1997) Meurer G. R., Heckman T. M., Lehnert M. D., Leitherer C., Lowenthal J., 1997, AJ, 114, 54
- Pettini et al. (1998) Pettini M., Kellogg M., Steidel C. C., Dickinson M., Adelberger K. L., Giavalisco M., 1998, ApJ, 508, 539
- Pettini et al. (2001) Pettini M., Shapley A. E., Steidel C. C., Cuby J., Dickinson M., Moorwood A. F. M., Adelberger K. L., Giavalisco M., 2001, ApJ, 554, 981
- Rowan-Robinson (1995) Rowan-Robinson M., 1995, MNRAS, 272, 737
- Rowan-Robinson (2001) Rowan-Robinson M., 2001, ApJ, 549, 745
- Rowan-Robinson et al. (1997) Rowan-Robinson M. et al., 1997, MNRAS, 289, 490
- Sanders & Mirabel (1996) Sanders D. B., Mirabel I. F., 1996, ARA&A, 34, 749+
- Scott et al. (2002) Scott S. E. et al., 2002, MNRAS, 331, 817
- Shu et al. (2001) Shu C., Mao S., Mo H. J., 2001, MNRAS, 327, 895
- Silva et al. (1998) Silva L., Granato G. L., Bressan A., Danese L., 1998, ApJ, 509, 103
- Smail et al. (1997) Smail I., Ivison R. J., Blain A. W., 1997, ApJ, 490, L5
- Smail et al. (1998) Smail I., Ivison R. J., Blain A. W., Kneib J.-P., 1998, ApJ, 507, L21
- Somerville & Primack (1999) Somerville R. S., Primack J. R., 1999, MNRAS, 310, 1087
- Steidel et al. (1998) Steidel C. C., Adelberger K. L., Dickinson M., Giavalisco M., Pettini M., Kellogg M., 1998, ApJ, 492, 428+
- Steidel et al. (1999) Steidel C. C., Adelberger K. L., Giavalisco M., Dickinson M., Pettini M., 1999, ApJ, 519, 1
- Veilleux et al. (1999) Veilleux S., Kim D.-C., Sanders D. B., 1999, ApJ, 522, 113