A Structural and Dynamical Study of Late-Type, Edge-On Galaxies: II. Vertical Color Gradients and the Detection of Ubiquitous Thick Disks
Abstract
We present an analysis of optical () and optical-infrared () color maps for 47 extremely late-type, edge-on, unwarped, bulgeless disk galaxies spanning a wide range of mass. The color maps show that the thin disks of these galaxies are embedded within a low surface brightness red envelope. This component is substantially thicker than the thin disk (4:1, vs 8:1), extends to at least 5 vertical disk scale heights above the galaxy midplane, and has a radial scale length that appears to be uncorrelated with that of the embedded thin disk. The color of the red envelope is similar from galaxy to galaxy, even when the thin disk is extremely blue, and is consistent with a relatively old () stellar population that is not particularly metal-poor. The color difference between the embedded thin disk and the red stellar envelope varies systematically with rotation speed, reflecting an increasing age difference between the thin and thick components in lower mass galaxies, driven primarily by changes in the age of the thin disk.
The red stellar envelopes are similar to the thick disk of the Milky Way, having common surface brightnesses, spatial distributions, mean ages, and metallicities. We argue that the ubiquity of the red stellar envelopes implies that the formation of the thick disk is a nearly universal feature of disk formation and is not necessarily connected to the formation of a bulge. Our data suggest that the thick disk forms early ( ago), even within galaxies where the bulk of the stars formed very recently (). We argue that several aspects of our data and the observed properties of the Milky Way thick disk argue in favor of a merger origin for the thick disk population. If so, then the age of the thick disk marks the end of the epoch of major merging, and the age difference between the younger thin disk and the older thick disk can become a strong constraint on cosmological constants and models of galaxy and/or structure formation.
Department of Astronomy, University of Washington, Box 351580, Seattle WA, 98195
Department of Astronomy, University of Michigan, Ann Arbor MI, 48109
Draft version
Subject headings: galaxies: formation — galaxies: halos — galaxies: stellar content — galaxies: structure — galaxies: spiral — galaxies: irregular
1 Introduction
Currently, most observational studies of galaxy formation focus on two epochs – extremely high redshift, where one can observe galaxy formation in progress, and zero redshift, where one can disentangle past history using individual stars within the Milky Way. While each of these approaches has been essential in shaping our current view of galaxy formation, they each have fundamental limitations.
At high redshifts, it is extremely difficult to match galaxies to their low redshift descendents due to morphological transformation, luminosity evolution, and merging; only changes in the mean galaxy population can be tracked, revealing few details of the physical mechanisms which drive evolution. In contrast, within the Milky Way a wealth of detail can be extracted from the ages, metallicities, and kinematics of stars, allowing us to trace the formation of the faintest individual components of the Galaxy (the stellar halo, the thick disk, tidal streams, etc). However, in the end these data address only the formation of the Milky Way, and give no constraints on how galaxy formation proceeds in the mean population, or varies with fundamental parameters (e.g. mass, angular momentum, local density, etc.).
An opportunity to bridge these regimes lies in the realm of nearby galaxies, just beyond the confines of the Local Group. At moderate distances (), galaxies of all types are plentiful and are extremely well resolved spatially ( from the ground, or from space), allowing us to trace their morphology and internal dynamics on small spatial scales. These features can be studied at very high signal-to-noise and/or at low surface brightnesses inaccessible at higher redshifts. To place observational constraints on the process of disk galaxy formation using nearby galaxies, we are engaged in a comprehensive program to study the dynamics, gas content, metallicity, and stellar populations of a population of late-type, bulgeless disk galaxies. This population forms a structurally uniform sample, allowing us to isolate changes in the physical properties of the galaxies (i.e. mass, angular momentum, etc.) independent of changes in morphology, akin to what is possible with the nearly single parameter sequence spanned by elliptical galaxies. By avoiding systems with bulges, we also limit the degree to which the baryonic component of the galaxy may have been affected by dissipation or angular momentum transport during formation. This yields a sample which represents the purest endpoint of the disk galaxy formation process. Details of the sample selection and the optical and infrared imaging can be found in Dalcanton & Bernstein 2000 (hereafter “Paper I”).
In this paper we use the imaging presented in Paper I to undertake an analysis of the color maps of the bulgeless, edge-on disks which comprise our sample. We focus our attention on the vertical color gradients within the galaxies, probing the stellar populations of the galaxies at many scale heights above the thin disk. Buried within these low surface brightness components are the remnants of some of the earliest epochs in the assembly of galaxies, namely the thick disk and stellar halo.
Because the typical metallicity of a galaxy tends to increase with time, it has long been recognized that the low metallicity thick disk and stellar halo are fossil records of the very early history of the Milky Way. Detailed studies of their kinematics and metal abundance have revealed signatures of the processes which led to their formation over 10 billion years ago, even though these components contain only a small fraction of the total stellar mass of the Milky Way. In general, these two components are thought to be the leftovers from either the monolithic, dissipative collapse of the early galaxy (Eggen et al. 1962, hereafter “ELS”) or the buildup of the galaxy through hierarchical merging (Searle & Zinn 1978). Because of the low surface brightness of stellar halos and thick disks, it is impossible to study their formation directly at high redshift (due to cosmological dimming), and we are confined to deducing their history from very low redshift data alone.
Almost all of the detailed knowledge of the formation of thick disks and stellar halos comes from evidence within the Milky Way alone (see van den Bergh 1996 for a review), teaching us little about galaxy formation in general. For this reason, astronomers have attempted to identify these faint components in other very nearby galaxies, particularly in the edge-on orientation where the light from the younger thin disk can be minimized (Burstein 1979, Tsikoudi 1979, van der Kruit & Searle 1981). Previous detections of possible halo or thick disk stellar light in external galaxies have been made in a scant handful of nearby edge-on galaxies (e.g. recently Neeser et al. 2000, Fry et al. 1999, Zheng et al. 1999, Morrison et al. 1994, Näslund & Jörsäter 1997, Morrison et al. 1997, Sackett et al. 1994, van Dokkum et al. 1994, Shaw & Gilmore 1990; see §8.2.2 below for further discussion). Typically, the presence of a thick disk or stellar halo has been identified by the need for an additional disk component when attempting to fit models of the light distribution in a deep image. Not all galaxies have required this second component, however. Instead, thick disks have only been identified in a handful of relatively massive Sc (or earlier) galaxies with substantial bulges (see summary by Morrison 1999).
One limitation of the previous searches for thick disks is that almost all have been based on imaging in a single passband, discriminating between the thick disk and thin disk components through subtle changes in the surface brightness profile perpendicular to the plane. It is therefore difficult to make a unique decomposition of the thick and thin disks when neither dominates in the region studied, as noted by Morrison et al. (1997). In this paper, however, we use multi-color imaging to identify thick disks via the systematic changes in broad band colors produced by the variation in the stellar populations of the thick and thin disks. As we show below, we find unambiguous evidence for stellar envelopes surrounding the majority of the nearly 50 disks in our sample, across all galaxy masses.
The structure of the paper is as follows. We begin by briefly summarizing the galaxy sample and imaging data in §2. We present color maps in §3 and discuss the general, qualitative implications for vertical color gradients, radial color gradients, and the presence of dust in the sample. We further quantify the results in §4 and interpret them based on comparison with stellar population models in §5. We show that the color gradients and color maps argue for the presence of old, red stellar envelopes around most, if not all, disk galaxies. We analyze the shapes of the stellar envelopes in §6. Color gradients and isophotes are more difficult to interpret in the more massive galaxies for a variety of reasons which we discuss in §7. In §§8 & 9, we suggest that the stellar envelopes in this sample are analogous to the thick disk of the Milky Way and have properties consistent with those expected by a stochastic merging scenario for the formation of the thick disk. To conclude, we discuss the general constraints which can be placed on galaxy formation based on the observation of ubiquitous thick disks (§10).
2 Data
As described in detail in Paper I (Dalcanton & Bernstein 2000), our sample of edge-on bulgeless galaxies was initially selected from the Flat Galaxy Catalog (FGC) of Karanchentsev et al. (1993), a catalog of 4455 edge-on galaxies with axial ratios greater than 7, and major axis lengths of . The FGC was originally selected by visual inspection of the O POSS plates in the north () and the J films of the ESO/SERC survey in the south (); galaxies from the ESO plates are known as the FGCE, and have slightly different properties due to small differences in the plate material111The FGC catalog has been recently revised to make the RFGC (Karachentsev et al. 1999), which has a different numbering scheme. However, we have chosen to retain the original FGC numbers from the original 1993 catalog for consistency with Paper I.. From the combined FGC/FGCE catalog we selected galaxies which appeared undisturbed, bulgeless, and have no signs of inclination (major-to-minor axis ratio ; see Figure 2 in Paper I). Our final sample contains 49 galaxies. One of these galaxies, FGC 1971, appears to be a polar ring galaxy, and we do not include it in the analysis presented here. Another galaxy, FGC 2292, is between two relatively bright stars, producing significant scattered light in our images, and prohibiting surface brightness measurements at the faint levels possible in the rest of the survey. Results based upon this galaxy are included for completeness, but should be used with caution. Finally, while the initial sample appeared to be “bulge-free” on digitized POSS-II survey plates, our deeper imaging revealed the presence of small bulges in a few of the galaxies. FGC 227, FGC 395, FGC 1043, FGC 1440, FGC 2217, FGC E1447, and FGC E1619 all have small bulges, as indicated by visual inspection of the infrared imaging, and/or by a significantly increased quality of fit to the radial profile when a double exponential disk model is used instead of a single exponential model (judged via the ratio of the values). The “bulges” in FGC 227, FGC 395, FGC 1043, and FGC 1440 are in general extremely small and may not represent truly kinematically distinct components in most cases; they may be edge-on manifestations of “pseudo-bulges” (Kormendy 1992). Only in FGC E1447, FGC E1619, and possibly FGC 2217 do the bulges appear prominent and vertically extended in the band images. Our analysis includes all these galaxies for completeness, but our results do no change if they are excluded. FGC E1447 is excluded from our analysis, however, because we do not have a measured rotation speed for the galaxy.
We obtained multi-wavelength imaging for the sample at the Las Campanas du Pont 2.5m telescope as part of an extensive observational program. The optical ( & ) and infrared () imaging, and its reduction and calibration, have all been presented in Paper I, and the resulting calibrated images form the basis for the work presented in this paper. The optical data have photometric calibration uncertainties of mag, sub-arcsecond spatial resolution, and flat fielding accurate to in and in on scales larger than 10′′ (see Paper I). The majority of the infrared data were taken in photometric conditions ( mag) with seeing of . However, due to limitations in sky subtraction and flat fielding, the infrared data can reach only to in on 10′′ scales. Any regions with contaminating foreground or background sources or without complete bandpass coverage are masked from our surface brightness and color analysis.
In addition to our deep imaging, we have substantial information on the dynamics of the galaxies in the sample. More than of the sample have single-dish HI observations, yielding corrected line widths at 50% peak flux (), as compiled in Paper I. The majority of these measurements are from a large survey of FGC galaxies observed at Arecibo by Giovanelli et al. (1997). These are supplemented with measurements for FGC 164 from Schneider et al. (1990), for FGC 84 & 2264 from Matthews & van Driel (2000), and for FGC 349 from Haynes et al. (1997). We have also obtained long-slit H rotation curves for 34 galaxies in the sample, using the du Pont 2.5m telescope. These rotation curves (Dalcanton & Bernstein 2000, Dalcanton & Bernstein 2003 in prep.) are used to supplement the dynamical information available from the HI observations. Throughout this paper we will consider galaxies as a function of their rotational velocity , which we take to be if HI data is available, or the maximum measured for the optical rotation curve if no radio data exists. For the 23 galaxies where both are available, we find that , suggesting that on average, and are equivalent measures of rotation speed. However, for 5 of these 23 galaxies with both optical and HI kinematics, and differ by more than 20%, and thus there may be substantial offsets in the adopted in individual cases where HI data was lacking.
3 Color Maps
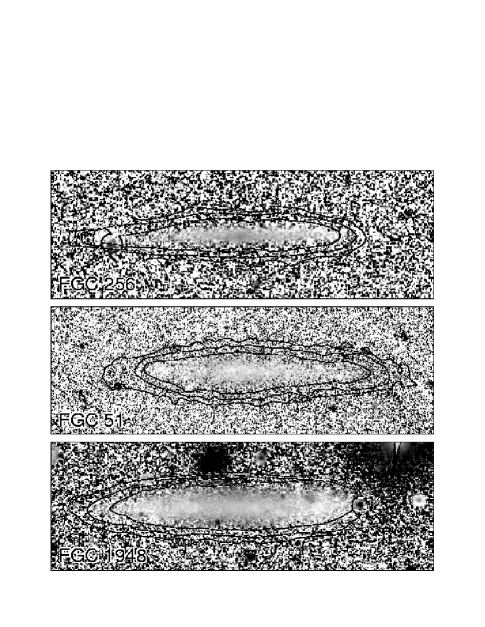
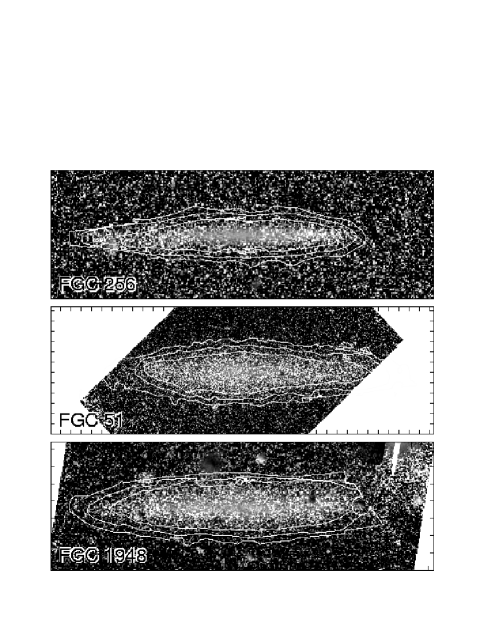
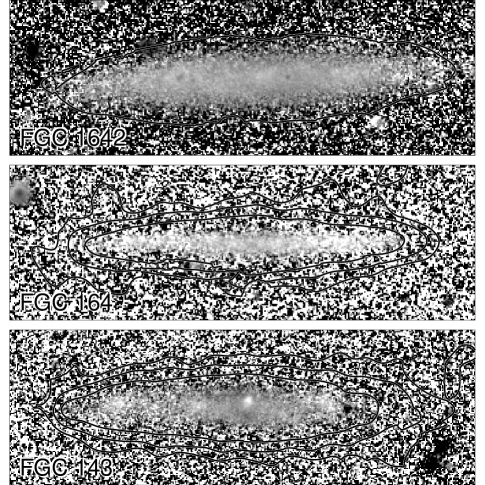
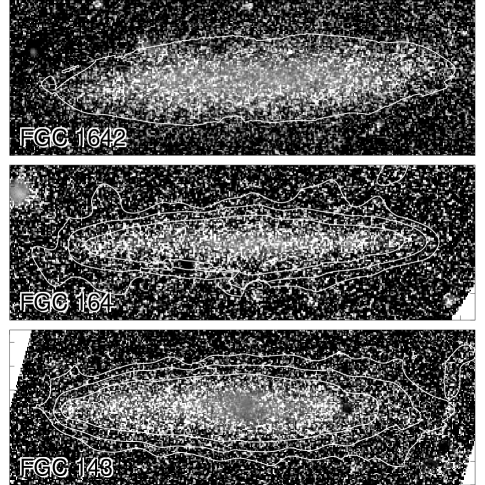
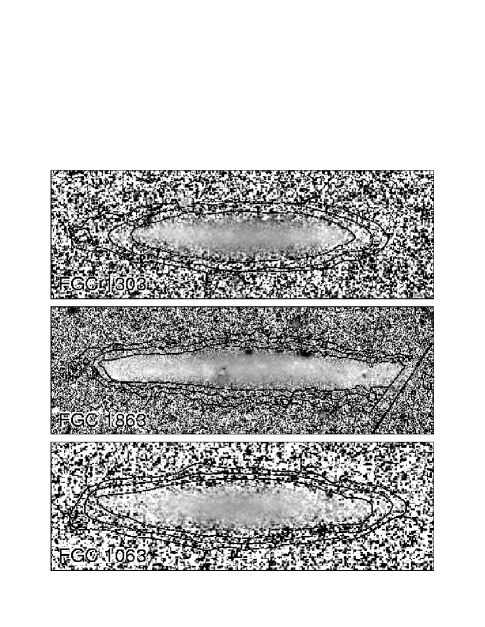
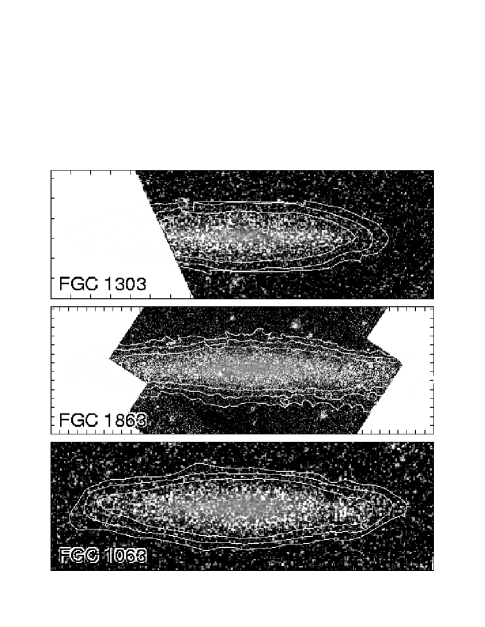
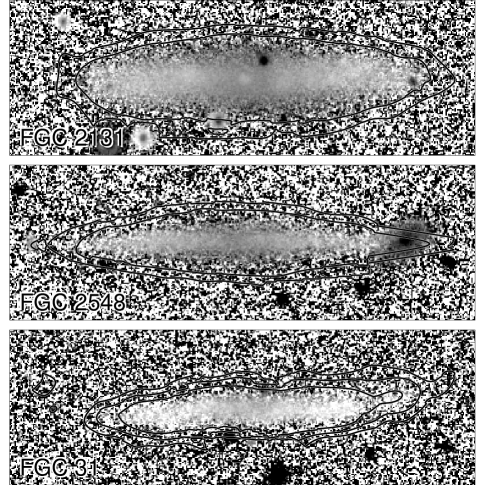
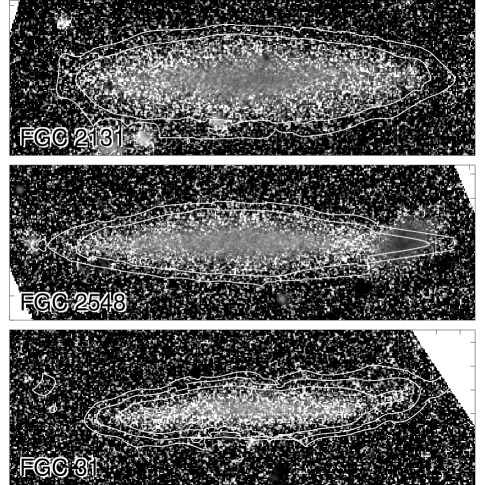
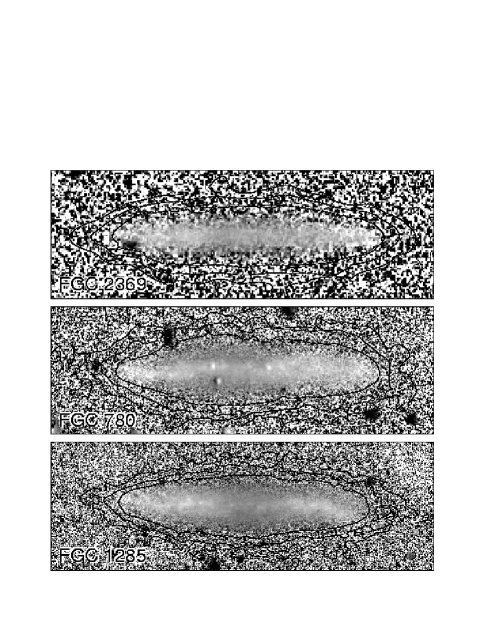
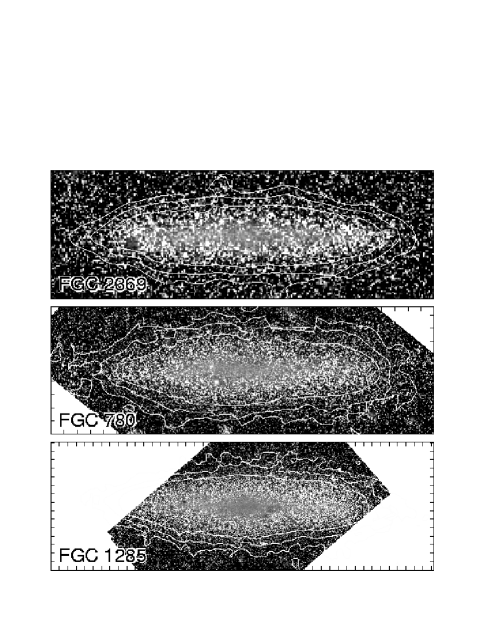
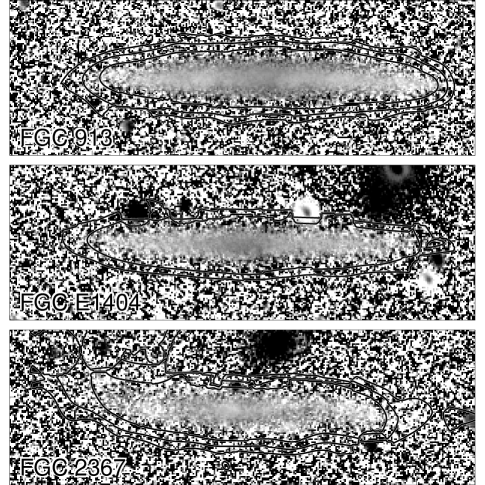
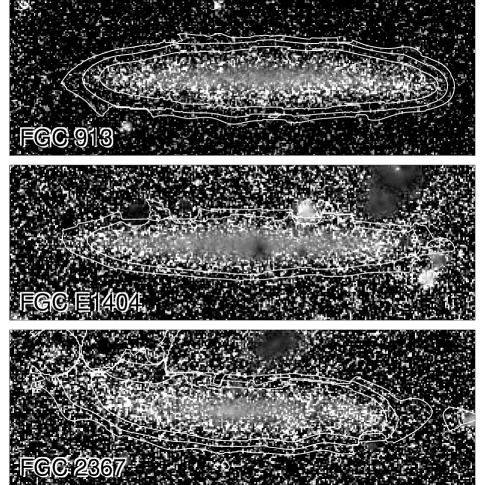
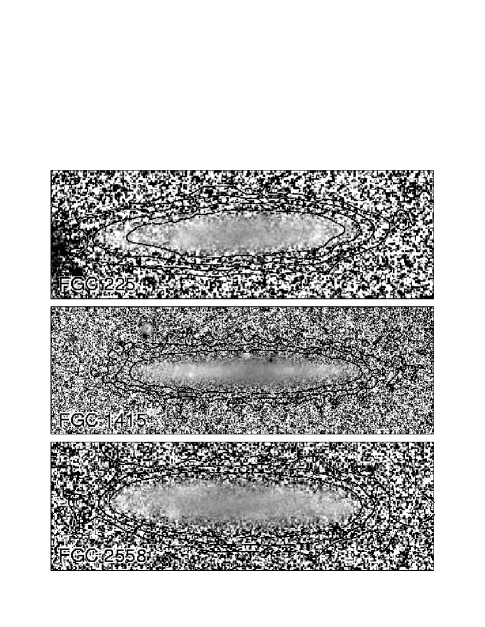
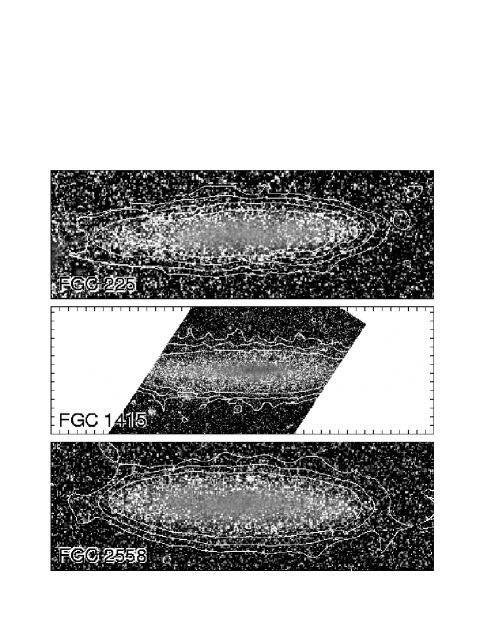
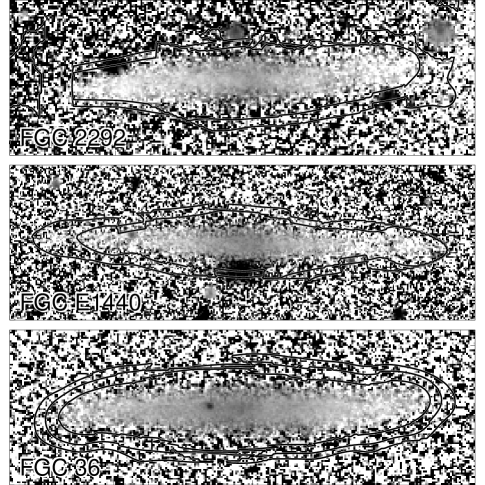
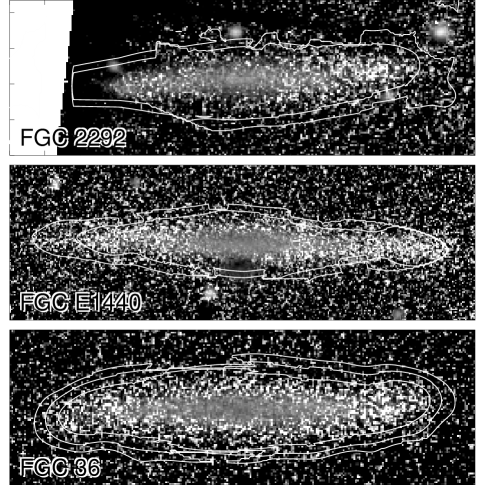
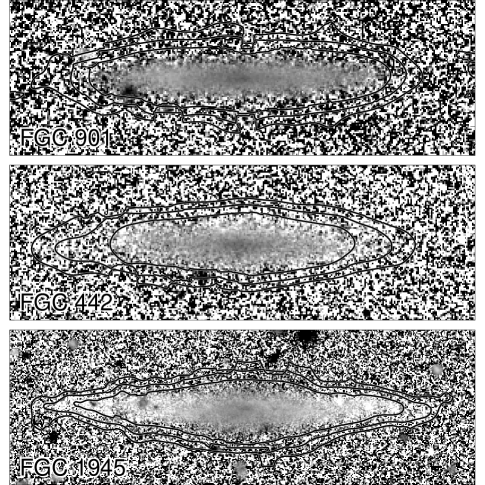
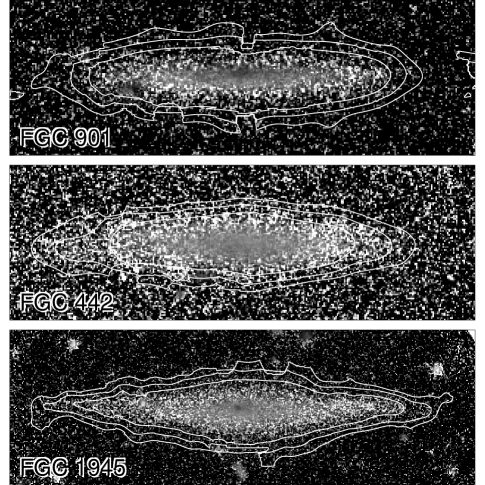
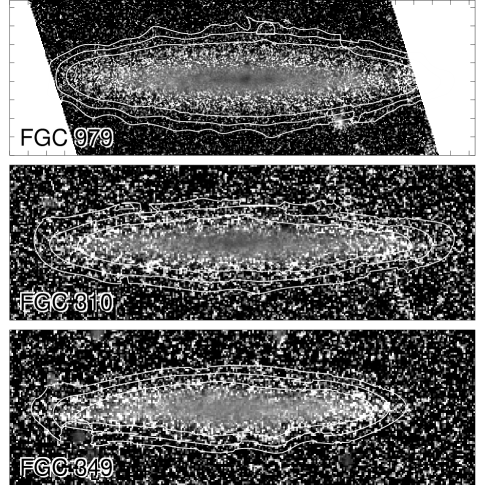
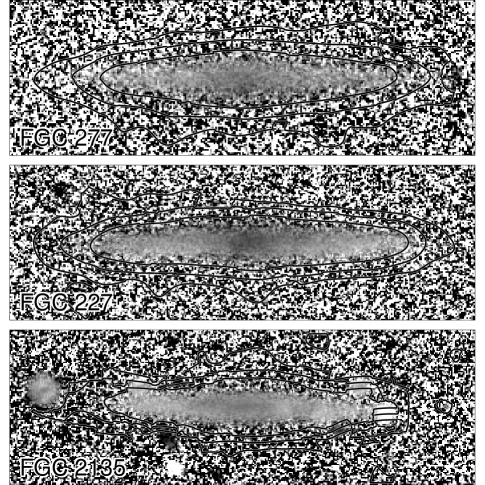
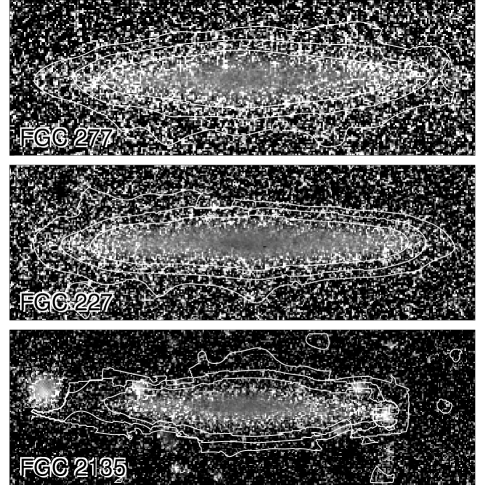
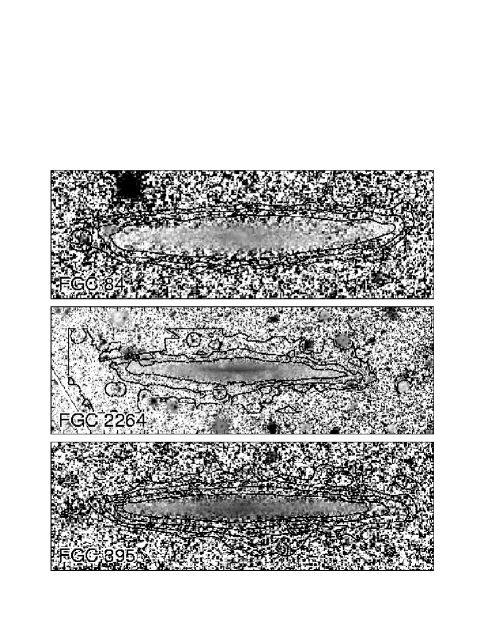
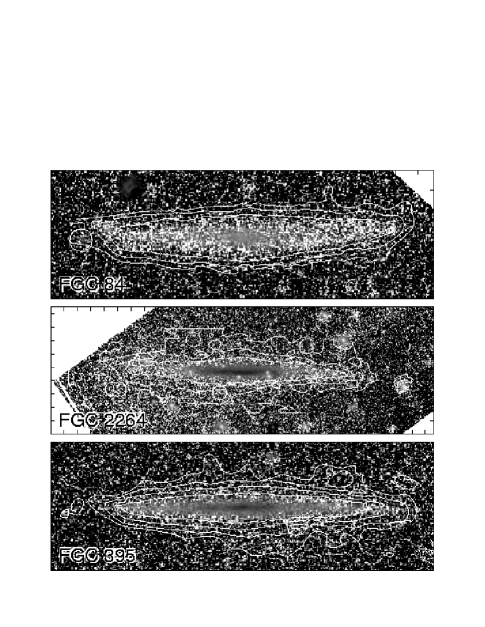
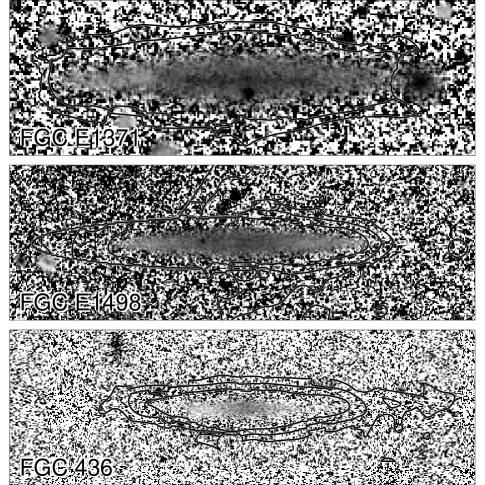
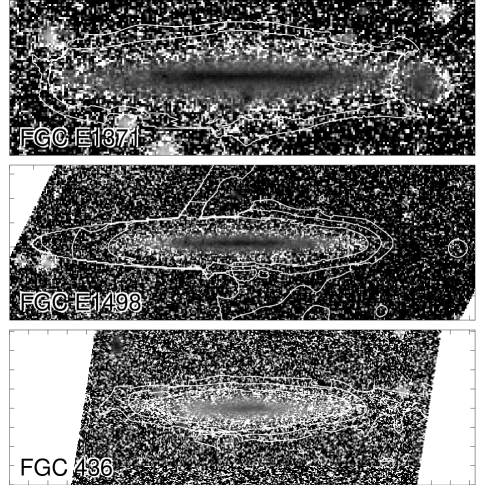
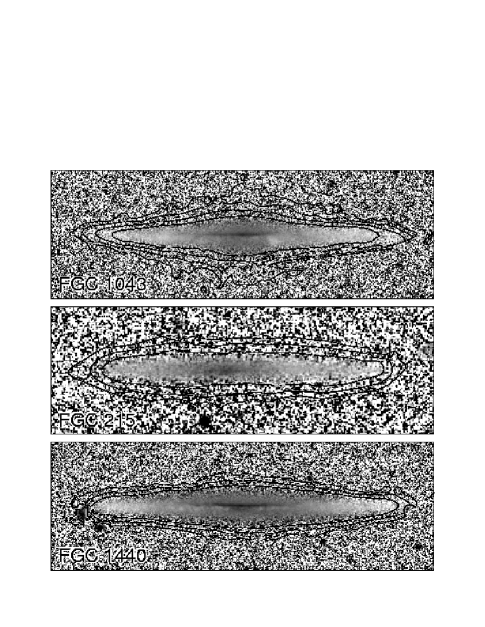
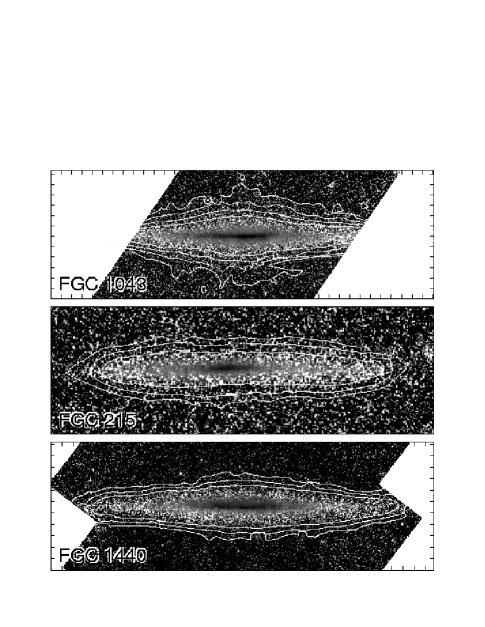
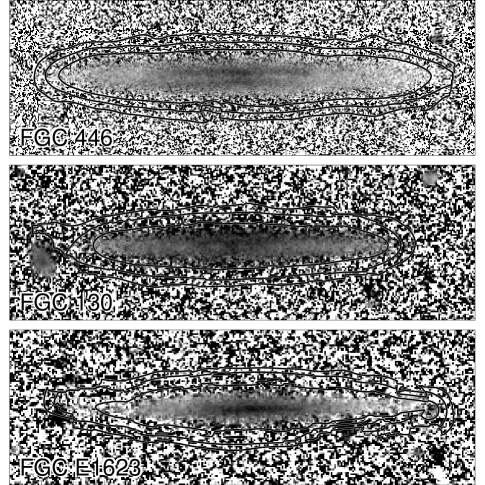
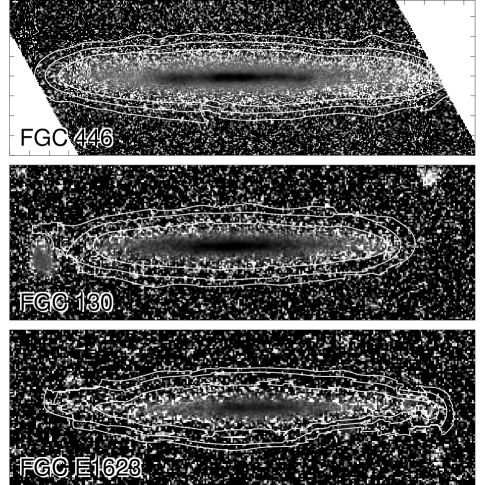
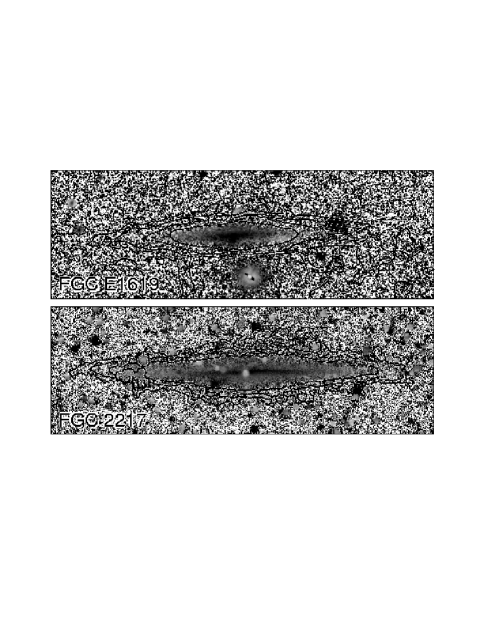
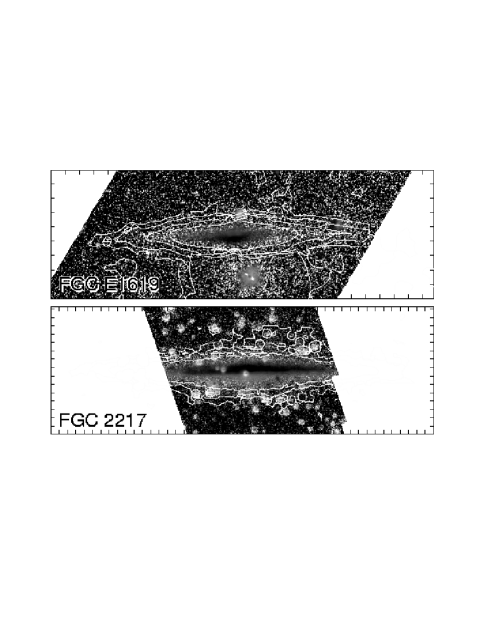
In Figure 1 we present (left column) and (right column) color maps of the sample galaxies, sorted in order of decreasing rotation speed . Sky-subtracted images of the galaxies in , , and can be found in Paper I, but for reference the faintest -band contours from Figure 3 in Paper I have been superimposed on the color maps to show the maximum detected extent of the galaxies. All of the galaxies are displayed with the same minimum and maximum color, and have been corrected for foreground extinction using the Schlegel et al. (1998) dust maps, assuming an R=3.1 extinction law. Apparent variations from galaxy to galaxy therefore reflect true variations in color. For display purposes, we have generated the color maps using “asinh magnitudes” (Lupton et al. 1999). The asinh magnitudes are effectively identical to traditional logarithmic magnitudes at high signal-to-noise, but unlike normal magnitudes, they are mathematically well-behaved even for negative fluxes (such as occur at low signal-to-noise). We found that the use of asinh magnitudes greatly increased our ability to visually detect features in the color maps.
Before we begin a quantitative analysis, there are a number of qualitative features to note about the color maps in Figure 1. We discuss these briefly below.
3.1 Strong Vertical Color Gradients
Among of the strongest features recognizable in the color maps in Figure 1 are strong color gradients with increasing height above the mid-plane. In the most massive galaxies, these color gradients are clearly due to the presence of strong dust lanes, which create a very red midplane, embedded in a bluer, unreddened stellar envelope. However, in the less massive galaxies, the situation is quite different. These low mass galaxies have a very blue midplane, embedded in a much rounder red stellar envelope. Looking at the high signal-to-noise maps of the most spatially well-resolved low mass galaxies in the sample (for example FGC 51, FGC 780, or FGC 1285), a thin blue disk superimposed on a much rounder red stellar population is evident. We will quantify these results and discuss them in detail below.
3.2 Strong Radial Color Gradients
In Figure 1, strong radial color gradients are also evident along the midplane, even in those disks which are partially obscured by dust. These gradients are particularly noticeable in the higher signal-to-noise color maps. The gradients are all in the sense of having a very blue outer disk and red inner disk. If these disks are optically thin over much or all of their extent, then this apparent radial gradient is simply the edge-on manifestation of the well-studied radial gradients seen in face-on galaxies. In the massive galaxies with clear dust lanes, the gradient is likely to be accentuated by an edge-on viewing geometry, due to larger reddening in the inner regions. A systematic analysis of radial color gradients has recently been presented by Bell & de Jong (2000) for a large sample of face-on galaxies, using techniques similar to those adopted in this paper. They find that age, not metallicity or dust, is the primary driver for the bluing in galaxy disks with increasing radius. As there is no reason to believe that the disks in our sample are not comparable to the face-on late-type disks in theirs, it is likely that age is the principal driver of the radial color gradient in our disks as well. We will not pursue an analysis of radial color gradients independently with our sample because dust will always complicate the interpretation of edge-on colors relative to comparable face-on disks. However, it should be possible to compare the face-on and edge-on samples to limit the dust properties within the disks. We defer that analysis to a later paper.

3.3 The Presence of Dust
We can place some constraints on the overall dust content of the galaxies by comparing the global colors of the edge-on FGC sample with comparable face-on galaxies. We would expect that edge-on galaxies with substantial obscuration would be reddened, and thus offset in color from similar late-type disks viewed face-on. In Figure 2 we plot the vs colors of our FGC sample (based on flux within the 25 isophote222These colors are slightly different than those derived from the magnitudes published in Paper I. Here, we have eliminated masked regions from the determination of the color, whereas the magnitudes in Paper I have used models of the galaxies to attempt to recover light missing from the masked regions.; solid circles) compared with the total disk colors of the face-on spirals from de Jong (1996; small crosses), measured using the derived disk central surface brightness and scale lengths in , , and , assuming that the magnitude zero point offset between and () is smaller than the photometric errors.
The edge-on FGC galaxies with obvious dust lanes have been plotted with an asterix, and, as expected, lie significantly redward of the face-on disks. However, the vast majority of the remaining FGC galaxies have colors which are indistinguishable from the face-on disks. If anything, they are bluer. This suggests that in the galaxies without dust lanes, there either must be very little dust overall, or the dust must be distributed in clumps which are optically thick even in , so that only unreddened light escapes the galaxy. In either case, Figure 2 suggests that the overall colors we measure are only marginally affected by dust (even if the measured luminosity is too low). In §5.3.1 below, we discuss the role that dust may play on the derived gradients in more detail.
4 Extraction of Vertical Color Profiles
Of the qualitative trends discussed above, we concentrate hereafter on quantifying and interpreting only the vertical color gradients. We begin in this section by extracting the surface brightness profiles perpendicular to the galaxy midplanes.
Because the galaxies in our sample span a wide range in physical scales, we characterize the color gradients as a function of the galaxies’ scale length and height rather than fixed physical units (i.e. kiloparsecs). We derive a single scale height and midplane position for each galaxy by fitting vertical profiles across the galaxy. For the analysis which follows, we have adopted a single value for the location of the midplane and for the vertical scale height333For an exponential vertical surface brightness distribution of scale height , as is commonly assumed, . by averaging the values of and within one disk scale length on either side of the center. Over this range in radius, the values of and do not vary significantly in any systematic way, as the galaxies possess no strong warps in their central regions, and are nearly uniform thickness in the infrared. We do this fitting using the masked images, which are representative of the old stellar population, less affected by dust, and less contaminated by bright foreground or background objects.
The vertical profiles are derived in narrow bins of projected radius by fitting a generalized profile (van der Kruit 1988) to the surface brightness distribution. From these fits we derive the midpoint of the disk and the vertical scale height such that half of the flux is contained within . In a few of the lowest mass galaxies, the band surface brightness is sufficiently low that the fits do not converge; in these handful of cases we adopt the -band midplane and scale height instead. The resulting fits are integrated over to derive the total “vertical flux” at each projected radius. Finally, the disk scale length is identified by fitting an optically-thin edge-on exponential disk profile: , where is a modified Bessel function (van der Kruit & Searle 1981a). A full analysis of these structural parameters will be presented in a separate paper.
Using the adopted midplane location, we extract the mean flux from the sky-subtracted , , and images in logarithmically spaced bins parallel to the midplane. We average data above and below the plane to maximize our signal-to-noise at faint light levels, but repeat the analysis independently on each side to quantify potential systematic offsets (see below). We mask out foreground and background sources, and then calculate a mean height for each bin based on the unmasked pixels. The same mask is used in all three bandpasses, so that colors are determined using identical apertures. We have not attempted to match the seeing between bands, because (i) the seeing was almost always comparable in all observations (0.8-1.1′′), (ii) the scale heights of the disks are substantially larger than the point spread function, and (iii) the gradients we are tracking vary smoothly over several disk scale heights, and will not be affected by 10-20% variations in the seeing (see also §4 and Figure 4 below).
The color in each bin is calculated from the flux through two separate bandpasses, and is corrected for foreground extinction (§3). The errors on individual points are taken to be the quadrature sum of the Poisson photon counting errors in the flux and the overall uncertainty in the sky level determination as measured in Paper I. The read noise and photometric calibration errors are negligible compared to photon counting errors and the sky level uncertainty, and are not propagated. We note that the resulting error bars do not represent uncorrelated Gaussian random errors, because errors in the sky level determination will produce correlated, systematic offsets in the overall color profile. These correlated errors due to sky subtraction dominate the uncertainties in the extracted profiles at large scale heights. We take the correlated errors into account when assessing the errors in the color gradients in §5.1 below.
We limit our analysis to the central region of the galaxy, within disk scale length from the center, where we have sufficient signal-to-noise for measuring the color of the galaxy out to very large scale heights ( in ). The color gradients are only weakly varying with radius at the large scale heights which interest us (see Figure 1). Variation of the color gradients with radius is therefore dominated by the well-known radial color gradient of the thin stellar disk, not the fainter populations on which we focus here.
The resulting surface brightness profiles and color gradients are shown in Figure 3, sorted in order of increasing rotation speed. The top panel shows the mean surface brightness profiles in , , and as a function of the number of vertical scale heights above the plane. The middle and lower panels show the and profiles, respectively. The profiles have been plotted using the average values above and below the plane, plotting points in and where the uncertainty mag, and points in where mag.
Figure 3 shows that, as suggested by Figure 1, we can indeed make significant measurements of the galaxies’ colors well above their midplanes. We do not believe that this extraplanar light we have detected is an artifact of the point-spread function (PSF). First, the imaging data were taken in excellent conditions of or better. Second, the du Pont 2.5m has a well-characterized PSF with little large angle scattering (see Bernstein et al. 2002, Bernstein & Crick 2002). To briefly verify that the faint light in our images is not due to scattered light, in Figure 4 we plot the radial surface brightness profiles of stars in several representative images in each bandpass, including examples of the best seeing and the worst seeing. In all cases, the surface brightness of the stellar point-spread function (PSF) drops rapidly, falling by at 2 times the full-width half max (FWHM) of a Gaussian fit to the PSF. In contrast, the surface brightness of our galaxies fall by over more than ten times the FWHM of the stars in the field (marked with a vertical arrow in Figure 3, indicating a distance of from the midplane of the galaxy). The extraplanar light is therefore not due to the PSF.
In addition to large angle scattering from seeing, spurious color gradients could be produced by inaccuracies in the sky-subtraction and/or flat fielding. Flat-fielding errors would produce erroneous color gradients that differed from one side of the galaxy to the other, but which were reproduced in all galaxies from a given night. Sky subtraction errors would lead the outskirts of galaxies to be too blue or too red depending upon the degree of under- or over-subtraction in different filters. This would tend to lead to color gradients with random signs. As discussed in Paper I, the flat-fielding and sky subtraction of this data set has been done with great care, and we have developed new techniques for quantifying the errors associated with these steps. Our measured uncertainties have been propagated into the error bars in Figure 3, and demonstrate that the gradients are not due to flat-fielding or sky-subtraction errors.
As an additional test for these large-scale uncertainties, we explore the possibility of systematic errors by comparing the color gradients derived above and below the plane. In Figure 5, the shaded regions indicate the difference between the colors derived on each side of the midplane, plotted in order of increasing rotation speed. In general, the colors are quite consistent between the two sides, and show gradients that are much larger than the systematic differences. Occasional deviations are seen at the outermost points in the profiles beyond , where the flux is very low, and in the inner parts of the more massive galaxies in , where the combined effects of dust lanes and slight deviations from an exactly inclination are important. These latter cases do not suggest errors in measurement but rather a well-understood effect that has been previously used to analyze the opacity of disks (Jansen et al. 1994, Knapen et al. 1991).


5 Interpretation of the Vertical Color Gradients


The color gradients plotted in Figures 3 & 5 show strong trends when sorted by rotation speed. In the fast rotating, higher mass galaxies with obvious dust lanes, we see color gradients which become bluer with increasing height but then level out to roughly uniform color. In these galaxies, the stellar population is highly reddened by dust within the plane, leading the galaxy to appear bluer at large scale heights where the stellar population becomes unobscured. In somewhat lower mass galaxies the effects of dust lanes disappear and the central color gradients flatten out in both and . At even lower masses, the trends reverse, and the color gradient becomes steep again, but such that the stellar populations become redder above the plane. These steep gradients are visible in both colors ( and ).

To explore these trends further, in Figure 6 we overplot all of the color profiles from the galaxies in Figure 3. While the galaxies start with a very wide range of colors close to the midplane, they have a much smaller range of colors well above the plane , with , and ; the same effect is visible in Figure 7, discussed below.
The simplest explanation for the above trends is that the galaxy disks are all embedded in a faint stellar envelope whose observable properties vary little from galaxy to galaxy, while the properties of the embedded thin stellar disk varies systematically with mass. In other words, the behavior of the vertical color gradients shown in Figures 3 & 5 results primarily from variations in the properties of the disk at the midplane, not from galaxy-to-galaxy variations in the surrounding stellar envelope. The high mass galaxies have red midplanes due primarily to dust, and thus they get rapidly bluer with increasing scale height. The low mass galaxies have active star formation and low metallicities (e.g. Stasinska & Sodré 2001, Zaritsky et al. 1994), and thus extremely blue disks, with much redder colors above the plane. We further quantify the color gradients, stellar populations, and envelope structure below.
5.1 Quantifying Vertical Color Gradients

In order to quantify the amplitude of the color gradients shown in Figures 3 & 5, we measure the slope of the color gradient as a function of scale height by fitting line segments to the vertical color profiles which were extracted in §4, in a series of scale height intervals. We restrict the fitting to , using the color profiles plotted in Figure 3 averaged above and below the plane.

Ascribing uncertainties to the measured slopes is somewhat complicated. Poisson photon-counting errors produce nearly Gaussian random errors in the measured fluxes, which are uncorrelated as a function of scale height. However, uncertainties in the sky subtraction can produce correlated errors in the surface brightness profile, and thus systematic trends in the slope of the color gradient. To quantify the uncertainties in the slope, we follow the method of Bell & de Jong (2000) and run a series of Monte Carlo simulations on the measurement of the slope. In each filter, for each point in the extracted surface brightness profile, we let the flux vary as a Gaussian with a width set by the amplitude of the photon-counting uncertainties; we ignore the photometric calibration uncertainties, which are negligible. We then choose a value for the sky level drawn from a Gaussian distribution with a width set by the sky uncertainties measured in Paper I. We then use the new flux in each radial bin and the new global sky level to recalculate the color profile, and fit the slope. We run 1000 trials for each galaxy, and then measure the standard deviation of the resulting distribution of slopes. The measured slopes and their uncertainties are plotted in Figure 8, as a function of the galaxies’ rotation speeds.
The trends evident in Figures 3 & 5 are reproduced clearly in Figure 8. Near the plane (i.e. the left hand panels), the amplitude and sign of the vertical color gradient depend strongly upon a galaxy’s circular velocity. In high mass galaxies, the galaxy becomes progressively bluer above the plane as one rises above the dust lane, leading to negative color gradients. As the mass of the galaxy decreases, dust becomes less important and the disk becomes bluer, erasing the color gradient. At low masses, galaxies behave in the opposite manner; the galaxies becomes redder in both and above the plane, as one rises above the presumably young, metal-poor star-forming disk, producing positive color gradients.
Within individual galaxies, the color gradient becomes shallower with increasing height above the plane, as can be seen by comparing a single row of panels in Figure 8. In other words, the color becomes more uniform at larger scale heights. In the high mass galaxies, the amplitude of the color gradient flattens rapidly, because the large color gradient is almost entirely due to dust confined to a thin plane (typically ; Xilouris et al. 1999). In lower mass galaxies, the gradient is statistically significant out to . Beyond this, only one or two galaxies have color gradients which are different than zero at a level, although their average trend as a group is towards a halo which continues to redden outwards, although at a lower rate. The only galaxy which gives a statistically significant negative gradient in the range is FGC 2264, which is in a crowded field at low galactic latitude. It is probable that the size of the error bar for this galaxy does not reflect the true uncertainties due to spatially variable extinction and to the unusually complicated foreground source subtraction.
5.2 Comparison with Previous Detections of Vertical Color Gradients in Other Galaxies
A number of previous color gradient studies have focussed on understanding the dust content and stellar populations of the young thin disk, but those efforts have mostly concentrated on color gradients near the midplane, rather than at large scale heights. This in part reflects the difficulties in acquiring data of sufficient quality at very low count levels, even with modern CCDs.
Of previous work, we have identified only two studies which specifically address color gradients at large scale heights above disk-dominated galaxies. The largest systematic study so far (de Grijs & Peletier 2000) finds a preponderance of gradients which become redder in with increasing scale height in the region 1-3 (corresponding to 0.6-1.8), with a slight trend towards larger gradients in late-type, lower mass galaxies. However, the amplitude of the detected gradients was typically quite small as would be expected on the basis of our results, given the high masses of the galaxies dominating their sample. Their conclusions were much also narrower in scope due to an inability to trace the colors beyond . Moreover, the majority of their sample contained bulges (Sc or earlier) whose presence greatly complicates the analysis of the disk colors alone, and possibly masks any faint stellar envelope. A similar problem affects the suitability of comparing our work to the color gradients measured by Shaw & Gilmore (1990) for four galaxies with much more prominent bulges than in our sample.
More immediately applicable to our sample is the detailed study of the nearby edge-on bulgeless galaxy UGC 7321, analyzed by Matthews et al. (1999). The properties of this galaxy are comparable to those found in our sample, including the detection of reddening of with increasing scale height. More detailed analysis of the dust properties of this galaxy (Matthews & Wood 2001) suggest that the actual color difference of the stellar population might be even larger (by mag). Again, these results are similar to the color gradients we have detected in comparable galaxies.
5.3 Age & Metallicity of the Stellar Envelope
The vertical color gradients shown in Figures 3 – 8 and found in other studies are almost certainly due to some combination of vertical variations in the mean stellar population and reddening due to dust extinction. In the most massive galaxies (), the presence of strong dust lanes suggests that reddening dominates the color gradient close to the plane. However, other detailed work modeling massive edge-on disks suggests that the dust is confined to a thin plane, and is unlikely to affect the observed colors at large scale heights (e.g. Xilouris et al. 1999). In the less massive galaxies without dust lanes, reddening is unlikely to play a dominant role in shaping the color gradients (see §3.3, and Matthews & Wood 2001). The color gradients are therefore likely to be due to true changes in the stellar population in the lower mass galaxies and in the dust-free regions well above the plane of the high mass galaxies (de Grijs & Peletier 2000).
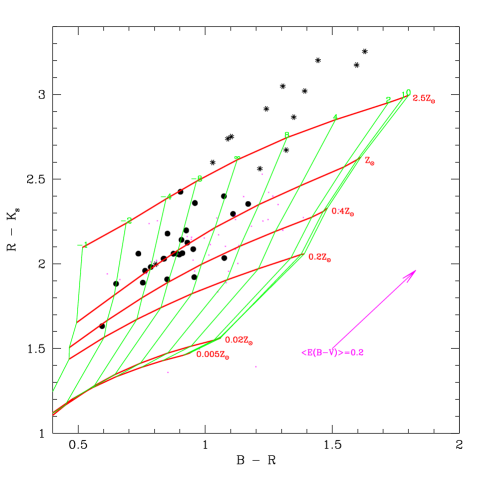
We now turn to stellar synthesis models to explore what changes in the mean age and metallicity of the stellar population would be consistent with the observed color differences between the thin disk and surrounding envelope. As in Bell & de Jong (2000), we used the combination of and colors to help separate the effects of age and metallicity. To do so, we have used Bruzual & Charlot (2001) models to calculate the colors of stellar populations for a range in metallicity and for star formation rates which are either decreasing or increasing exponentially from a starting time to the present ( for , and for , respectively), assuming a Scalo initial mass function (IMF).
In Figure 7 we plot these stellar population grids superimposed on the colors of the FGC galaxies at 1 – 4 scale heights above the plane. At , the colors are spread out over a very wide range, as shown earlier in Figure 6. The reddest points () have clearly diverged from the stellar population grids, suggesting that the colors cannot be due to any reasonable stellar population, confirming our belief that dust is strongly affecting the colors of these galaxies near their midplanes. At increasing scale heights, however, the color distribution narrows, with the bluest galaxies becoming redder, and the reddest, extincted galaxies become bluer. Note, however, that some of the intrinsically bluest galaxies are sufficiently faint in that their colors cannot be traced beyond , and thus convergence to the mean color is an artifact in some cases (see also Figure 6).
In addition to having a narrower range of colors, the stars well above the plane are consistently red. As can be seen from the overlayed grid, this color shift parallels tracks of constant metallicity and thus is likely driven largely by an increase in the typical age of the stellar population at increasing scale height. We may examine this behavior in more detail by interpolating the color profiles of individual galaxies onto the age-metallicity grid. We derive the mean stellar age and metallicity profiles for each galaxy as follows. First, we take the and color profiles shown in Figure 3. Then, because the colors can be traced to much larger scale heights than the colors, we extrapolate the color using the last reliably measured value as an estimate of the missing data. We then interpolate the colors onto a series of stellar population grids. We have allowed the starting time of the star formation to vary () to explore the sizes of the systematic uncertainties inherent in interpreting the broad-band colors444Note that for a single assumed value of , there is a maximum possible age gradient between the disk and the envelope, corresponding to an age difference of . Thus, the apparent age gradients for the models are quite small. The largest age gradients are possible if different values of apply to the disk and the surrounding red envelope (i.e. for the thin disk and for the envelope).. In Figure 9 we show the resulting profiles for the case.


Figure 9 shows several trends as a function of the typical mass of the galaxy. At very low masses (), the thin disks have young luminosity weighted ages (), and sub-solar metallicities. With increasing mass, the typical age of the thin disk increases to the point where it becomes comparable to the age of the old stellar envelope. The mean stellar metallicity of the thin disk increases with increasing mass as well. In contrast to these mass dependent trends in the properties of the thin disk, we see no significant age variations in the much older stellar envelope. In almost all cases the stellar envelope reaches mean ages of , even when the thin disk is very young. This conclusion is not highly dependent on our extrapolation of the colors; Inspection of the stellar population grids shows that the well-measured colors alone are a reasonably strong age indicator, with only a weak dependence of age on . The observed reddening in at large scale heights could have only implied a younger stellar envelope if the surrounding stars were much more metal rich, a possibility we consider unlikely.
It is more difficult to make secure claims about the luminosity weighted metallicity of the red stellar envelope, and the relative metallicity of the envelope and thin disk. The measurement of the metallicity depends sensitively on the color, but due to the low surface brightness of the envelope and the difficulty of performing near-IR surface photometry at low light levels, we are limited in our ability to constrain even the sign of the metallicity gradient in many of the galaxies. This limitation is most severe in the lower mass galaxies due to a very strong correlation between mass and infrared surface brightness within our sample; the lowest mass galaxies are nearly invisible in the near-IR (see the -band images in Paper I). Comparing the size of the typical errors to the stellar population grids in Figure 7 suggests that the interpolated metallicities are uncertain by at least 0.5 dex for the bluest galaxies. In some of the higher mass, higher surface brightness galaxies, there are reliable indications of a declining metallicity towards increasing scale height, although in the very highest mass galaxies with clear dust lanes, there may be lingering concerns about the presence of dust, even at these very large scale heights. The trends towards lower metallicity with increasing scale height are most clear in the most spatially well resolved galaxies, and can seen as a bluing of the colors towards larger scale heights in Figure 1 (see FGC 780, 1285, 913, 1415, E1440, 1945, 979, 277, 1043, & 1440 for example). We do not see any significant gradients in the spatially well resolved lower mass galaxies, because of both the lower signal-to-noise and the lower metallicity of the thin disk itself. We place little faith in metallicity gradients based upon the extrapolated values of . Inspection of the grids in Figure 7 shows that moving to redder colors at constant on the stellar population grids automatically implies lower metallicities. Only a slight increase in would be needed to erase the metallicity gradient.
Although absolute ages are difficult to characterize, vertical gradients in age and metallicity are more coherent and show notable trends. To see this, we first derive , , , and for arbitrary color. We then transform the measured color gradients to age and metallicity gradients using (and similarly for [Fe/H]).

The resulting gradient amplitudes are plotted in Figure 10 as a function of the host galaxy’s rotation speed, analagously to Figure 8. As expected, the age gradients are typically positive out to scale heights, with typical slopes of per scale height. The age gradients are steepest for the lowest mass galaxies () with the youngest star forming disks. The age gradients become more shallow with increasing scale height, as the light in the profile begins to be dominated by a presumably more uniform, older stellar envelope. We have also plotted the metallicity gradients, but given the uncertain influences on these values the lack of coherence is not surprising and specific values for individual galaxies should not be over-interpreted. Based upon both theory and Milky Way studies, we have a bias towards believing that the metallicity of the stellar envelope should be less than or equal to that of the disk555We can envision scenarios where the envelope does have higher metallicity than the disk, however. For example, if the metals created in the initial formation of the envelope are blown out, then late-time infall of unpolluted gas could lead to a metal poor disk embedded in a metal enriched halo. This scenario would be more viable in the lower mass galaxies. Indeed, the measured metallicity gradients are largely positive in the low mass galaxies, but we feel that this probably reflects the difficulty in measuring the metal-sensitive color in these very low surface brightness systems., but our infrared data is not sufficiently reliable to find this trend in all but the most massive, highest surface brightness galaxies.
5.3.1 Caveats on the Derived Age & Metallicity Gradients
We have argued that the interpretation of the color gradients is sufficiently robust to indicate a definite age gradient towards older stellar populations at larger scale heights (in low mass galaxies in particular). However, the exact amplitudes of the age gradients in Figure 9 & 10 are rather uncertain, even if their sign is not.
One of the principal limitations in deriving the age and metallicty gradients is our reliance on stellar population synthesis models to translate the observed broad-band colors into ages and metallicities. We have calculated the gradients assuming that all star formation began ago in both the envelope and the thin disk, and proceeded according to a declining or increasing exponential, with a Scalo initial mass function (IMF) between and . There is no reason for these exact assumptions to be true. First, while the old stellar envelope could have begun star formation ago, the thin disks may not have begun forming stars until much later. We have inspected profiles similar to those in Figure 9, but for younger , and find that a more recent onset of star formation in the thin disk would imply even steeper gradients in the mean age than we have derived for the same observed color gradient. Even the galaxies with apparently constant age gradients (for a single assumed value of , e.g. FGC 227, 395, 1043) might indeed have significant age differences between the thin disk and the envelope, if the appropriate value of increases with increasing scale height. Second, it is also possible that the stellar envelope is better modelled by a truncated star formation history, rather than a smoothly declining one. If the envelope formed from rapid thickening of a previously thin disk, then star formation presumably stopped when the thickening took place. Finally, there is always the possibility that star formation in unusual environments does not produce stars with a standard IMF, such that the colors of the stellar population of the envelope are significantly different than one would expect for a given age and metallicity (e.g. see observations of NGC 5907’s halo by Zepf et al. 2000).
Another potentially significant uncertainty in the derived age gradients is that we have neglected the effects of dust. While we are not currently making a detailed accounting of the contribution of dust to the measured age gradient, we can instead argue that if significant amounts of dust are present, they are distributed in such a way that the true age gradient is probably even steeper than we have derived. Any reddening due to dust would likely be largest in the plane, such that the true midplane colors would be even bluer than we measured (see §8.1 below for a fuller discussion of dust distributions). This would increase the color difference between the midplane and surrounding envelope, increasing the age difference. Thus, if the galaxies were reddened by significant amounts of dust, then the true age gradients would be even steeper than derived above. Although significant amounts of dust could lead us to underestimate the age gradient in our galaxies, the color maps suggest that dust plays little role in all but the most massive galaxies in our sample (§3.3). Thus, we do not believe that dust is a major uncertainty in the derived age gradients of the lower mass galaxies. Detailed modelling by Matthews & Wood (2001) of an edge-on system similar to those in our sample (UGC 7321, ) confirms that the overall reddening due to dust is small, and, moreover, that any residual dust only weakens the measured color gradients, suggesting a small revision towards a steeper derived age gradient.
Even if the dust component is significant in an individual galaxy, its distribution can drastically affect the exact degree of reddening (Disney et al. 1989, Bianchi et al. 2000, Misiriotis & Bianchi 2002). In some geometries, large amounts of dust may in fact have little effect on measured color gradients or the inferred mean ages and metallicities. Dust that is distributed in optically thick clumps would not actually change the colors of the galaxies. Only if the clumps were optically thin in at least one of the filters would the colors change, and then only in color combinations involving the optically thin filter. Given the wavelength sensitivity of dust extinction to wavelength, color combinations involving only optical wavelengths might in fact be less reddened than optical-infrared colors (i.e. there might be more reddening in than in , surprisingly, if the dust clumps were optically thick in both and , but not ). Indeed, inspection of Figure 2 shows that bringing the colors of galaxies with dustlanes (marked with asterii) into alignment with the face-on de Jong (1996) disks would require a much larger change in than in . If this is true in general for our sample, then is strongly reddened, and the inferred metallicities are too high, while the colors and derived age are little affected. This is additional evidence that the inferred age gradients are unlikely to be strongly affected by dust.
6 Shapes of the Outer Isophotes
In the previous sections we have outlined evidence for an old stellar envelope surrounding the disks in our sample. In addition to the above analysis of the stellar population of the envelope, we can measure the structure of the envelope by tracing the faintest isophotes of the galaxies’ surface brightness distributions. At these faint levels, the color maps suggest that the red envelope dominates the light, and thus the shape of the isophote constrains the shape of the stellar envelope.
We quantify the shape of the envelope by fitting ellipses to the -band isophotes plotted in Paper I (and partially reproduced in Figure 1). We fit the isophotes using ellipses with major and minor axes and and orientation . We have also included a term of amplitude in the isophote shape to allow for “boxiness” and “diskiness” in the isophotes. Our definition of differs somewhat from what is frequently used for elliptical galaxies. First, we are fitting changes in the shape of the isophote, not changes of intensity along a purely elliptical track. Second, we generate the perturbed ellipse by first generating a circle with and then compressing it along the minor axis by a factor of . This moves the “nodes” of the boxiness or diskiness away from such that the term produces pertubations more appropriate to our extremely flattened distributions.
Figure 11 shows the shape parameter for inner and outer isophotes of the galaxies in the sample. The brighter isophotes are dominated by the thin disk and indeed they show that the galaxies are almost uniformly disky in their brighter inner regions. However, the fainter outer isophotes dominated by the stellar envelope are as likely to be boxy as disky. This suggests that the radial extent of the stellar envelope is somewhat decoupled from the disk. When the characteristic radial scale length of the envelope is longer (shorter) than that of the disk, it leads to boxy (disky) outer isophotes. It may also be that the stellar envelope is prolate, and the variation in boxiness/diskiness reflects differences in viewing angle.

In addition to the difference in scale length between the envelope and the embedded disk, we also see a significant change in axial ratio. In Figure 12 we plot the axial ratios of our isophote fits as a function of the surface brightness of the isophote. The outer isophotes are clearly systematically rounder than those tracing the inner disk, as can also been seen directly in the faint band isophotes superimposed on the color maps plotted in Figure 1. Note that the galaxies in our sample were originally selected to have very thin axial ratios, with . Indeed, at the depth of the Palomar Sky Survey plates, the galaxies all share a needle-like appearance. However, at the faint isophotes detectable in our deep, well-flattened images, the galaxies are typically much rounder, with axial ratios closer to ; at , the mean axial ratio is .
Before the analysis in this paper, the reason for the thickening of the disk at faint isophotes had been unclear, with possibilities being radial truncation of the thin stellar disk (e.g. de Grijs et al. 2001, Barteldrees & Dettmar 1994, Pohlen et al. 2000, Kregel et al. 2002), or a simple manifestation of steady vertical heating (i.e. the age-velocity dispersion relation found in Milky Way disk stars; Weilen 1977). However, as our data indicate, the transition between the color of the thin disk and the surrounding red envelope is abrupt (at least in the lower mass galaxies), suggesting that it does not arise from a smooth change in the stellar population (as would have resulted from any vertical heating not caused by a sudden merging event). Instead, the galaxies with the deepest, most well-resolved images show that the rounder outer isophotes trace a distinctly different stellar population and not a continuation of the thinner disk.
7 Stellar Envelopes in Massive Galaxies?

In contrast to in the lower mass galaxies (), the distinction between envelope and thin disk stellar populations is less obvious in the more massive galaxies. While the outer isophotes of the massive galaxies are as round as in the lower mass systems666The axial ratio of the outer isophotes is completely uncorrelated with rotation speed, with a Spearman correlation coefficient of 0.2 at and 0.01 at . they do not have particularly strong color gradients outside of the central dust lane. However, there are a number of reasons why we might not expect to easily detect a distinct low surface brightness envelope in these systems, even if one exists. First, the thin disks of the massive galaxies are higher surface brightness overall than the lower mass galaxies. This makes the thin disk surface brightness more prominent at a given number of scale heights above the plane, and can more easily mask a secondary population if one exists. Second, the thin disks of the massive galaxies are redder, and thus there is no obvious color change to mark the transition between the disk and the envelope. Third, if the stars in the massive, high surface brightness disks are also old (as would be consistent with their observed red colors and with previous studies of face-on galaxies, e.g. Bell & de Jong 2000), then steady vertical heating of the disk has had more time to create a thicker disk, pushing stars from the thin disk to proportionally larger heights where they could more easily mask a faint stellar population.
In summary, while Figure 1 does not show obvious red stellar envelopes in the most massive galaxies, it likewise does not provide strong evidence against them. For now, we will defer to Occam’s Razor: it would be somewhat contrived to assume that the envelope population ceases to exist exactly where it would become most difficult to detect, and so we make the simpler assumption that the stellar envelope is likely to be a feature of all disk-dominated galaxies, though a far less obvious one around more massive, older disks. Certainly the existence of the thick disk of the Milky Way supports this supposition.
8 Interpretion of the Red Stellar Envelope
In the above sections we have outlined several lines of evidence that lead us to believe that we are detecting a relatively old, red stellar envelope surrounding the disks in our sample. We briefly summarize the evidence as follows:
-
•
Color maps of the galaxies (Figure 1) show clearly that the thin stellar disk is surrounded by a red envelope, particularly in the lower mass galaxies where the the thin disk is sufficiently blue to provide a strong color contrast. In these disks the transition between the disk and the envelope is abrupt, and the difference in shape between the thin disk and the much rounder red population is readily apparent.
-
•
Comparing the optical and infrared colors of the disks to the surrounding envelopes suggests that the redness of the stellar envelope is due primarily to age. The age differences between the bluest disks and their surrounding envelopes seem to be at least , which would suggest that the envelope was in place by at least for flat, low- models with , assuming an (unrealistic) age of zero for the thin disk. If we instead adopt the absolute ages of 6-8 derived in Figure 9, then the envelope was in place at redshifts of 0.9-1.5. Uncertainties in the infrared color, the dust content, and the stellar synthesis models are all such that the likely formation epoch of the red envelope is even earlier.
We have also identified two main limitations to this work:
-
•
The uncertainty in the measured colors limits our ability to judge the relative metallicity of the disk and the envelope.
-
•
In massive galaxies, the high surface brightness, red color, and greater thickness of the thin disk prohibits us from either confirming or ruling out the presence of the stellar envelope.
8.1 What the Stellar Envelopes are Not
The question now arises as to what processes have lead to the creation of this relatively old and somewhat flattened stellar distribution surrounding the thin disk. Before we discuss the likely orgins for this red stellar envelope, we briefly consider several alternative explanations for the observed color maps (in order of increasingly likelihood) and explain why we consider them unlikely.
High Latitude Dust: One possible explanation for the redder colors at large scale heights is an increasing dust content above the plane of the galaxy. This explanation would require there to be more reddening above the plane of the thin disk than within it. We find this solution to be intractable for a number of reasons. First, the strongest colour gradients are in the lowest mass systems, which should have the lowest metallicities (e.g. Stasinska & Sodré 2001, Zaritsky et al. 1994), and thus the least raw material for forming dust. Second, only small amounts of extraplanar dust have been identified in a few nearby edge-on galaxies (e.g. Howk & Savage 1999), and the amounts have been dwarfed by the dust content closer to the plane. Moreover, few of the galaxies studied have this extra component of dust, and those that do also have extraplanar ionized gas and high star-formation rates as measured by their IRAS far-infrared (FIR) luminosities. Only three galaxies in our sample were detected in the FIR, suggesting that the majority of our sample is unlikely to have the extraplanar dust component. Finally, detailed modelling by Matthews & Wood (2001) of the multi-color morphology of UGC 7321 suggests that the dust in this galaxy (which is a thin bulgeless disk like the galaxies in our sample) is sufficiently concentrated towards the plane that it reddens the midplane slightly without changing the color of the disk at high latitudes.
Warping and/or Current Accretion: It is possible that some of the high-latitude stars are due to transient phenomena such as warps in the thin stellar disk or on-going accretion of very low surface brightness material (such as the ring in NGC 5907; Xheng et al. 1999). However, there are a number of arguments against such processes being widespread in this sample. First, the existence of the very tight relationship between a galaxy’s rotation speed and the amplitude of its color gradient (Figure 8) argues strongly against a stochastic and/or transient origin for the gradient. Instead, the gradient must arise through a physical process which is tightly coupled to a galaxy’s mass, and whose after effects are long-lived. Second, the gradients in this paper have been measured within one disk scale length of the center, where the effects of warping are smaller than they would be on the outskirts. Third, while we do see some warping at large radii in a few galaxies, the warps are quite small; only two galaxies have faint isophotes which are fit by ellipses tilted by more than from their inner regions, and none are tilted by more than . Finally, Figure 5 shows that the color gradients are typically quite symmetrical, which would not necessarily be expected if warps or accreting satellites were responsible for the gradients.
Vertical Heating of a Thin Disk: Among the more plausible scenarios for creating the high-latitude red stellar population are the many mechanisms capable of steadily increasing the vertical velocity dispersion (and thus the scale height) of stars within a thin disk. Possible mechanisms include scattering off of giant molecular clouds (Spitzer & Schwarzschild 1951, 1953, Lacey 1984) and spiral density waves (Carlberg & Sellwood 1985). In these models stars are born with the velocity dispersion of the thin gaseous disk, and then steadily “heat” vertically, gradually gaining velocity dispersion and travelling to larger distances above and below the galactic plane. Eventually these heating processes saturate, as the stars spend the majority of their time outside of the thin disk, in regions where the heating is least effective. These mechanisms nicely explain the age vs. velocity dispersion relation seen for disk stars in the Milky Way (e.g. Wielen 1977, Quillen & Garnett 2000, Gómez et al. 1997, Haywood et al. 1997); the most recent determinations find that the vertical velocity dispersion of Milky Way stars rises steadily with stellar age, but saturates at around for stars more than . The combination of continuous star-formation and vertical heating has also been used to explain the non-isothermal surface brightness distribution seen in other edge-on disks (e.g. Dove & Thronson 1993).
If the vertical heating seen in the Milky Way exists in all disks, then it would produce a color gradient which has the same sense as we observe in our sample: the older, redder stellar populations would have larger scale heights than the younger, bluer ones (ignoring metallicity effects for the moment). However, while this process may be operating to some degree within our sample, it is difficult to invoke it as the sole origin of the red envelopes, particularly for the lowest mass disks in our sample, which have the strongest color gradients and red envelopes which are 3-7 times thicker than the blue thin disks at the outermost isophotes in Figure 1 (see for example FGC 780). There are several difficulties with producing these envelopes via vertical heating. First, creating such large thicknesses through steady disk heating is nearly impossible, due to the saturation of most heating processes. Second, while the data requires that the vertical heating be strongest in the lowest mass galaxies, all of the processes that are thought to be responsible for vertical heating are probably weakest in the low mass disks. These disks all have very low surface densities (, based upon the deprojected band surface brightnesses, assuming ) and their face-on counterparts show neither spiral structure nor copious amounts of molecular gas (if any). Thus, they are unlikely to support the large gravitational pertubations necessary for scattering stars out of the plane. Moreover, even when vertical heating is known to have been efficient, such as in the disk of the Milky Way, the expected amplitude of the resulting color gradient is relatively small. Calculations by de Grijs & Peletier (2000) show that the expected color gradient should be less than 0.03 mag per scale height, when the dependencies of metallicity and age with velocity dispersion are included.
In addition to the above more theoretical arguments, there is more empirical evidence that vertical heating alone is not responsible for the stellar envelopes. In particular, §6 and Figure 11 suggest that the radial scale length of the envelope is not tightly correlated with the radial scale length of the disk, as we would expect for heating scenarios. Instead, the faint isophotes which trace the red envelope are equally likely to be boxy as they are disky, with no dependence on the properties of the galaxy. Furthermore, although the thin disks have a very wide range of color (indicating a spread in mean age, stellar metallicity, and dust), surface density, gas content, and rotation speed, the properties of the stellar envelopes are quite similar from galaxy to galaxy; the colors of the surrounding envelopes span a much more limited range than their host disks, and their axial ratios are similar, varying by 16% at faint isophotes (). The strength of most processes thought to drive vertical heating of stars should vary tremendously within our sample, and thus it would be very surprising for all the disks in our sample to create similar envelopes through heating alone.
An Analog of the Stellar Halo of the Milky Way: Another plausible explanation for the old red stellar envelope is that it is an analogue of the old metal poor stellar halo of the Milky Way. However, we find three strong reasons why the stellar envelopes we have detected are significantly different than the MW stellar halo. Namely, as we discuss below, our stellar envelope population is too red, too flat, and too bright to be an immediate analogue of the MW stellar halo.
The first point of conflict is that, unlike the observed stellar envelopes, the stars and globular clusters which are kinematically identified as part the MW halo are generally very metal poor ([Fe/H]-1.7, e.g. Chiba & Beers 2000; see review by van den Bergh 1996 for full references). For the ages we infer for the stars in the stellar envelope, this metallicity would imply a typical color bluer than 1.7, much bluer than we observe for the red envelopes in our sample. To show this, in Figure 13 we have plotted both the colors of the red envelopes and an approximate color for the MW halo. We have generated the halo color by assuming a old population with a range of metallicities that brackets 50% of MW halo stars ([Fe/H]; Carney et al. 1994). Although the bluer color of the MW halo is compatible at the level with the color of any individual envelope (due to the limitations of accurate sky subtraction in the infrared), it is an entire magnitude bluer than the median high latitude color we observe (see Figure 6). Barring a gross systematic error in our analysis, it is highly unlikely that the typical stellar envelope observed in our sample has a metallicity nearly as low as that of the MW stellar halo.
The second discrepancy is in the shape of the stellar envelope. Although kinematic and star count analyses suggest that the MW stellar halo is flattened, it seems to be flattened by never more than a factor of two, even in the inner halo (see Chen et al 2001, Chiba & Beers 2000, Yanny et al 2000, Layden 1995, Larsen & Humphreys 1994, Kinman et al 1994 for recent determinations using a variety of methods). In contrast, the isophotes tracing the stellar envelopes in our sample seem to have converged to an axial ratio which is twice as flat as the inner MW halo (; Figure 12), with no galaxy showing an axial ratio flatter than 3:1. If anything, we would expect that any halo analogs in our sample should be rounder than in the MW. The flattening of the MW’s inner halo is probably due to gravitational compression by the thin massive disk (e.g. Bekki & Chiba 2001, Flores 1980). However, the galaxies in our sample have disks that are much less massive and lower surface density than the MW and as a result should be even less efficient at flattening their stellar halos than the MW. Thus, it is very unlikely that the flatter stellar envelopes we see in our sample are more extreme versions of the MW’s halo.
The third major difference between the MW stellar halo and the stellar envelopes is in their relative surface brightness. While the stellar envelopes we have detected are extremely faint, they are still much brighter than we would expect based on the relative density of the MW halo and disk. Most studies of the Galaxy’s stellar halo suggest that its density at the solar circle represents only a tiny fraction of the total density (%; see compilation in Chen et al. 2001). Assuming for the moment that the MW halo and disk have comparable mass-to-light ratios, the relative surface brightness of the two components at should be at the midplane. The galaxies in our sample have maximum surface brightnesses of , implying a peak surface brightness for the halo component of nearly in , and an even fainter surface brightness above the plane. More realistically, the likely surface brightness difference between the disk and halo is even larger, given the low mass-to-light ratio of the young disk compared to the higher mass-to-light ratio of the older envelope. The situation might not be quite as bleak in the center of the galaxy along the minor axis, where the steeper density profile of the MW halo (roughly ) relative to the disk () leads the halo to become proportionally more important. However in detailed models of the MW, Morrison et al (1997) find that, even in the center, the light from the halo only just becomes comparable to the light in the thick disk at the very limits of detectability (). In short, we do not expect true analogs of the MW stellar halo to be detectable in our sample galaxies, unless through direct analysis of resolved stellar populations (e.g. M31; Sarajedini & van Duyne 2001, Holland et al. 1996).
8.2 The Red Stellar Envelopes: Universal Thick Disks
Having eliminated the above scenarios, we are left with one viable explanation for the stellar envelope. Namely, we believe that the envelopes which we have detected are likely to be analogs of the Milky Way’s old thick disk (for detailed properties of the thick disk, see recent reviews by Wyse 2000, Norris 1999, van den Bergh 1996, Majewski 1993). The observed colors of the envelopes are consistent with their being relatively old and somewhat metal-poor, like the Milky Way thick disk, and their geometry suggests a similar axial ratio as well.
8.2.1 Comparison with the Milky Way Thick Disk
In detail, the typical metallicity of the Milky Way thick disk is somewhat metal poor, with a mean [Fe/H] (Gilmore & Wyse 1985, Carney et al. 1989, Gilmore et al. 1995, Layden 1995, Robin et al. 1996). It is also thought to be relatively old, with a typical age comparable to the metal rich globular clusters (; Gilmore et al. 1995). Based on the old stellar grids in Figure 7, the likely age and metallicity of the MW thick disk would correspond to a typical color of and or redder. Figure 13 shows the locus of and colors of a old population with the range of metallicities observed for the MW thick disk stars ([Fe/H]), along with error bars representing the range of colors spanned by our sample at high latitudes. The fiducial color of the MW thick disk is slightly bluer than the envelope colors observed in our sample at high latitude (by a few tenths of a magnitude at most), and slightly redder in (again by a few tenths). Given the systematic uncertainties in the IR colors of stellar population models (i.e. Charlot et al. 1996) and in the low mass end of the IMF, the IR color difference is probably not significant, and thus we consider the optical and IR colors of the red stellar envelopes to be consistent with the likely color of the MW thick disk. However, the more accurately measured colors may suggest a slightly younger mean age for the stellar envelopes in our sample than for the MW thick disk, as would be consistent with the overall younger age of the thin disks in the majority of our sample.
In addition to the color similarities, the red stellar envelopes have roughly the same geometry as the MW thick disk. Recent studies using star counts and proper motions along many different sightlines within our galaxy (most recently Chen et al. 2001 (SDSS), Ojha 2001 (2MASS), Buser et al. 1999, Robin et al. 1996) suggest that the MW thick disk population has a scale height , roughly 2-4 times thicker than the old thin disk. Recent determinations of its radial scale length are in the range (Robin et al. 1996) to (Ng et al. 1997), giving an overall axial ratio for the MW thick disk in the range of 3:1 - 7:1. These axial ratio values agree well with the range of observed axial ratios traced by the red envelope (Figure 12), as do the apparent relative thickness of the thin blue disk and the thicker envelope.
Finally, the red envelope and the embedded thin disk in our sample appear to have a relative brightness comparable to the thick and thin disks of the MW. Measurements within the MW suggest a normalization of the density of the thick disk between 4% and 13% of the thin disk at the solar circle midplane. (These normalizations are highly anticorrelated with the derived thick disk scale height, with puffier disks having lower local density; see error ellipses in Chen et al. 2001). Although detailed fitting of the thin disk and envelope components will be deferred to a later paper, the surface brightness level of the isophotes where the red population begins to dominate is bright enough () that the surface brightness of the envelope cannot be less than a few percent of the thin disk’s. Nor can the surface brightness be greater than 50%, as the light from the younger thin disk clearly dominates at the midplane. This puts the likely relative brightness of the thin and thick disks in the range measured within the MW.

8.2.2 Comparisons with Previous Detections of Thick Disks in Other Galaxies
In addition to the broad similarities between the red envelopes discussed in this paper and the MW thick disk, there are close connections between the thick disks reported in other external galaxies and those we have detected in our sample. This link is not surprising, as reports of thick disks in other galaxies are also based upon their similarity to the MW thick disk. Since the first detections of thick disks in external galaxies (Burstein 1979, Tsikoudi 1979, van der Kruit & Searle 1981) several studies have attempted to identify thick disks in nearby galaxies. Many of the most recent galaxy decompositions of single band CCD images of edge-on galaxies (e.g. Neeser et al. 2002, Abe et al. 1999, Rauscher et al 1998, Morrison et al 1997, Näslund & Jörsatër 1997, Morrison et al. 1994, Shaw & Gilmore 1990) find thick disks with scale heights that are several times the height of the thin disk, and central surface brightness normalizations of 5-15% of the thin disk. These results are fully compatible with the red envelopes detected in our sample. Likewise, HST observations of resolved stars in the outer disk of M31 tentatively suggest a detection of an old, slightly metal poor ([Fe/H]-0.2) thick disk (Sarajedini & van Duyne 2001), which is again in good agreement with the mean stellar population properties estimated for our sample.
Even more striking is the agreement between our data and the few cases where light has been traced to high latitudes in more than one bandpass, allowing reliable detections of color gradients to large scale heights. Such detections are presented by Matthews et al. (1999) although they do not specifically identify the color changes with a thick disk; van Dokkum et al (1994) where they analyze NGC 6504, a massive Sab galaxy, and find no significant color gradient in agreement with our results for massive disks; Lequeux et al (1998) for NGC 5907, although Zheng et al (1999) attribute part of the high latitude light to a remnant ring from a disrupted satellite; Wainscoat et al. (1989); and Jensen & Thuan (1982) where the Sb galaxy NGC 4565 is traced to very faint levels and shows a clear color change associated with the onset of a flattened “corona”. In all these cases the color of the high latitude populations agrees remarkably well with the typical high latitude colors of the galaxies in our sample, generally reflecting an old, but not particularly metal poor, stellar population.
Clearly, our results differ from claims of thick disk non-detections in several respects. In particular, a recent summary of the literature by Morrison (1999) argues that extended thick disks have only been detected in galaxies with medium sized or larger bulges, suggesting an evolutionary link between the two components. In contrast, we find clear evidence for a thick, red stellar component in the majority of our sample of bulgeless galaxies. Abe et al. (1999), and more recently Neeser et al. (2002), also show counterexamples to the Morrison (1999) claim, but through surface brightness profile fitting. The strongest claims of non-detections in deep imaging of late-type galaxies (e.g. Fry et al 1999 analysis of NGC 4244, and Morrison et al 1994 analysis of NGC 5907) are based upon 2-dimensional image decomposition of a single -band image, and it is likely that without the structural contrast provided by a bulge it is far more difficult to cleanly decompose a thin disk, thick disk, and halo population. Indeed, many of the galaxies in Figure 3 show no strong inflection points in their surface brightness profiles, in spite of having strong color gradients. Moreover, in the late-type galaxy NGC 5907 there is a detection of high-latitude light, though at a lower relative brightness that would be expected for a strict analog of the MW thick disk, which lead the authors to attribute this light to a stellar halo instead. Morrison (1999) reports that on the basis of deep band imaging, this extra component would be compatible with a MW-like thick disk if the radial scale length were longer than the thin disk, as we see in many of our sample galaxies with boxy outer isophotes, and a lower overall surface brightness777We note, however, a thick disk attribution for the high-latitude light in NGC 5907 may not be compatible with the very low metallicity implied by the lack of detected giant stars in deep HST NICMOS imaging (Zepf et al. 2000). In a future paper we will attempt to characterize the range of normalizations and radial scale lengths which are compatible with our data, and better characterize the fraction of a galaxy’s light which typically makes up the thick disk.
We also note that, in many ways, detection of thick disks should be easier in our sample than in previous studies. All earlier investigations have been of the very nearest, well-studied edge-on galaxies, maximizing spatial resolution while making the observations feasible on small Schmidt telescopes. However, because of their extremely large angular extent, accurate flat fielding over the physical scales required to detect the thick disk is more difficult and foreground star subtraction is far more critical. In contrast, our sample has a larger mean distance than previously studied galaxies (by a factor of 2-5), leading to a small sacrifice in spatial resolution, compensated by a tremendous gain in the area unaffected by foreground stars. In the majority of our sample, the spatial resolution is more than sufficient for detecting thick disks, without the complication of PSF subtraction.
9 Implications for Thick Disk Formation
Assuming now that the red stellar envelopes are indeed analogs of the MW thick disk, we can draw a number of conclusions about the general properties of this apparently ubiquitous component.
-
•
Thick disks are common around galaxy disks of all masses. Previously, firm detections of thick disks were confined to the Milky Way and other relatively massive, bulge-dominated galaxies (). This work extends the mass range of galaxies with detected thick disks down to very low masses (). Moreover, there is no reason to believe that the thick disk population is not present in even lower mass galaxies. Many observations of the color magnitude diagrams (CMDs) of lower mass “transitional” dwarf spheroidals and dwarf irregulars show that the younger stars of the galaxies are embedded within an old, quiescent stellar component which extends to much larger radii (e.g., Antlia (Aparicio et al 1997, Sarajedini et al. 1997); Phoenix (Held et al. 2001, 1999, Martínez-Delgado et al. 1999); SagDIG (Held et al. 2001); DDO 187 (Aparicio et al. 2000); WLM (Minniti & Zijlstra 1996); Harbeck et al. 2001). Recently, Held et al. (2001) have argued that this old component around dwarf spheroidals is in fact flattened. It therefore is possible that these are face-on detections of stellar envelopes similar to those we have detected here in edge-on, higher mass galaxies. The apparent universality of thick disks suggests that the process that leads to formation of the thick disk must be a generic feature of disk galaxy formation.
-
•
Thick disks are not a by-product of bulge formation. Previously, it was thought that the formation of the thick disk might be closely tied to the formation of the bulge, due to the facts that (i) thick disks were detected almost exclusively around galaxies with medium to large bulges (Morrison 1999) and that (ii) there is remarkable similarity in abundance patterns between thick disk and low metallicity stars in the bulge (Prochaska et al. 2001). In contrast, our sample contains only bulgeless galaxies. Thus, the dynamical processes which lead to the formation of a thick disk do not necessarily lead to the formation of a bulge, although they might in some cases. Alternatively, the epoch of thick disk formation might be very similar to the epoch of bulge formation within an individual galaxy, such that they both form from the same gas resevoir, leading to similar enrichment patterns. However, the dynamical processes responsible for each component might quite distinct, as might be expected given their drastically different angular momenta (Wyse & Gilmore 1992).
-
•
Thick disk formation takes place early, even for galaxies with a very young mean stellar age. Within our sample, the stellar populations of the thick disks are much more similar from galaxy to galaxy than are the stellar populations of the embedded thin disks. The thin disks span a very wide range in color, driven primarily by differences in mean stellar age. However, the thick disks have colors compatible with being relatively old (at least , if not older), even if the mean stellar age of the thin disk is young. This suggests that thick disk formation is a very early process even in galaxies which will take many gigayears to either accrete most of their gas and/or convert that gas into stars888We note that we could potentially have a small bias against very young thick disks in our sample, because we purposely excluded galaxies which had obvious signs of on-going interactions. If thick disks are formed in mergers, we may have biased ourselves against the most recently formed endpoints of this process. The same bias could have been applied to the the Flat Galaxy Catalog from which our sample was extracted. However, the number of galaxies which we excluded due to warping was actually quite small (fewer than 5 out of candidate lists of nearly 200 galaxies), and moreover we do have many galaxies in the sample which show evidence for small past disturbances (i.e. slight warping and asymmetries) at faint surface brightnesses (see Paper I). We therefore consider it unlikely that we are missing a large population of much younger thick disks..
-
•
The formation of the thick and thin disks are largely decoupled. As seen in our sample, the thick and thin disks have different ages and radial scale lengths within the same galaxy. Similar differences are seen between the thin and thick disks of the Milky Way, in addition to significant metallicity and relative abundance differences (Prochaska et al. 2001, Gratton et al. 2000, Furhmann 1998). This evidence suggests that, as has been suggested for the Milky Way (Gilmore & Wyse 1985, Wyse & Gilmore 1986, although see review by Norris 1999), the formation of the two components occured through two distinct processes.
The above conclusions can be compared with possible formation mechanisms for the thick disk. Almost all proposed models break into two major classes. In the first, the thick disk is very old and grew monolithically during the initial dissipational collapse of the galaxy (e.g. Sandage & Fouts 1987, Wyse & Gilmore 1988, Burkert et al. 1992). In the second, the thick disk is the by-product of a significant merging event, through either (1) a single episode of energetic vertical heating of an existing thinner disk via accretion of a massive satellite galaxy (Quinn & Goodman 1986), or (2) through direct accretion of thick disk material from a cannibalized galaxy (Statler 1989). Because the similar chemical enrichment patterns among stars in the inner halo, metal-poor bulge, and thick disk of the MW argue against the Statler (1989) direct accretion model for producing thick disks, we will concentrate hereafter on the vertical heating mechanism when considering the merger scenario.
On initial examination, the data do not rule out either monolithic collapse or merger origins for the thick disk. The ubiquity and old age of the detected thick disks initially argues in favor of a monolithic formation scenario, as the more stochastic, on-going process of merging seems less likely to produce such a pervasive thick disk population as we observe. However, upon deeper consideration, a merger origin for the thick disk is equally well supported by our data, and is additionally bolstered by other evidence. First, if galaxies assemble hierarchically, as expected in most favored cosmogonies, then merging should be a generic feature of the evolution of galaxies, and there would be many opportunities for a young disk to be heated by a significant merging event, generating a thick disk. In such a scenario, thick disks should be pervasive, as we find in our sample. Second, the merging rate tends to decline with time, suggesting that if merging produces thick disks, then these thick disks should be old, as we also find. Third, the lack of any strong correlation between the sizes of the thick and thin disks suggests a rather stochastic origin for the thick disk. Collapse models tend to lead to similar scale lengths for the thick and thin disks (Ferrini et al. 1994), and thus the apparent lack of correlation is more compatible with a merging scenario, where the exact timing of the last merging event would set the relative masses and sizes of the older thick disk and the thin disk which subsequently accreted.
The merger scenario for thick disk formation is additionally supported by mounting evidence from the Milky Way. A substantial (%) merging event is strongly suggested by the sharp factor of 2 increase in velocity dispersion ago (Quillen & Garnett 2000), by the apparent floor in the metallicity of thick disk stars (Chiba & Beers 2000) suggesting substantial pre-enrichment, by the lack of a vertical metallicity gradient in the MW thick disk (Gilmore et al. 1995, Chiba & Beers 2000), and by numerical simulations (recently, Bekki & Chiba 2001). However, this epoch of merging must have been extremely early, as argued recently by Wyse (2000). Detailed studies of stars and clusters in the Milky Way suggest that the youngest stars in the MW thick disk are at least as old as the thick disk globular cluster 47 Tuc (i.e. ; Carretta et al. 2000, Lui & Chaboyer 2000, Gilmore et al. 1995), and that star formation began in the thick disk concurrently with the old inner halo (Chaboyer et al. 1999).
If merging is the origin of the thick disks seen in our sample as well as in the Milky Way, then our data also confirms that the merging epoch had to be early. Based upon the optical-IR colors of the thick disks in our sample, we estimate a minimum formation age of ago, with the true age likely to be even older. In addition, the merging epoch must have peaked sufficiently early in the galaxies’ mass accretion history to have left sufficient time for the majority of the baryonic material to settle into a thin disk.
In spite of the above, the somewhat smaller possibility remains that the thick disks did form during a monolithic collapse. Our bias towards the merger scenario is based in part upon observations within the Milky Way, some of which are uncertain (see Norris 1999 for a discussion). Secure observations of a vertical metallicity and/or kinematic gradient within the thick disk would favor more “ELS” flavored models for the dissipational formation of the thick disk. Kinematic observations of the galaxies in our sample could also provide discriminating constraints between the merging and collapse formation models.
10 Conclusions
In this paper we have presented several lines of evidence which lead us to conclude that thick disks are a common product of disk galaxy formation for galaxies of all masses. Specifically, we have analyzed the color maps, vertical color gradients, and faint isophote shapes for a large sample of edge-on bulgeless disks. Our observations are consistent with the conclusion that that all galaxies in the sample are embedded within somewhat flattened (4:1) red stellar envelopes whose properties vary little from galaxy to galaxy although the galaxies themselves span an enormous range in mass and color. We have used stellar synthesis models to argue that the stellar envelopes are old (at least , and probably older), but not necessarily metal poor ([Fe/H]-1). We argue that the properties of the red stellar envelopes are consistent with their being close analogs of the MW thick disk.
We find that the evidence in hand, from our sample and the Milky Way, is consistent with a picture for disk galaxy formation which procedes as follows: (1) a thin stellar disk forms at high redshift (); (2) partial disruption occurs during a significant merger capable of dramatically heating the thin disk, but not necessarily leading to the formation of a bulge; (3) the majority of the galaxy’s stars form from gas gradually accreted after the merger and the creation of the thick disk; and (4) no significant merger events follow. This model will only be consistent with cosmological scenarios where the merging rate peaks early on (i.e. low models).
The evidence suggests that this basic sequence of events is a generic feature of the history of the majority of galaxies which appear as thin disks today. If so, then it places a number of strong constraints on galaxy formation models:
-
•
Many successful analytic models of disk formation treat the formation of the disk as a monolithic collapse (i.e. Fall & Efstathiou 1980, Dalcanton et al. 1997, van den Bosch 1998, 2002). These models tend to produce realistic disks, even though their entire theoretical basis seems to be in conflict with a hierarchical model for the assembly of galaxies. However, our data suggests that, for galaxies which are disk dominated today, major hierarchical mass accretion probably ends early and involves only a small fraction of the galaxies’ mass. This suggests that it is probably legitimate to treat the formation of the disk as a monolithic dissipative collapse.
-
•
The observation that significant mergers are unlikely to have occured in the last for very late-type disk galaxies can place strong constraints on the input parameters for semi-analytic models of galaxy formation, particularly once the mass-accretion threshold for thick disk formation is better constrained by realistic merging simulations of primordial thin disks. Cosmological models which have merging rates that increase to the present day would be less favored by these observations.
-
•
In most semi-analytic models of galaxy formation, it is assumed that bulges form through merging of two galaxies with comparable masses, and that any disk is accreted subsequent to the merger. However, the observations of pervasive thick disks suggest that some of the significant mergers early in a galaxy’s history lead to the formation of a thick disk, and do not neccessarily produce a bulge (although they might, possibly depending on the gas mass fraction of the merging progenitors). Thus, it may be necessary to revise the criteria for how bulges are produced in semi-analytic models.
-
•
If merging leads to the formation of both a thick disk and a bulge (e.g. Kauffmann et al. 1993), then the age constraints on thick disks place indirect age limits on bulges that form via mergers. Our data therefore suggests that bulges must form early, lest the epoch of merging also create thick disks that are younger than is observed. However, bulge formation which takes place via secular processes such as bar instabilities (e.g. Pfenniger 1993) is still permitted at any epoch.
-
•
Assuming that the thick disks in our sample are produced by merging, and that they persist down to the mass scale of transitional dwarf spheroidals as we have argued above, then there must have been merging sub-units on even smaller mass scales. This decreasing mass scale sets an upper limit on a possible smoothing scale for the primordial power spectrum, and limits the masses of possible Warm Dark Matter candidates.
-
•
Because the thick disk stars are older than those in the thin disk, the thick disk isolates baryonic material from an earlier epoch. Thus, it may be possible to use the relative dynamics and radial distributions of the thick and thin disks to constrain how the specific angular momentum distribution changes as a function of time. This could potentially resolve subtle discrepancies between the angular momentum distribution of thin disks and theoretical models (van den Bosch 2001).
-
•
The apparent universality of thick disks down to very low mass scales suggests that it may be difficult to measure truly “primordial” Helium abundances for constraining Big Bang nucleosynthesis. The existence of the red envelope suggests that even the lowest mass (40-60) galaxies with the youngest, bluest star forming disks experienced an even earlier generation of star formation. This early star formation would be likely to pollute the gas which is currently in the disk, and thus any metallicity measurements made from HII regions would have been enriched not just by the current generation of stars, but a previous one as well.
JJD gratefully acknowledges discussions with Constance Rockosi, Beth Willman, Vandana Desai, Andrew West, Suzanne Hawley, Craig Hogan, and Christopher Stubbs on various aspects of this project. She also thanks Hazel Borden for frequent naps.
JJD was partially supported through NSF grant AST-990862 and the Alfred P. Sloan Foundation. Support for RAB was provided by NASA through Hubble Fellowship grant HF-01088.01-97A awarded by Space Telescope Science Institute.
REFERENCES
Abe, F., Bond, I. A., Carter, B. S., Dodd, R. J., Fujimoto, M., Hearnshaw, J. B., Honda, M., Jugaku, J., Kabe, S., Kilmartin, P. M., Koribalski, B. S., Kobayashi, M., Masuda, K., Matsubara, Y., Miyamoto, M., Muraki, Y., Nakamura, T., Nankivell, G. R., Noda, S., Pennycook, G. S., Pipe, L. Z., rattenbury, N. J., Reid, M., Rumsey, N. J., Saito, T., Sato, H., Sato, S., Sekiguchi, M., Sullivan, D. J., Sumi, T., Watase, Y., Yanagisawa, T, Yock, P. C. M., & Yoshizawa, M. 1999, A. J., 118, 261
Alton, P. B. Xilouris, E. M., Bianchi, S., Davies, J., Kylafis, N. 2000, A&A, 356, 795
Aoki, T. E., Hiromoto, N., Takami, H., & Okamura, S. 1991, PASJ, 43, 755
Aparicio, A., Tikhonoc, N., & Karachentsev, I. 2000, A. J., 119, 177
Aparicio, A., Dalcanton, J. J., Gallart, C., & Martínez-Delgado, D. 1997, A. J., 114, 1447
Barteldrees, A., Dettmar, R.-J. 1994, Astr. Ap. Suppl., 103, 475
Bell, E. F., & de Jong, R. S. 2000, M.N.R.A.S., 313, 800
Bekki, K., & Chiba, M. 2001, astro-ph/0106523
Bergvall, N., Rönnback, J., Masegosa, J., & Östlin, G. 1999, Astr. Ap., 341, 697
Bernstein, R.A., Freedman, W.L., & Madore, B.F. 2002 Ap. J., 571, 85.
Bernstein, R.A. & Krick, J. 2003, in prep.
Bianchi, S., Ferrara, A., Davies, J. I., & Alton, P. B. 2000, M.N.R.A.S., 311, 601
Burkert, A., Truran, J. W., & Hensler, G. 1992, Ap. J., 391, 651
Burstein, D. 1979, Ap. J., 234, 829
Buser, R., Rong, J., Karaali, S., 1999, Astr. Ap., 348, 98
Carlberg, R. G., & Sellwood, J. A. 1985, Ap. J., 292, 79
Carney, B. W., Latham, D. W., & Laird, J. B. 1990, A. J., 99, 572
Chaboyer, B., Sarajedini, A., & Armandroff, T. E., 1999, A. J., in press
Charlot, S., Worthey, G., & Bressan, A. 1996, Ap. J., 457, 625
Chen, B., Stoughton, C., Allyn Smith, J., Uomoto, A., Pier, J. R., Yanny, B., Ivezić, Z., York, D. G., Anderson, J. E., Annis, J., Brinkmann, J., Csabai, I., Fukugita, M., Hindsley, R., Lupton, R., & Munn, J. A. 2001, Ap. J., 553, 184
Chiba, M., & Beers, T. C. 2000, A. J., 119, 2843
Chiba, M., & Yoshii, Y. 1998, A. J., 115, 168
Dalcanton, J. J., Spergel, D. N., & Summers, F. J. 1997, Ap. J., 482, 659
Dalcanton, J. J. & Bernstein, R. A. 2000a, A. J., 120, 203. (Paper I)
Disney, M., Davies, J., & Phillips, S. 1989, M.N.R.A.S., 239, 939
de Grijs, R., & Peletier, R. F. 2000, M.N.R.A.S., 313, 800
de Grijs, R., & van der Kruit, 1996, Astr. Ap. Suppl., 117, 19
de Grijs, R., Kregel, M., & Wesson, K. H. 2001, M.N.R.A.S., 324, 1074
de Grijs, R. 1998, M.N.R.A.S., 299, 595
de Grijs, R., Peletier, R. F., & van der Kruit, 1997, Astr. Ap., 327, 966
de Grijs, R., & Peletier, R. F. 1997, Astr. Ap., 320, L21
de Jong, R. S. 1996, Astr. Ap. Suppl., 118, 557
Dove, J. B., & Thronson, H. A. Jr. 1993, Ap. J., 411, 632
Eggen, O. J., Lynden-Bell, D., & Sandage, A. R. 1962, Ap. J., 136, 748 (ELS)
Fall, S. M., & Efstathiou G. 1980, M.N.R.A.S., 193, 189
Ferrini, F. Molla, M., Pardi, M. C., & Angeles, I. 1994, Ap. J., 427, 745
Fuchs, B., Dettbarn, C., Jahreiss, H., & Wielen, R. 2000, in ASP Conf. Ser. 228, Dynamics of Star Clusters and the Milky Way, ed. S. Deiters, B., Fuchs, A. Just, R. Spurzem, & R. Wielen (San Francisco: ASP), 235
Furhmann, K. 1998, Astr. Ap., 338, 161
Fry, A. M., Morrison, H. L., Harding, P. & Boroson, T. A. 1999, A. J., 118, 1209
Gilmore, G., & Wyse, R. F. G. 1985, A. J., 90, 2015
Gilmore, G., & Wyse, R. F. G. 1986, Nature, 322, 806
Gilmore, G., Wyse, R. F. G., & Jones, J. B. 1995, A. J., 109, 1095
Gilmore, G., Wyse, R. F. G., & Kuijken, K. 1989, ARA&A27, 555
Gilmore, G., & Reid, N. 1983, MNRAS202, 1025
Giovanelli, R., Haynes, M. P., Salzer, J. J., Wegner, G., da Costa, L. N., Freudling, W. 1995, A. J., 110, 1059
Gratton, R. G., Carretta, E., Matteucii, F., & Sneden, C. 2000, Astr. Ap., 358, 671
Haynes, M. P., Giovanelli, R., Herter, T., Vogt, N. P., Freudling, W., Maia, M. A. G., Salzer, J. J., & Wegner, G. 1997, A. J., 113, 1197
Haywood, M., Robin, A. C., & Creze, M. 1997, Astr. Ap., 320, 440
Held, E., B., Saviane, I., & Momany, Y. 1999, Astr. Ap., 345, 747
Held, E., B., Saviane, I., Momany, Y., Rizzi, L, & Bertelli, G. 2001, Ap&SS277, 331
Held, E. V., Momany, Y., Saviane, I., Rizzi, L, & Bertelli, G. 2001, in Galaxy Disks and Disk Galaxies, eds. J. G. Funes, S. J. Corsini, & E. M. Corsini, (San Francisco: ASP)
Hogan, C. J., & Dalcanton, J. 2000, Phys. Rev. D., 62, 817
Holland, S., Fahlman, G. G., & Richer, H. B. 1996, A. J., 112, 1035
Howk, J. C., Savage, B. D. 1999, A. J., 117, 2077
Huang, S., & Carlberg, R., 1997, Ap. J., 480
Ibata, R., Gilmore, G., & Irwin, M. 1994, Nature, , 370, 194
Ibata, R., Irwin, M., Lewis, G. F., & Stolte, A. 2001, Ap. J., 547, L133
Jansen, R. A., Franx, M., Fabricant, D. 2001, Ap. J., 551, 825
Jansen, R. A., Knapen, J. H., Beckman, J. E., Peletier, R. F., & Hes, R. 1994, MNRAS270, 373
Jensen, E. B., & Thuan, T. X. 1982, Ap. J. Suppl., 50, 421
Just, A., Fuchs, B., & Wielen, R. 1996, Astr. Ap., 309, 715
Kauffmann, G., White, S. D. M., & Guiderdoni, B. 1993, M.N.R.A.S., , 264, 201
Karachentsev, I. D., Karachentseva, V. E., & Parnovsky, S. L. 1993, Astro. Nacht., 314, 97
Karachentsev, I. D., Karachentseva, V. E., Kudrya, Y. N., Sharina, M. E., & Parnovsky, S. L. 1999, Bull. Special Asrophys. Obs., 47, 5
Kerber, L. O., Javiel, S. C., & Santiago, B. X. 2001, Astr. Ap., 365, 424
Kinman, T. D., Suntzeff, N. B., & Kraft, R. P. 1994, A. J., 108, 1722
Knapen, J. H., Hes, R., Beckman, J. E., & Peletier, R. F. 1991, Astr. Ap., 241, 42
Kormendy, J. 1992, in “Galactic Bulges: IAU 153”, ed. H. DeJonghe & H. J. Habing, (Dordrecht: Kluwer), 209
Kregel, M., van der Kruit, P. C., & de Grijs, R. 2002, M.N.R.A.S., , in press
Kuchinski, L. E., Terndrup, D. M., Gordon, K. D., Witt, A. N., 1998, A. J., 115, 1438
Kylafis, N. D., Bahcall, J. N., 1987, Ap. J., 317, 637
Larsen, J. A., & Humphreys, R. M. 1994, Ap. J., 436, L149
Lacey, C. G. 1984, M.N.R.A.S., 208, 687
Layden, A. C. 1995, A. J., 110, 2288
Lequeux, J., Combes, F., Dantel-Fort, M., Cuillandre, J.-C., Fort, B., & Mellier, Y. 1998, Astr. Ap., 334, 11.
Liu, W. M., & Chaboyer, B. 2000, Ap. J., 544, 818
Lupton, R. H., Gunn, J. E., & Szalay, A. S. 1999, A. J., 118, 1406
Majewski, S. R. 1993, ARA&A, 31, 575
Mannucci, F., Basile, F., Poggianti, B. M., Cimatti, A., Daddi, E., Pozzetti, L, & Vanzi, L. 2001, M.N.R.A.S., 326, 745
Martínez-Delgado, D., Gallart, C., & Aparicio, A., 1999 A. J., 118, 862
Matthews, L. D., Gallagher, J. S., & van Driel, W. 1999, A. J., 118, 2751
Matthews, L. D., & Wood, K. 2001, Ap. J., 548, 150
Matthews, L. D., & van Driel, W. 2000, Astr. Ap. Suppl., 143, 421
Minniti, D., & Zijlstra, A. A. 1996, Ap. J., 467, L13
Misiriotis, A., & Bianchi, S. 2002, Astr. Ap., , 384, 866
Morrison, H. L., Boroson, T. A., & Harding, P. 1994, A. J., 108, 1191
Morrison, H. L., Miller, E. D., Harding, P., Stinebring, D. R., & Boroson, T. A., 1997, A. J., 113, 2061
Morrison, H. L., 1999, in The Third Stromlo Symposium: The Galactic Halo, ed. B. K. Gibson, T. S. Axelrod, & M. E. Putman (San Francisco: ASP), 174
Morrison, H., Mateo, M., Olszewski, E. W., Harding, P., Dohm-Palmer, R. C., Freeman, K.C., Norris, J. E., & Morita, M. 2000, A. J., 119, 2254
Näslund, M., & Jörsatër, S. 1997, Astr. Ap., , 325, 915
Neeser, M. J., Sackett, P. D., De Marchi, G., Paresce, F. 2002, astro-ph/0201141, Astr. Ap., in press.
Ng, Y. K., Bertelli, G., Chiosi, C., & Bressan, A. 1997, Astr. Ap., 324, 65
Norris, J. E., & Ryan, S. G. 1991, Ap. J., 380, 403
Norris, J. E., 1994, Ap. J., 431, 645
Norris, J. E. 1999, Ast.Sp.Sci., 265, 213
Ojha, D. K. 2001, MNRAS322, 426
Pardi, M. C., Ferrini, F., & Matteucci, F. 1995, Ap. J., 444, 207
Piersimoni, A. M., Bono, G., Castellani, M., Marconi, G., Cassisi, S., Buonanno, R., & Nonino, M. 199, Astr. Ap., 352, L63
Pfenniger, D. 1993, in Galactic Bulges, IAU Symposium 153, ed. H. Dejonghe & H. J. Habing, 387
Phelps, S., Meisenheimer, K., Fuchs, B., & Wolf, C. 2000, Astr. Ap., 356, 108
Pohlen, M., Dettmar, R.-J., Lütticke, R. 2000, Astr. Ap., 357, 1
Prochaska, J. X., Naumov, S. O., Carney, B. W., McWilliam, A., & Wolfe, A. M. 2000, A. J., 120, 2513
Quillin, A. C., & Garnett, D. R. 2000, Ap. J., submitted
Quinn, P. J., & Goodman, J. 1986, Ap. J., 309, 472
Quinn, P. J., Hernquist, L., & Fullagar, D. P. 1993, Ap. J., 403, 74
Rauscher, B. J., Lloyd, J. P., Barnaby, D., Harper, D. A., Hereld, M., Lowenstein, R. F., Severson, S. A., Mrozek, F. 1998, Ap. J., 506, 116
Ried, I. N., & Hawley, S. L. 2000, “New Light on Dark Stars: Red Dwarfs, Low-Mass Stars, Brown Dwarfs”, (Chichester: Springer-Praxis)
Robin, A. C., Haywood, M., Crézé, Ojha, D. K, & Bienaymaé, O. 1996, Astr. Ap., 305, 125
Sackett, P. D., Morrision, H. L., Harding, P., & Boroson, T. A. 1994, Nature, 370, 441
Sandage, A., & Fouts, G. 1987, A. J., 93, 74
Sarajedini, A., & van Duyne, J. 2001, astro-ph/0107344
Sarajedini, A., Claver, C. F., & Ostheimer, J. C. Jr. 1997, A. J., 114, 2505
Schlegel, D. J., Finkbeiner, D. P., & Davis, M. 1998, Ap. J., 500. 525
Schneider, S. E., Thuan, T. X., Magri, C., & Wadiak, J. E. 1990, Ap. J. Suppl., 72, 245
Searle, L, & Zinn, R., 1978, Ap. J., 225, 357
Sellwood, J. A., & Carlberg, R. 1984, Ap. J., 282, 61
Sellwood, J. A., Nelson, R. W., & Tremaine, S. 1998, Ap. J., 506, 590
Shaw, M. A., & Gilmore, G. 1990, M.N.R.A.S., 242, 59
Spitzer, L. Jr., & Schwarzchild, M. 1951, Ap. J., 114, 385
Spitzer, L. Jr., & Schwarzchild, M. 1953, Ap. J., 118, 106
Stasinska, G., & Sodré, L. Jr. 2001, Astr. Ap., 374, 919
Statler, T. S. 1989, Ap. J., 344, 217
Tautvaiŝiene, G., Edvardsson, B., Tuominen, I. & Ilyin, I. 2001, Astr. Ap., in press
Tsikoudi, V. 1979, Ap. J., 234, 842
van den Bergh, S. 1996, Pub. A.S.P., 108, 986
van den Bosch, F. C. 1998, Ap. J., 507, 601
van den Bosch, F. C. 2002, M.N.R.A.S., submitted
van den Bosch, F. C. 2001, M.N.R.A.S., 327, 1334
van der Kruit, P. C. 1988, Astr. Ap., 192, 117
van der Kruit, P. C., & Searle, L. 1981a, Astr. Ap. Suppl., , 95, 105
van der Kruit, P. C., & Searle, L. 1981, Astr. Ap. Suppl., , 95, 116
van der Kruit, P. C., & Searle, L. 1982, Astr. Ap., 110, 61
van Dokkum, P. G., Peletier, R. F., de Grijs, R., & Balcells, M., 1994, Astr. Ap., 286, 415
Velazquez, H., & White, S. D. M. 1999, M.N.R.A.S., 304, 254
Wainscoat, R. J., Freeman, K. C., & Hyland, A. R. 1989, Ap. J., 337, 163
Walker, I. R., Mihos, J. C., & Hernquist, L. 1996, Ap. J., 460, 121
Wielen, R. 1977, Astr. Ap., 60, 263
Wyse, R. F., & Gilmore, G. 1985, A. J., 90, 2015
Wyse, R. F., & Gilmore, G. 1988, A. J., 95, 1404
Wyse, R. F., & Gilmore, G. 1995, A. J., 110, 2771
Wyse, R. F. 2001, in Galaxy Disks and Disk Galaxies, eds. J. G. Funes, S. J. Corsini, & E. M. Corsini, (San Francisco: ASP)
Xilouris, E. M, Kylafis, N. D., Papamastorakis, J., Paleologou, E. V., Haerendel, G. 1997, Astr. Ap., 325, 135
Xilouris, E. M., Alton, P., Davies, J., Kylafis, N. D., Papamastorakis, J., Trewhella, M. 1998, Astr. Ap., 331, 894
Xilouris, E. M., Byun, Y., Kylafis, N. D., Paleologou, E. V., Papamastorakis, J., 1999, Astr. Ap., 344, 868
Yanny, B., et al. 2000, Ap. J., 540, 825
Zaritsky, D., Kennicutt, R. C., Jr., & Huchra, J. P. 1994, Ap. J., 420, 87
Zepf, S. E., Liu, M. C., Marleau, F. R., Sackett, P. D., & Graham, J. R. 2000, A. J., 119, 1701
Zheng, Z., Shang, Z., Su, H., Burstein, D., Chen, J., Deng, Z., Byun, Y.-I., Chen, R., Chen, W.-P., Deng, L, Fan, X., Fang, L.-Z., Hester, J. J., Jiang, Z., Li, Y., Lin, W., Sun, W.-H., Tsay, W.-S., Windhorst, R. A., Wu, H., Xia, X., Xu, W., Xue, S., Yan, H., Zheng, Z., Zhou, X., Zhu, J., Zou, Z., & Lu, P. 1999, A. J., 117, 2757
Zoccali, M., Renzini, A., Ortolani, S., Bragaglia, A., Bohlin, R., Carretta, E., Ferraro, F. R., Gilmozzi, R., Holberg, J. B., Marconi, G., Rich, R. M., & Wesemael, F. 2001, Ap. J., 553, 733