VLBI observations in Cluster-Cluster mode at 1.6 GHz
Abstract
We describe, and present preliminary results from the analysis of 1.6 GHz VLBI observations, made in Cluster-Cluster mode between subgroups of antennas from the WSRT, VLA and MERLIN arrays. We observed for two 6-hour periods on consecutive days, simultaneously monitoring 4 compact radio sources with angular separations ranging from 1 to 9 degrees. The data were recorded in a non-standard MkIII mode using special set-ups, and correlated at the MPIfR MkIIIa correlator. The preliminary results from standard and phase reference analyses are very encouraging. The experiment has provided a useful database for investigating the potential of this new observing technique at low frequencies.
1 Introduction
The Cluster-Cluster (Cl-Cl) or multiview VLBI technique is a development of the observational capabilities of VLBI, where single telescopes are replaced by sites with multiple antenna elements (a “cluster”) fed from a common local oscillator. The Cl-Cl observing mode allows simultaneous observations of multiple sources on the separate “sub-baselines” between sub-elements from one site to another, irrespective of their angular separation.
Hemenway (1974) describes such observations between 2 sites, each with 2 antennas. The advantages offered by Cl-Cl observations have been reviewed by Sasao & Morimoto (1991) in the context of the Japanese VERA project. As with conventional phase-referencing techniques, where antennas are switched rapidly between a target and reference source, the Cl-Cl mode is used to help elminate the unknown contributions to the signal paths caused by the atmosphere and troposphere. The neutral and ionized media lying between a radio source and the surface of the Earth often have profound effects on the radiation fields traversing them, causing both temporal and spatial fluctuations in the signal path. Such fluctuations depend strongly on the observing wavelength. At cm and mm wavelengths, they are predominantly caused by temporal fluctuations in the distribution of water vapor in the troposphere. The dominant causes at longer wavelengths, however, are irregularities, both small- and large-scale, in the electron density distribution in the Earth’s ionosphere. Most of the ionospheric effects scale as . At approximately 2 GHz, the perturbations induced in the incoming radiation as it propagates through the troposphere and ionosphere have roughly equal magnitudes.
The standard phase-reference method using source-switching must make both temporal and spatial interpolations between the target and reference source phases. In contrast, in Cl-Cl mode observations temporal variations above each antenna, introduced in the wavefront towards each source, are continuously followed, and no temporal interpolation is needed. Thus, direction-dependent phase differences can be determined and corrected for more accurately.
2 Observations and correlation strategy
We made 1.6 GHz Cl-Cl mode observations of 4 strong, compact radio sources, selected from the ICRF and VLBA calibrator lists. The sources lie within a few degrees of each other on the sky (see Fig. 1). We used 4 telescopes from the NRAO VLA (designated A, B, C, D), 4 separate 3-telescope sub-clusters from the Westerbork (WSRT) array (W, X, Y, Z) and 3 telescopes from the Jodrell Bank MERLIN array
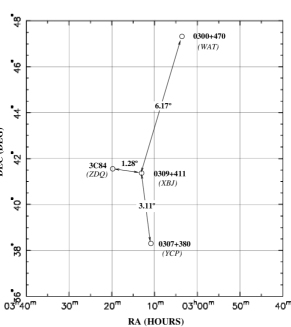
(J=Jodrell-Lovell, T=Tabley, P/Q=Jodrell-Mark2). At each cluster site, each telescope tracked a different source continuously, except for periods of about 7 minutes every 2 hours when all telescopes observed the same calibrator source (3C84) for local calibration of the arrays. In order to provide 4 separate sub-baseline triangles for the 4 sources, the Mark2 telescope at Jodrell was switched every few minutes between 2 sources, to compensate for the smaller number of elements in that cluster. Thus, the 4 sources were observed with the 4 sub-triangles WAT, XBJ, YCP, ZDQ. The observations were made between UT 23:00 and 05:00, and on 2 consecutive days (1999 November 16-18) in order to disentangle tropospheric/ionospheric propagation effects from geometric errors.
In addition to the observations in Cl-Cl mode, simultaneous observations were made using a network of single telescopes (Effelsberg, Medicina, VLBA-HN, NL, PT) on the first day, cycling between the 4 sources to permit mapping of their structures with a resolution similar to the observations in Cl-Cl mode. This was designed to overcome the effect of poor -coverage in the analysis of the Cl-Cl mode observations.
The observing and recording strategy were similar to those used in our previous Cl-Cl observations at 6 cm in June 1995 (Rioja et al. 1997). We recorded using MkIII Mode B, assigning different subsets of video channels to different telescopes at each multi-element site. Because the recorded bandwidth must be shared between the telescopes in a cluster, we recorded at double speed to improve the SNR on each sub-baseline. At the VLA the 4 telescope signals were recorded using the 4 inputs of a VLBA terminal, and a single MK4 terminal was used at WSRT (see Rioja, 1995 for the recording set-up). For the MERLIN cluster the signals from Tabley and JB-Lovell were recorded with a MK4 terminal, and the JB-Mark2 signal was recorded using a VLBA terminal. In this way we were able to record 4 x 4MHz channels for 3 of the sub-triangles, and 2 x 4MHz channels for triangle ZDQ.
The data were correlated using the MPIfR MkIIIa correlator in Bonn. We followed special, non-standard procedures similar to those used in the previous Cl-Cl observations at 6 cm, using multiple passes to recover data from all the “parallel” sub-baselines (WA, WT, AT, XB, XJ,..), and from the “cross”-baselines AX, AY, AZ, AJ and AP for the calibration periods. Amazingly, given the complexity of the observing, recording and correlation set-up, fringes were indeed detected on all sub-baselines !
3 Preliminary post-processing analysis
The post-correlation data reduction is being performed using the AIPS package. A number of contributions to the signal path were missing in the a priori model used in the MkIIIa correlator and we used the task CLCOR to correct for the telescope axis offsets and parallactic angle contributions to the observed phases, delays and rates. We also used CLCOR to implement improved station positions for WSRT (tied-array position) and JB-Mark2 in ITRF2000, derived from a special 6 cm experiment made using geodetic techniques (Charlot et al. 2001). These have estimated accuracies better than 10 cm. We used locally determined telescope separations to derive IRTF2000 positions for JB-Lovell and Tabley. However, the biggest uncorrected contribution in observations at 1.6 GHz is due to the propagation of the wavefronts through the ionosphere. This is particularly large during a maximum in the cycle of solar activity. In fact the epoch of these observations was very close to the last solar maximum.
The preliminary analysis has followed two paths:
3.1 Standard analysis
We have made a separate phase self-calibration analysis for each of the 4 sources, observed on the 4 sub-baseline triangles. From the individual analyses of observations of the 4 triangles, we find that the delay and rate residuals of telescopes belonging to the same “cluster” do show a similar behaviour.

Fig. 2 shows an example of the temporal behaviour of the residual delay (determined using FRING) at the VLA and MERLIN sites, using the WSRT site as a reference (and before the antenna position corrections were made). It is illustrative to note the opposite signs of the delay rate —determined from the phase rate assuming a non-dispersive medium— (the individual slopes within each dashed segment) and the “true” delay rate (slope between consecutive dashed segments) for the VLA site, from the beginning of the observations at 23:30 UT until about 03:00 UT. This behaviour is characteristic of a dispersive medium, where the group delay produces a phase change of opposite sign compared with that from the same delay produced by a geometric or neutral atmospheric path error. We conclude that during this period the residual delay must be largely caused by the ionosphere. However, for the MERLIN site, the phase and delay rate behaviour with time agree, showing that the ionosphere is not the main source of delay error on the short MERLIN-WSRT sub-baselines, at least at night time. (Note that, in this plot, there are still residual geometric errors due to poor antenna coordinates). Note also the coincidence between the Sun setting at the VLA, and the agreement between the phase and delay rates after ca. 03:00 UT —clearly the ionosphere has shut down !
3.2 Phase reference analysis
We have also attempted a preliminary phase referencing analysis. Analysis of conventional “nodding” phase reference observations can require a double interpolation of the instrumental residual phases, in time (between successive calibrator observations) and perhaps also in the sky (between calibrator positions if attempting a spatial interpolation —see Fomalont & Kopeikin, these Proceedings) to estimate the phase correction at the location of the target source. In contrast, phase-referencing in Cl-Cl observing mode consists of a spatial interpolation of the instrumental residual phases between simultaneous observations of calibrators in different directions.
We selected a “reference triangle” (XBJ) and its source (0309+411, the “reference source”) and transferred their phase solutions, using phase-reference techniques, to the analysis of the observations from the other 3 triangles (“target triangles”) and their “target sources”. This strategy is similar to that used for the in-beam phase-referencing used for the analysis of the close source pair 1038+528 A,B (Rioja and Porcas, 2000). Even if there are no geometric errors arising from poor antenna and/or source coordinates, the spatial structure of the ionosphere will affect the referenced phases. Figure 3 shows the referenced visibility phases for the 3 sub-baselines, for each of the 3 target triangles observing a target source. As expected, there is a strong correlation between the rate of change of the referenced visibility phases with time on the various sub-baselines, and the increasing angular separation between target and reference source (1\fdg28 for 3C 84, 3\fdg11 for 0307+380 and 6\fdg17 for 0300+470). This is, as expected, particularly noticeable on the longest baselines to the VLA during the first half of the observations.
4 Summary and further work
The complex observations and processing of the Cl-Cl mode VLBI observations between 3 “cluster” sites, presented in this contribution, have been successful. The resulting data set provides an excellent opportunity to investigate the capabilities of this new technique at low frequencies, and to explore new analysis routes. The potential scientific returns may be realised in the near future when new, dedicated instruments such as VERA come into operation.


At present, we are continuing to work for one of the main goals of these observations in Cl-Cl mode, to determine the size of isoplanatic regions in the ionosphere and the effects on VLBI observations. With a 3 calibrator experiment (or 2 calibrators if they lie on a straight line with the target source), one can remove both temporal and spatial phase fluctuations. The problem with conventional “nodding” between 3 or 4 sources is that the temporal phase interpolation between sources is very difficult because of the large gaps between observations of a given source. It is hoped that the Cl-Cl method can provide accurate phase measurements by observing 3 calibrator sources simultaneously and removing a 2D gradient with angle on the sky from the data of the 4th (target) source. This would remove the effect of the relatively large scale ionospheric refraction on the sky (isoplanatic ionospheric effects), particularly at low frequencies.
Acknowledgements.
We would like to thank all the people involved in the preparations for this highly non-standard observation at each site, and the staff at the MPIfR correlator. Their altruist efforts and great expertise have always played a major role in our series of VLBI observations in Cluster-Cluster mode - to the point that none of this would be possible otherwise. The European VLBI Network is a joint facility of European, Chinese and other radio astronomy institutes funded by their national research councils. NRAO is a facility of the US National Science Foundation, operated by Associated Univerties Inc. M.J.R., L.I.G. and R.T.S. acknowledge partial support from the EC ICN RadioNET (Contract No. HPRI-CT-1999-40003).References
- [2001] Charlot, P., et al. 2001, Proc. of the 15th Working Meeting on European VLBI for Geodesy and Astrometry, ed. Behrend & Rius, (IEEC, Barcelona), 194
- [1974] Hemenway, P.D. 1974, PhD Thesis “The measurement of position, baseline, and time using 4-antenna interferometry”, (University of Virginia, Charlottesville)
- [1995] Rioja, M. et al, 1995, Proc. 10th Working Meeting on European VLBI for Geodesy and Astrometry, ed. Lanotte and Bianco, (ASI, Matera), 160
- [1997] Rioja,M., Stevens, E. Gurvits, L. et al. 1997, Vistas in Astronomy, 41 (2), 213
- [2000] Rioja, M.J. & Porcas, R.W., 2000, A&A, 355, 552
- [1991] Sasao T. and Morimoto M. 1991, In Chapman Conference on Geodetic VLBI: Monitoring Global Change, (U.S. Dep. of Comm.,Silver Spring, Md), NOAA Tech. Rep. NOS 137 NGS 49, p48-62