On the nature of a secondary main sequence turn-off in the rich LMC cluster NGC 1868
Abstract
Evidence for a second main-sequence turn-off in a deep colour-magnitude diagram of NGC 1868 is presented. The data were obtained with HST/WFPC2 and reach down to . Besides the usual turn-off found in previous analyses, another possible turn-off is seen at (), which is consistent with an age of . This CMD feature stands out clearly especially when contaminating field LMC stars are statistically removed. The background subtracted CMD also visibly displays a red subgiant branch extending about 1.5 mag below the younger turn-off and the clump of red giants. The significance of the secondary turn-off in NGC 1868 was confirmed with Monte-Carlo simulations and bootstrapping techniques. Star-counts in selected regions in the cluster CMD indicate a mass ratio of old population/young population in the range , depending on the mass function slope. The existence of such a subpopulation in NGC 1868 is significant even in the presence of uncertainties in background subtraction. The possibility that the secondary turn-off is associated with the field star population was examined by searching for similar features in CMDs of field stars. Statistically significant excesses of stars redwards of the main-sequence were found in all such fields in the range . These however are much broader features that do not resemble the main-sequence termination of a single population. We also discuss other alternative explanations for the feature at , such as unresolved binarism, peculiar stars or CMD discontinuities associated with the Böhm-Vitense gap.
keywords:
Magellanic Clouds: clusters; clusters individual: NGC 1868; stars: statistics.1 Introduction
NGC 1868 is a rich Large Magellanic Cloud (LMC) cluster located at and (J2000), approximately 6∘ away from the LMC’s centre. Its age has been estimated both from ground-based photometry and spectroscopy, often yielding discrepant results covering the range (Flower et al. 1980, Hodge 1983, Bica & Alloin 1986, Chiosi et al. 1986, Olszewski et al. 1991, Corsi et al. 1994 and references therein). Most age estimates come from the interpretation of optical colour-magnitude diagrams (CMDs), usually based on the positions of either the main-sequence turn-off (MSTO) or the clump of red giants (RC) or both. However, none of the CMDs available until now have been deep enough to allow probing the main sequence at magnitudes as faint as with small photometric errors (see the web page on www.ast.cam.ac.uk/STELLARPOPS/LMCdatabase for a detailed list of references on NGC 1868 and other rich LMC clusters in the HST Cycle 7 program GO7307).
In this paper we investigate a possible second, fainter and therefore older, MSTO at , based on a deep CMD of NGC 1868 built from HST/WFPC2 data. This second population of stars may be the result of a strong interaction with another cluster, or of the capture of a lower-mass, older cluster by NGC 1868. In fact, there is evidence for a growing number of clusters in the LMC which may have undergone strong interactions or mergers (Kontizas et al. 1993, Dieball & Grebel 1998, Leon et al. 1999, Dieball, Grebel & Theis 2000). Confirmation of a merger event in a cluster’s history, however, requires detailed photometric and/or spectroscopic data. Sagar et al (1991), based on a CMD of NGC 2214 with two apparent supergiant branches, suggested that it was made up of two distinct populations. However, Lee (1992), Bhatia & Piotto (1994) and Banks et al (1995), based on larger and more accurate photometry, found a single population in the CMD of NGC 2214. Given that signatures of mergers or strong interactions remain observable in clusters for at least 1 Gyr (de Oliveira, Bica & Dottori 2000), NGC 1868, if confirmed as a merger product, may be a good laboratory for studying the dynamical effects and the final products of such events. Hence, it is essential to investigate closely the possibility that it is made up of two distinct populations.
Other explanations for a feature similar to a MSTO exist. Unresolved binaries, for instance, are usually brighter and redder than the main sequence of single stars. Therefore, an enhanced fraction of unresolved binaries could result in such a feature. Sudden changes in stellar structure, such as the onset of convective envelopes, may lead to CMD features such as the Böhm-Vitense gap, that may also mimic a MSTO (Böhm-Vitense 1970). These possibilities are also considered in the analysis of our deep NGC 1868 CMD, as well as of other similar CMDs.
The paper outline is as follows: in §2 we describe the HST/WFPC2 data used, both on NGC 1868 and on control field areas. We also discuss the process of removing contamination by field stars from the on-cluster CMD. In §3 we test the statistical significance of the candidate secondary MSTO by means of bootstrapping realizations. In §4 we use isochrones and star counts in selected CMD areas to extract useful information about this presumed secondary population in NGC 1868. In §5 we explore the possibility that the candidate MSTO is related to field stars, making use of CMDs obtained in control field areas. We also explore the alternative mechanisms that could yield to features similar to a MSTO at that position. Our main conclusions are presented in §6.


2 The data
The WFPC2 on-cluster data are described in more detail in Santiago et al. (2001). The off-cluster data used for field star subtraction were reduced and analyzed by Castro et al. (2001). In both cases the images were combined and calibrated using the standard pipeline procedure (Holtzman et al. 1995a,b). Photometry was carried out using DAOPHOT tasks and is described in detail by Santiago et al (2001) and Castro et al (2001). Zero-points, CTE and aperture corrections were also applied, again following standard procedures (Santiago et al 2001, de Grijs et al 2002a,b).
Figure 1 shows the resulting CMDs. The left panel shows stars belonging to the on-cluster images. Two such images were taken, one with the Planetary Camera (PC) at the centre of NGC 1868 and the other at its half-light radius. They are the CEN and HALF fields as defined by Santiago et al. (2001). The CMD shown represents the final sample, including stars from both HALF and CEN fields and with no repeats. The total on-cluster solid angle is approximately 7.5 arcmin. As explained in Santiago et al. (2001), the stars in the region common to the HALF and CEN fields had two independent photometric measurements and were thus used to determine uncertainties as a function of magnitudes and colour. A total of 731 stars were found in the overlap region between the HALF and CEN fields. These empirical error determinations are an essential part of our upcoming analysis. The uncertainties were computed in bins 0.5 mag wide in both and . In each magnitude bin we computed the mean value and standard deviation () of the distribution of magnitude differences. The typical uncertainty of a single measurement was then assumed to be . The photometric uncertainty analysis is described in more detail in Kerber et al (2002).
The right panel in Figure 1 shows stars in the off-cluster area, located 7.3’ away from the centre of NGC 1868 and previously studied by Castro et al (2001). This off-cluster field corresponds to a single WFPC2 field, covering about 5 arcmin. Both CMDs include only objects that were classified as stellar sources in the classification schemes presented in Santiago et al (2001) and Castro et al (2001). No additional cleaning of remaining spurious objects or background galaxies was made, resulting in some objects located well away from the cluster main-sequence (MS), the red giant branch (RGB) and the RC. Most of them should be contaminating unresolved background galaxies or faint stars in our Galaxy.
The on-cluster stars display a clear MS that terminates at . Previous works find the MS termination at (Corsi et al 1994, Brocato et al 2001). This is also roughly the magnitude of the RC (), which contains He burning stars and is largely dominated by the cluster stars. In both panels, a clear RGB stretches downwards from the RC position to the bottom of the subgiant branch (SGB) at , . These stars mostly belong to the old ( ) LMC field star population (Holtzman et al. 1997, Castro et al. 2001, Smecker-Hane et al 2002). Besides the main cluster and old field turn-offs, there are two additional features that may be interpreted as MSTOs in the CMD: one has mostly field stars with and had already been identified by Castro et al. (2001) as a field population; the other is fainter, at , and consists entirely of stars in the on-cluster data. It is this latest feature that we concentrate on, as a candidate NGC 1868 subpopulation. The MSTOs described here are indicated in Figure 1.
2.1 Removing contaminating field LMC stars
In order to clean the left panel of Figure 1 from background field contamination, we statistically remove the control off-cluster CMD from the on-cluster one. Several procedures for doing so have been considered. One method is to match the off-cluster stars to corresponding stars in the on-cluster image using the estimated probabilities that two stars could be independent photometric measurements of each other. In order to estimate these matching probabilities, we use the empirically determined photometric uncertainties in both images and assume a Gaussian error distribution. Cluster stars are then randomly removed according to their probability of matching any of the off-cluster stars. In this approach a reliable estimate of the photometric uncertainties is very important. As pointed out previously, we used the independent magnitude measurements for the stars in common between the CEN and HALF fields to empirically estimate standard deviations () in the error distribution at different magnitude bins (Santiago et al 2001, Kerber et al 2002).
An alternative way of removing contaminating field stars is to bin both on-cluster and off-cluster data in magnitude (or in magnitude and colour) and to subtract the histogram of the latter from that of the former. At each bin, a subset of the on-cluster stars, corresponding to the subtracted histogram, is randomly selected. The two approaches have been tested and yield similar results. As our main concern is to assess the existence of a second, older population superposed to the dominant NGC 1868 population, the branch of evolved stars is critical, since it provides the best opportunity to single out stars from each individual population. Therefore, field subtraction was carried out separately for the MS and for the SGB/RGB locus. This latter is marked on Figure 1.
A more detailed discussion about the issue of field stars removal is presented in an upcoming paper (Kerber et al. 2002).
The cleaned CMD is shown in Figure 2. The CMD is now cut-off at the faint end () as this region is not relevant to the current analysis. Below this limit, sampling incompleteness would only further complicate field star subtraction. We also cut it at bright magnitudes () to avoid regions where saturation effects start to take place ( and for the HALF and CEN fields, respectively). The statistical removal of field stars has depleted the subgiant branch in the range . A residual number of SGB stars brighter than but much fainter than the cluster RC remains. As this excess of SGB stars reltive to the field is located at brighter magnitudes than the candidate second MSTO, it is a first evidence for the reality of this feature. As for the secondary MSTO itself, at , it was left untouched, which reflects the absence of field stars close to it. This again supports the reality of the second population in NGC 1868.
3 Statistical significance of the candidate secondary MSTO
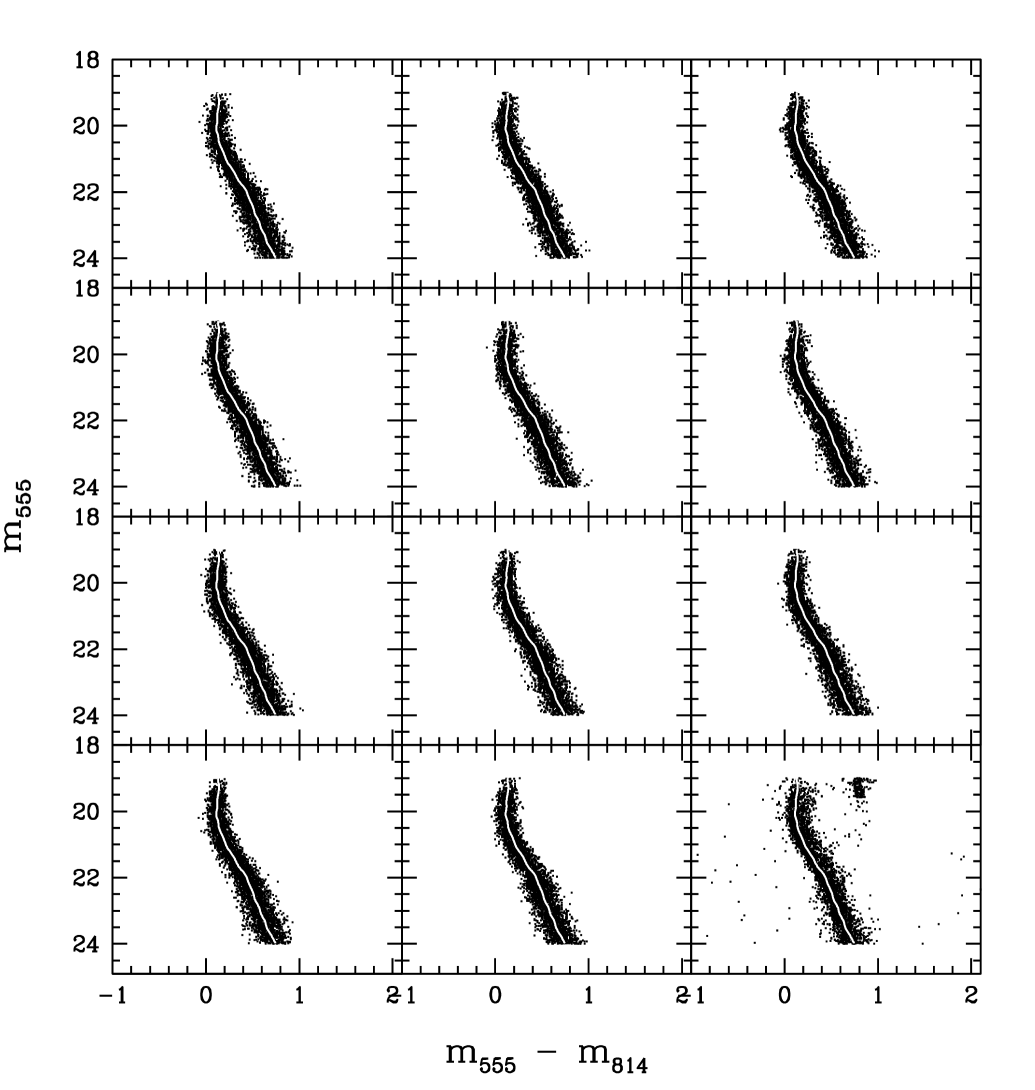
In this section we will assess whether the feature we tentatively identify as a secondary MSTO in the CMD of NGC 1868 is statistically significant. More specifically we address the question of whether a similar feature could originate from a single main sequence through a random realization of photometric errors in the data. We explore this possibility by means of Monte-Carlo realizations of the cleaned NGC 1868 CMD. In each realization we collapse the cluster MS onto a fiducial line and redistribute the data, using the measured photometric uncertainties and assuming Gaussian error distributions in magnitude and colour.
The main sequence fiducial line is determined by taking the median colour at different magnitude bins. We apply a 3 clipping to the colour distribution in order to eliminate outliers and iterate until convergence. We initially define this MS line in bins spaced by 0.2 mag. A cubic spline interpolation is then used to fill this line in a much narrower () binning. Each true MS star is then randomly assigned to one of the points along the MS fiducial line, using a two-dimensional Gaussian probability function whose standard deviations are given by the star’s measured magnitude and colour uncertainties. We then redistribute the data back onto the CMD plane, the magnitude and colour of each artificial star again being a random realization of the same Gaussian distribution of errors.
One hundred such Monte-Carlo simulations were carried out. A subset with 11 of the resulting CMDs is shown in Figure 3. The actual data are shown in the lower-right panel for comparison. The MS fiducial line is shown as a white line for guidance. The artificial CMDs have similar width as the data but are unable to reproduce the apparent turn-off at , or the residual of the old field population turn-off (), whose stars are farther to the red of the MS and much more clumped together than any set of points in any of the simulated CMDs. The simulations also fail to reproduce the main cluster MSTO at and . This proves that scatter due to photometric errors alone cannot account for these features seen in the data. Notice that these experiments do not explicitly account for the effect of unresolved binaries on the CMD. The fact that the distribution of true stars is skewed redwards from the MS fiducial line is likely caused by unresolved binaries. Incorporation of unresolved binaries would help spread out the simulated stars towards redder colours, but is unlikely to reproduce the features mentioned above, especially if we consider that part of the effect is already incorporated in the position of the MS fiducial line. We discuss the effect of binaries in more detail in §5.2.

4 The candidate NGC 1868 second population
Assuming that the second MSTO at is real and belongs to the cluster, one wishes to determine what are the main characteristics of this population in NGC 1868.
In Figure 4 we again show the cleaned NGC 1868 CMD. Superimposed to the data we show three Padova isochrones (Girardi et al. 2000). In plotting the isochrones, we assume a distance modulus of to the LMC (Panagia et al. 1991). The data were extinction corrected assuming E(B-V) =0.04 as indicated. Conversion from E(B-V) to E(555-814) was done as described by Holtzman et al (1995a,b). The and age (in Myrs) of each isochrone are shown in the figure. The [-0.4,800] isochrone fits the main NGC 1868 population. The other isochrones are attempts to fit the second turn-off and SGB. The younger and more metal-rich isochrone with [Fe/H] = -0.4 and an age of 2500 Myrs provides the best fit to both turn-off and SGB regions.

Using star counts and this best fitting isochrones, we can estimate the mass fraction of this candidate older NGC 1868 population relative to the dominant and younger one. There are 11 stars in the range ( ) and located along the SGB. Besides these, 13 stars are located within the CMD area whose limits are: , and . This corresponds to the region where the second MSTO is clearly detached from the MS. Assuming that all such stars are in fact associated with an older population belonging to NGC 1868 and using the best fitting isochrone, we infer the masses that correspond to the limiting range in absolute magnitudes: they are for the basis of MSTO position and for () along the SBG. As for the dominant cluster population we find = 732 stars along the cluster MS with () and fainter than the MS termination (we cut it at ). These limits correspond to for the best fitting isochrone to the NGC 1868 upper MS ([Fe/H],age(Myrs) = -0.4,800). Assuming the cluster’s present day mass function (PDMF) to be a power-law with fixed slope within the mass ranges considered, the mass ratio will be given by
Assuming a Salpeter value for the MF (), and the limiting mass values quoted above for each of the subpopulation, we then infer . For we have and for , . The mass ratios are also fairly insensitive to adopting the ([Fe/H],age(Myrs)) = (-0.7,3500) Padova isochrone for the secondary population; in this case, the old population mass range would be and would change by no more than 50% for any choice of . The mass ratio estimates are summarized in Table 1.

In addition to the PDMF slope and the model mass-luminosity relation, another source of uncertainty in the mass ratio quoted above is the residual contamination by field stars to the counts in the SGB region. Previous experiments with the field star subtraction (see §2.1) methods have led to variations of up to in the resulting value of . If we assume this to be the uncertainty caused by field contamination, a similar relative error is expected to propagate into . Notice that this is a conservative reasoning, since residual contamination by field LMC stars should also affect the younger population. We should also point out that this uncertainty is larger than the Poisson fluctuation expected for the counts.
| isochrone | SGB mass range (solar) | ||
|---|---|---|---|
| 1.36/1.49 | 2.35 | 0.06 | |
| 1.36/1.49 | 1.50 | 0.08 | |
| 1.36/1.49 | 3.20 | 0.05 | |
| 1.22/1.29 | 2.35 | 0.09 | |
| 1.22/1.29 | 1.50 | 0.12 | |
| 1.22/1.29 | 3.20 | 0.06 |

An important question is how the stars in this candidate secondary population are distributed throughout the cluster. Differences in spatial distribution between the two populations could indicate a recent merger, in which the two systems have not yet attained dynamical equilibrium. Figure 5 shows the projected distribution of the stars located at the second turn-off; they are the same 13 stars used in estimating the ratio earlier in this section. The 11 more evolved stars along the SBG were left out of Figure 5 because they represent just a statistical excess relative to field counts; hence, they are not necessarily true members of the older population. The contours represent circles around the cluster centre and the attached labels show the percentage of all cluster stars located inside them. We note that, within the fluctuations expected by the small numbers, the projected distribution of these stars is consistent with that of the entire cluster.
5 Alternative interpretations
We have so far been interpreting the CMD feature at and as a second MSTO associated with NGC 1868. In this section we discuss other possible interpretations.
5.1 Is it a population associated with the LMC field?
One obvious alternative is that the feature in the NGC 1868 CMD is in fact a MSTO, but associated with stars belonging to the general LMC field population rather than to the cluster itself. Notice however that this is unlikely, since most contaminating field stars have been statistically removed from the on-cluster CMD. Furthermore, Figure 5 shows that the stars located at the position of the second turn-off are concentrated towards the cluster centre, a strong evidence in favour of a cluster origin for them. On the other hand, the star formation history in the LMC is known to be complex, especially in the last few Gyrs, when the bar was formed (Gallagher et al 1996, Elson et al 1997, Smecker-Hane et al 2002). Thus, small scale variations in the field CMDs are possible, making field subtraction more uncertain.
One way to investigate possible MSTOs in field populations is to search for similar features in the 7 CMDs of field stars studied by Castro et al (2001). These are fields located 7.3’ from the target clusters of the GO7307 HST project. In fact, Castro et al have visually identified possible turn-offs, with ages in the range Gyrs, in several of these fields. In addition to those, turn-offs associated with an old ( Gyrs) population were found in all field CMDs. In some cases, visual inspection of the CMDs revealed a broadening in the MS for , indicative of continuous star formation in the LMC.
In order to quantify these visual impressions we tried to identify features in the field CMDs containing stars that are highly detached from the MS line, similar to the presumed NGC 1868 MSTO. One obvious such locus is the SGB/RGB region, which is always present in the CMDs of field LMC stars. It thus has to be eliminated from the analysis a priori. We must also avoid contamination from background galaxies and faint stars belonging to the Galaxy. Unresolved galaxies should be limited to faint magnitudes, , as brighter ones are visibly extended in our WFPC2 images. From counts of faint compact galaxies, one expects contaminating galaxies within the range in our on-cluster field (Abraham et al 1996). As for foreground stars, a similar number is expected in the entire observed CMD (Santiago et al 1996). Together both types of contaminating sources contribute with a few percent of the total sample and will be spread out in the CMD.
We therefore proceeded as follows. For each field a fiducial line representing the CMD MS was defined in the same way as described in §3. A low-order polynomial was fit to the MS fiducial line of most fields in order to smooth out the wiggles caused by noise in the median value at each bin. For NGC 1805 and NGC 1818, which have much larger numbers of MS stars than the other fields, especially at the bright end (), the raw MS line was used. Evolved stars, possible background galaxies and faint stars belonging to the Galaxy were then eliminated by cutting out all CMD objects beyond from the MS line, where is the empirically determined standard deviation in the colour distribution at each magnitude. For the remaining stars, we computed the number of standard deviations by which each star is detached from the MS fiducial line, .
In Figure 6, we show the stars whose values fall at the 95% position or beyond in each LMC field. The number of stars in each panel varies from 30 to 130. These stars would be (and ) events of a Gaussian error distribution in colour. The MS fiducial line and the lines are also shown for guidance. Assuming that the photometric uncertainties have been adequately measured over the entire range and that these stars just reflect the high tail of the error distribution, we would expect them to follow the distribution of MS stars. Therefore, the shape of the distribution of such stars may reveal features that are not accounted for by errors alone. As an example, a clumped distribution of such stars at some magnitude range, as compared to the smooth distribution of MS stars, would indicate the existence of features such as a MSTO.


There is a common pattern in the distribution of these 5% reddest stars in the 7 LMC fields. In all cases, the majority of them are within the range . This can be also seen by the frequency distribution of these stars as a function of , which is shown in Figure 7. In all fields, large stars show a distinct peak in their magnitude histogram when compared to the distribution of normal MS stars. This peak is usually broad and covers the range mentioned above. Examples are the fields close to NGC 1805, NGC 1818 and NGC 1868. NGC 1805 and NGC 1818 are close to star formation regions and their neighbouring field includes stars of different magnitudes (masses) leaving the MS towards the RGB. As for the field close to NGC 1868, a 2 Gyr MSTO is seen in its CMD (Castro et al 2001), contributing with stars brighter than .
In some cases, on the other hand, high field stars show a narrow and very tall peak. This is the case of the field stars in the neighbourhood of NGC 1831, which display a distinct peak at ; this is consistent with the position of the turn-off identified in this field by Castro et al (2001). Other examples of high peaks in the distribution of detached field stars include the fields close to Hodge 14 and NGC 2209. These peaks are at least mag fainter than that of NGC 1831 and are close to the basis of the SGB of the old LMC field populations. Inspection of the stars contributing to these peaks in fact confirms that they are dominated by SGB stars which were not successfully removed using the colour cut-off.
Figures 8 and 9 show, respectively, the CMD and histogram for the stars in the on-cluster, background cleaned NGC 1868 data whose values are at the 95% position or beyond. These figures follow the same conventions as Figures 6 and 7. A total of 201 stars contribute to Figures 8 and 9. The larger number of stars allowed a magnitude binning in Figure 9 narrower than in Figure 7. Notice that the on-cluster histogram of high stars as a function of magnitude now shows a large and narrow peak at a bright magnitude, , which is close to the dominant NGC 1868 MSTO. A second peak is seen in the range , similar to those found in the field CMDs. This latter peak is well centered where the candidate secondary MSTO was found. Apart from the bright peak, however, the distribution of high stars as a function of in the cluster data is not markedly different from those of field stars.
Thus, we conclude that a field origin for the second turn-off in NGC 1868 may not be ruled out. However, the differences in shape between this feature and those known to be associated with field LMC stars, plus the fact that the NGC 1868 CMD had previously been removed of field stars, argue against this interpretation. Furthermore, the suspected secondary turn-off in NGC 1868 is detached enough from the MS that the two reddest stars contributing to it actually are located beyond the line shown in Figure 8 (see Figure 2), and therefore do not contribute to the histogram in Figure 9.
5.2 Selective unresolved binarism and Am stars
As mentioned in §3, there are other causes, besides a MS turn-off, that could lead to a set of stars being significantly detached from the MS towards redder colours.
Unresolved binarism is one such possibility. The presence of a secondary star, whose flux is added to the primary, will shift the position of the system towards brighter magnitudes in a CMD, relative to the position of the primary. If both are MS stars, the secondary will be redder, thus also affecting the colour of the system. Unresolved binaries are certainly present in any CMD and should be distributed all over the MS and among evolved stars. Their main effect is to make the MS broader with a red tail in the colour distribution. The feature seen in Figures 1 and 2, at , could be explained only if there is a specific increase in the fraction of cluster binaries at an absolute magnitude .
The apparent second MSTO occurs at the luminosity typical of peculiar A stars (Ap, Am, etc). Due to their chemical anomalies, Am stars in particular tend to be redder than normal A stars by about 0.05 mag as a result of increased line blanketing. This effect alone is too small to account for the feature in question but certainly goes in the right direction. As many Am stars are also known to be binaries (Carquillat et al 2001, Debernardi et al 2001), a combination of blanketing and enhanced binarism might accommodate the observed feature in the CMD of NGC 1868. However, more stringent constraints on the frequency of Am stars and on their binary fraction must be placed in order to test this possibility. Another problem with this interpretation is that global binary fraction estimates tend to be smaller in rich clusters than in the general field (Mayor et al 1996, Coté et al 1996, Elson et al 1998).
5.3 The Böhm-Vitense gap
The onset of a convective envelope is known to occur for MS stars of spectral type A or later. This change in energy transport is expected to occur abruptly for stars with , or (Böhm-Vitense 1958). As a result, stars cooler than this critical effective temperature would become redder than the slightly hotter ones with fully radiative envelopes (Böhm-Vitense 1970). The resulting discontinuity in the CMD is the so-called Böhm-Vitense gap and is thought to have an amplitude of . Recent surveys combining precise photometry and distance measurements from astrometry have shown that a gap does exist and is located not too far from where expected by theory. But the evidence is often weak or subject to selection effects. Newberg & Yanny (1998) studied bright and nearby field stars with available photometry plus distances from Hipparcos and found a gap at in the CMD of field stars of luminosity class V only. In other words, the gap is masked out by evolved stars contaminating the apparent MS in their CMD. Rachford & Caterna (2000) detected a gap at in most nearby open clusters they studied, but they argue that this gap may be unrelated to the onset of envelope convection.
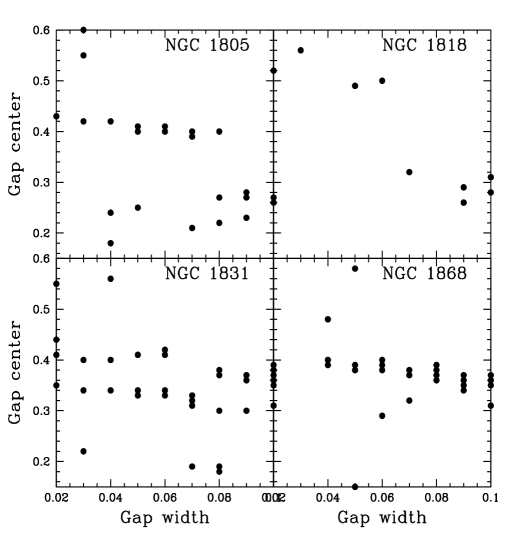
We have carried out the same gap detection analysis as Rachford & Caterna (2000). We computed values as defined by those authors for gap candidates within the colour range and with widths varying from 0.02 to 0.10 mag. Figure 10 shows the frequency distribution, not only for NGC 1868, but also for 3 other rich LMC clusters in our sample, each one with more than 5000 stars in their CMD (Santiago et al 2001). The clusters are paired according to age, NGC 1805 and NGC 1818 being younger ( yrs, Johnson et al 2001) than NGC 1831 and NGC 1868. The colour distributions for the older clusters is slightly flatter than those for the younger ones. Apparent gaps are seen at (in all cases) and at (except NGC 1831). A broader gap is also present at in NGC 1805 and NGC 1818 and possibly in NGC 1831 and NGC 1868.
Figure 11 shows the gap center plotted against gap width for all our gap candidates with confidence (). Each panel corresponds to one of the 4 rich clusters discussed. The gaps at are significant in all clusters except NGC 1818. At , only narrow and fairly unconspicuous gaps are confirmed. The bluer gap, at , takes different widths and positions, being more significant in NGC 1805 and NGC 1831. Hence, the main feature, clearly present in 3 rich clusters, is the gap at . Notice that this colour coincides closely with that of the candidate MSTO, adding support to the statistical reality of this CMD feature. These gap limits correspond approximately to , which is close to the expected position of the Böhm-Vitense gap and somewhat displaced from the gap position favoured by Rachford & Caterna (2000).
The presence of colour gaps in most of our rich LMC clusters calls for a more common mechanism than merger events. Our gap detection results, therefore, favour the possibility that the Böhm-Vitense gap was detected for the first time in LMC clusters. On the other hand, our gap colour is inconsistent with the one found by de Bruijne et al (2000, 2001) in their very accurate Hyades data. In fact, the very narrow CMDs by these authors provide the strongest limits on the gap position and associated colour discontinuity, which seems to be of . This is significantly smaller than the colour difference between MS stars and the secondary MSTO found in our NGC 1868 data.
6 Conclusions
In this paper we have shown possible evidence for a second main sequence turn-off in a deep WFPC2/HST colour-magnitude diagram of NGC 1868. This feature is clearly visible in the cluster CMD, at and , especially after contaminating field stars are removed. The presence of these stars, as well as of a residual SGB/RGB brighter than , is evidence for a secondary cluster population. In fact, previous ground-based data also show a hint of this feature: the distribution of stars seen redwards of the main-sequence in the NGC 1868 CMD by Corsi et al. (1994), despite the large scatter, has an excess of stars at the same position.
Assuming that the feature is really a MSTO associated with NGC 1868, isochrone fits yield an age of and a metallicity of for this subpopulation. Using star counts in CMD regions where we expect only one cluster subpopulation to be present, we estimate the mass ratio of the older subpopulation relative to the younger to be in the range . This range of values incorporates uncertainties in mass function slope, in age and metallicity of the secondary population, as well as uncertainties in the statistical removal of contaminating field LMC stars.
Even though the candidate second turn-off remains untouched after field stars are statistically subtracted from the CMD of NGC 1868, the possibility that this feature is associated with a field star population was investigated in detail and cannot be completely ruled out. CMDs of field stars from several different positions in the LMC show an excess of stars located in loci close to that of the NGC 1868 candidate turn-off. This excess is measured relative to the expected number of stars scattered to these loci due to photometric errors. Most of the features in the field CMDs, however, are broad and visually less conspicuous than the apparent secondary turn-off in NGC 1868, thus being more consistent with periods of enhanced field star formation lasting for longer than . Another argument against a field origin for the candidate second turn-off is that its stars are concentrated towards the cluster centre.
Other possible explanations for the CMD feature have been explored. They include CMD spread due to unresolved binaries, which could mimic a MS turn-off if binarism is enhanced within a narrow range of primary star masses. It is interesting to notice that the mass range in question is close to that of Am stars, which are redder than normal A stars and for which a larger than usual binary fraction may exist. Estimates of binary fraction within globular clusters, however, yield smaller values than in the field. Besides, the binary fraction among Am stars is not yet well constrained. It is thus unlikely that the CMD feature discussed here is due to Am stars or unresolved binaries.
A final and exciting alternative would be that the Böhm-Vitense gap was for the first time detected in a stellar population outside the Galaxy. The fact that gaps were found in the colour distribution of two other LMC clusters besides NGC 1868, all of them at (), calls for a more common mechanism than mergers. In fact, a merger of the type suggested by the presence of a second and much fainter MSTO as discussed in this paper should be rare (Vallenari et al 1998, Dieball & Grebel 2000). Most model predictions favour merging units that are nearly coeval and usually formed through encounters within the same giant molecular cloud, either before or after they are fully formed clusters (Fujimoto & Kumai 1997, Efremov & Elmegreen 1998, Leon et al 1999).
On the other hand, it is unclear to what extent the Böhm-Vitense gap may mimic a main sequence turn-off. The recent and precise CMD data on the Hyades by de Bruijne et al (2000, 2001) do not reveal strong turn-off like features associated with the Böhm-Vitense gap candidates found by those authors; the colour discontinuity in their CMD is of smaller amplitude than necessary to account for the NGC 1868 feature studied here. Besides, the gap associated with our NGC 1868 CMD feature is bluer than the gaps found by de Bruijne et al.
We should point out that the nature of the stars that make up the candidate MSTO in NGC 1868, which currently is uncertain and accountable for by at least two astrophysically interesting alternatives (merging and Böhm-Vitense gap), may be established by spectroscopic classification, a task likely to demand large, 8m class, telescopes.
Acknowledgments
We thank Gerry Gilmore, Steinn Sigurdsson, Horacio Dottori and Eduardo Bica for useful discussions. This work was partially supported by CNPq and PRONEX/FINEP 76.97.1003.00.
References
- [1] Abraham R., Tanvir N., Santiago B., Ellis R., Glazebrook K., van den Bergh S., 1996, MNRAS, 279, L47
- [2] Banks T., Dodd R., Sullivan D., 1995, MNRAS, 274, 1225
- [3] Bhatia R., Piotto G., 1994, A&A, 283, 424
- [4] Bica E. & Alloin D., 1986, A&A, 162, 21
- [5] Böhm-Vitense E., 1958, Zeit. Astrophys., 46, 108
- [6] Böhm-Vitense E., 1970, A&A, 8, 283
- [7] Carquillat J.-M., Ginestet N., Prieur J.-L., 2001, A&A, 369, 908
- [8] Castro R., Santiago B., Gilmore G., Beaulieu S., Johnson R., 2001, MNRAS, 326, 333
- [9] Chiosi C., Bertelli G., Bressan A., Nasi E., 1986, A&A, 165, 84
- [10] Corsi C., Buonanno R., Fusi-Pecci F., Ferraro F., Testa V., Greggio L., 1994, MNRAS, 271, 385
- [11] Coté P., Fischer P., Pryor C., Welch D., 1996, in The Origins, Evolution and Destinies of Binary Stars in Clusters, ASP Conf. Ser., vol. 90, eds E.F. Milone & J.-C. Mermilliod, San Francisco, p. 222
- [12] Debernardi Y., Mermilliod J., Carquillat J.-M., Ginestet N., 2000, A&A, 354, 881
- [13] de Bruijne J., Hoogerwerf R., de Zeeuw P., 2000, ApJ Letters, 544, L65
- [14] de Bruijne J., Hoogerwerf R., de Zeeuw P., 2001, A&A, 367, 111
- [15] Fujimoto M., Kumai Y., 1997, AJ, 113, 249
- [16] de Grijs R., Johnson R., Gilmore G., Frayn C., 2002a, MNRAS, in press
- [17] de Grijs R., Gilmore G., Johnson R., Mackey A., 2002b, MNRAS, in press
- [18] de Oliveira M., Bica E., Dottori H., 2000, MNRAS, 311, 589
- [19] Dieball A., Grebel E., 1998, AGM, 14, P71
- [20] Dieball A., Grebel E., 2000, A&A, 358, 897
- [21] Dieball A., Grebel E., Theis C., 2000, A&A, 358, 144
- [22] Efremov Y., Elmegreen B., 1998, MNRAS, 299, 588
- [23] Elson R. A. W., Gilmore G. F., Santiago B. X., 1997, MNRAS, 289, 157
- [24] Elson R., Sigurdsson S., Davies M., Hurley J., Gilmore G., 1998, MNRAS, 300, 857
- [25] Flower P., Geisler D., Hodge P., Olszewski E., 1980, ApJ, 235, 769
- [26] Girardi L., Bressan A., Bertelli G., Chiosi C., 2000, A&AS, 141, 371
- [27] Hodge P., 1983, ApJ, 264, 470
- [28] Holtzman J. A., Burrows C. J., Casertano S., Hester J. J., Trauger J. T., Watson A. M., Worthey G., 1995a, PASP, 107, 1065
- [29] Holtzman J. A. et al, 1995b, PASP, 107, 156
- [30] Holtzman J. A. et al, 1997, AJ, 113, 656
- [31] Johnson R.A., Beaulieu S., Gilmore G., Hurley J., Santiago B., Tanvir N., Elson R., 2001, MNRAS, 324, 367
- [32] Kontizas E., Kontizas M., Michalitsianos A., 1993, 1993, A&A, 267, 59
- [33] Kerber L., Santiago B., Castro R., Vall-Gabaud D., 2002, A&A, submitted
- [34] Lee M., 1992, ApJ Letters, 399, L133
- [35] Leon S., Bergond G., Vallenari A., 1999, A&A, 344, 450
- [36] Mayor M., Duquennoy A., Udry S., 1996, in The Origins, Evolution and Destinies of Binary Stars in Clusters, ASP Conf. Ser., vol. 90, eds E.F. Milone & J.-C. Mermilliod, San Francisco, p. 190
- [37] Newberg H., Yanny B., 1998, ApJ, 499, L57
- [38] Olszewski E., Schommer R., Suntzeff N., Harris H., 1991, AJ, 101, 515
- [39] Panagia N., Gilmozzi R., Macchetto F., Adorf H.-M., Kirshner R. P., 1991, ApJ, 380, L23
- [40] Rachford B., Canterna R., 2000, AJ, 119, 1296
- [41] Sagar R., Richtler T., de Boer K., 1991, A&A, 249, L5
- [42] Santiago B., Gilmore G., Elson R., 1996, MNRAS, 281, 871
- [43] Santiago B., Beaulieu S., Johnson R.A., Gilmore G., 2001, A&A, 369, 74
- [44] Smecker-Hane T., Cole A., Gallagher III J., Stetson P., 2002, ApJ, 566, 239
- [45] Vallenari A., Bettoni D., Chiosi C., 1998, A&A, 331, 506.