On the Determination of the Mean Cosmic Matter Density and the Amplitude of Density Fluctuations
Abstract
The cosmological implications from a new estimate of the local X-ray galaxy cluster abundance are summarized. The results are then compared to independent observations. It is suggested that ‘low’ values for the mean cosmic matter density and the amplitude of mass density fluctuations currently do not appear unreasonable observationally.
Department of Astronomy, University of Virginia, PO Box 3818, Charlottesville, VA 22903-0818, USA; thomas@reiprich.net
1. Constraints from the HIFLUGCS Mass Function
A new X-ray selected and X-ray flux-limited galaxy cluster sample has been constructed (HIFLUGCS, the HIghest X-ray FLUx Galaxy Cluster Sample, Reiprich & Böhringer 2002). Based on the ROSAT All-Sky Survey the 63 brightest clusters with galactic latitude deg and flux have been compiled. Gravitational masses have been determined utilizing intracluster gas density profiles, derived mainly from ROSAT PSPC pointed observations, and gas temperatures, as published mainly from ASCA observations, assuming hydrostatic equilibrium. This sample and an extended sample of 106 galaxy clusters has been used to establish the X-ray luminosity–gravitational mass relation.
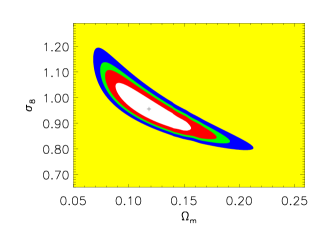
From the complete sample and the individually determined masses the galaxy cluster mass function has been determined and used to constrain the mean cosmic matter density and the amplitude of mass density fluctuations. Comparison to Press–Schechter type model mass functions in the framework of cold dark matter cosmological models and a Harrison-Zeldovich initial density fluctuation spectrum yields the constraints and (90% c.l.). The degeneracy between and previously encountered for local cluster samples therefore has been broken mainly due to the large covered mass range (Fig. 1; see section 5.3.2 in Reiprich & Böhringer 2002 for more details). Various possible systematic uncertainties have been quantified. Adding all identified systematic uncertainties to the statistical uncertainty in a worst case fashion results in an upper limit . For comparison to previous results a relation has been derived.
Two further constraints on obtained from the HIFLUGCS clusters agree well with the above results. The mean intracluster gas fraction combined with independent estimates of the baryon density yields the upper limit . Calculation of the median mass-to-light ratio for 18 clusters in common to the sample of Girardi et al. (2000) combined with estimates of the total luminosity density in the Universe yields (Reiprich 2001).
The mass function has been integrated to show that the contribution of mass bound within virialized cluster regions to the total matter density is small; i.e., for cluster masses larger than . If light traces mass this also implies that most galaxies sit outside clusters.

2. Comparison to Independent Observations
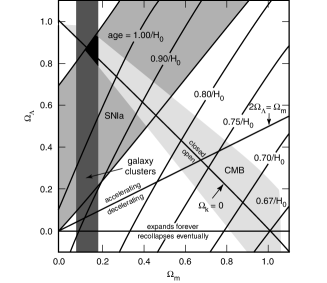

The constraints from Sect. 1 are compared to independent constraints in Fig. 2. Shown are (95%) confidence contours from measurements of distant type Ia supernovae and temperature fluctuations in the cosmic microwave background. These confidence contours overlap with the 90% statistical uncertainty region from the mass function and the overall region of consistency indicates that the expansion of the (apparently flat) Universe is currently accelerating.
Also shown are – relations as determined from cluster abundance measurements compiled from the examples given in Reiprich & Böhringer (2002) plus three more recent estimates from Seljak (2002), Viana et al. (2002), and Bahcall et al. (2002), as well as the ‘COBE normalization’. The various inherent differences of the individual analyses which affect the shape of these lines, e.g., the value of the primordial power spectral index, , and the calculation of the transfer function, will be ignored in the following discussion. Note also that several other methods exist to estimate . A discussion of them is not possible here but it appears fair to state that the range of other estimates of is similar to the range of the cluster results shown here, at least for the relevant range.
The four lowest cluster normalizations (all published in 2002) do not fit the higher ‘canonical cluster normalization’ and recently the categorization ‘low’ and ‘high’ cluster normalization appears to have been adopted. If the low cluster normalization turns out to be close to the ‘true’ value and the Universe is flat then comparison to the COBE results indicates a low value for (0.20–0.25). Should independent measurements fix to a value very close to the ‘bandwagon’ (J.P. Henry) value 0.3 then this could be an exciting indication for the presence of inflationary gravitational waves biasing upwards the COBE normalization.
Attention on the reasons for the discrepant cluster results has been focussed mainly on different normalizations of cluster mass–X-ray temperature relations. However, this is only one source of uncertainty as is immediately obvious by noting that, e.g., several determinations relied entirely on optical data (i.e., optically selected cluster samples and masses estimated from cluster richness or galaxy velocity dispersion). Other sources of uncertainty include the following. The different cluster samples vary in the covered volume size and are therefore affected by cosmic variance in different ways. Slight systematic differences between optical and X-ray cluster selection and mass estimates exist as discussed, e.g., in Reiprich (2001) and Reiprich & Böhringer (2002). Different methods to determine an overall cluster X-ray temperature yield systematically different results. It is not clear whether the slope of the mass–temperature relation is correctly described by over the entire mass range. The treatment of observed scatter in relations varies. Different samples may contain different fractions of clusters undergoing a major merger. Optical and X-ray mass estimates of merging clusters tend to overestimate their mass and may therefore lead to overestimates of (e.g., Randall et al. 2002).
Nevertheless the uncertainty in the normalization of the – relation is undoubtedly important. Currently the following situation exists. Despite the fact that combined -body/hydrodynamic simulations show that the method to estimate gravitational cluster masses from X-ray data (hydrostatic assumption plus model) yields accurate and unbiased results at least out to the radius within which the mean mass density equals 500 times the critical density apart from major mergers (e.g., Schindler 1996; Evrard et al. 1996), – relations estimated from simulations and observations disagree (but see the recent simulations by Thomas et al. 2002). This disagreement needs to be solved.

There are several possible ways how one may obtain the ‘correct’ normalization of the – relation. The most direct way appears to be to study in more detail simulations and observations. From the simulation side one may test the effect of additional physics and from the observational side clearly better spatially and spectrally resolved X-ray observations are needed. We are currently in the most fortunate situation to have two great X-ray observatories in space, XMM-Newton and Chandra, that complement each other in the sense that they allow to study the pressure structure in the outer cluster parts as well as in the very centers of clusters in unprecedented detail. Observations of a reasonably sized cluster sample and systematic comparison to mass estimates based on weak lensing and galaxy velocity dispersions will allow to tighten the constraints on the – relation significantly. Moreover such observations at hand for a complete sample, like HIFLUGCS, one does not have to resort to using a relation between temperature and mass but one can use the determined masses directly for the construction of the mass function. Taking into account the additional information on the gas density structure alleviates some of the other systematic uncertainties discussed above. It is obvious that such observations are a necessary step to ascertain that galaxy clusters remain competitive cosmological probes needed for cross checks of systematic uncertainties inherent to all measurements, to help break parameter degeneracies, e.g., for the equation of state parameter, , and to finally arrive at a detailed refined theory of structure formation.
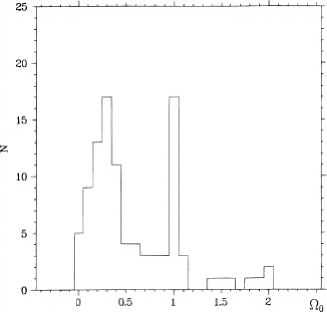
Let’s return to discuss presently available constraints. In Fig. 3 the distribution of a subset of published estimates is shown in order to get a very rough overview of the observationally favored values. The left hand side shows a compilation by Schuecker et al. (1998) and the right hand side shows all published values that fufill the following criteria. Only publications returned by a query of the Astrophysics Data System (ADS) with “‘omega;m” AND constraint’ in the abstract and within the date range ‘01-1997–06-2002’ have been included. Out of the 156 retrieved publications only abstracts have been checked for constraints on . Multiple occurences of the same data (e.g., as AAS abstracts) as well as upper limits on have been excluded. If there was a choice values for a flat Universe and have been used. If only an uncertainty range was given the mean value has been used. It is quite obvious that this procedure excludes a large fraction of published estimates on and certainly may be biased. Also error bars have been entirely neglected. Still the resulting distribution might be useful to get a feeling for the general trend.
A comparison of both histograms indicates that is less favored nowadays than it used to be. Furthermore the mean value of the estimates today appears to be lower than previously and especially values very close to seem to be strongly supported. The best fit value found from the HIFLUGCS mass function is therefore on the low side of the current estimates, as expected from the left hand side of Fig. 2. However, when plotting the estimates compiled here as a function of time (Fig. 4) there appears to be a vague hint that the apparent decrease of the mean might continue to the current date. Assuming boldly that improved accuracy is positively correlated with publication date a ‘true’ low value does currently not appear entirely unreasonable.


The evolution of cluster abundances is given by the graph on the right hand side of Fig. 4 where the estimates from Fig. 2 are plotted for a fiducial value as a function of publication date (results not yet published in a journal have been assigned the date 06-2002). Here one can make out an indication of decreasing estimates with time and a cluster normalization substantially lower than previously thought might be suggested (for the specific fiducial choice ; for a value close to one for may be recovered). However, it cannot be stressed enough that the simple minded plots shown in this section might be completely misleading and should not be taken too seriously. By the time these conference proceedings get published hopefully first results from MAP and especially their combination with independent estimates will have narrowed down the range of reasonable parameter values.
Acknowledgments.
The code for calculation of the Bunn & White normalization has been provided by T. Kitayama. T.H.R. thanks the Celerity Foundation for support. T.H.R. was also supported by NASA XMM-Newton Grant NAG5-10075. For more infos on HIFLUGCS visit http://www.reiprich.net .
References
Bahcall, N. A., et al. 2002, ApJ, submitted (astro-ph/0205490)
Bunn, E. F. & White, M. 1997, ApJ, 480, 6
de Bernardis, P., et al. 2000, Nat, 404, 955
Evrard, A. E., et al. 1996, ApJ, 469, 494
Girardi, M., et al. 2000, ApJ, 530, 62
Perlmutter, S., et al. 1999, ApJ, 517, 565
Randall, S. W., et al. 2002, ApJ, accepted (astro-ph/0206161)
Reiprich, T. H. 2001, Ph.D. thesis, Ludwig-Maximilians-Universität München
Reiprich, T. H. & Böhringer, H. 2002, ApJ, 567, 716
Schindler, S. 1996, A&A, 305, 756
Schuecker, P., et al. 1998, ApJ, 496, 635
Seljak, U. 2002, MNRAS, submitted (astro-ph/0111362)
Thomas, P. A., et al. 2002, MNRAS, 330, L48
Viana, P. T. P., et al. 2002, ApJ, 569, L75