Peculiar Chemical Abundances in the Starburst Galaxy
M82
and Hypernova Nucleosynthesis
Abstract
X-ray observations have shown that the chemical abundance in the starburst galaxy M82 is quite rich in Si and S compared with oxygen. Such an abundance pattern cannot be explained with any combination of conventional Type I and II supernova yields. Also the energy to heavy element mass ratio of the observed hot plasma is much higher than the value resulted from normal supernovae. We calculate explosive nucleosynthesis in core-collapse hypernovae and show that the abundance pattern and the large ratio between the energy and the heavy element mass can be explained with the hypernova nucleosynthesis. Such hypernova explosions are expected to occur for stars more massive than , and likely dominating the starburst, because the age after the starburst in M82 is estimated to be as short as yr. We also investigate pair-instability supernovae () and conclude that the energy to heavy element mass ratio in these supernovae is too small to explain the observation.
1 Introduction
M82 is the most active nearby starburst galaxy. Recently several exciting discoveries have been made for M82. X-ray observations have revealed the presence of intermediate mass black holes with masses M⊙ in M82 (Matsumoto et al. 2001; Kaaret et al. 2001), whose locations were found to coincide with the star clusters by SUBARU observations (Harashima et al. 2002). Also the very energetic expanding molecular super-bubble has been discovered (Matsushita et al. 2000). These findings have created lots of interest in the formation of black holes of various masses and the evolution of star burst galaxies (e.g., Ebisuzaki et al. 2001).
The critically important information for understanding the evolution of star burst galaxies is the chemical abundances. The abundance information has also been provided by X-ray observations. Tsuru et al. (1997) observed M82 with ASCA in the keV X-ray band and found that its spectrum can be fit with a three component model: a point-like hard component and extended soft-medium components. From the observed emission lines they also obtained abundances of O, Ne, Mg, Si, S and Fe, and found that the abundance pattern is peculiar: Si and S are much abundant than O and Fe compared with the solar ratio. Also the O/Fe ratio is almost solar. Tsuru et al. (1997) concluded that this abundance pattern cannot be reproduced with any combination of the previous Type Iabc and Type II supernova (SN Iabc and SN II) yields (Nomoto, Thielemann & Yokoi 1984; Woosley & Weaver 1995; Thielemann, Nomoto & Hashimoto 1996; Nomoto et al. 1997a,b). They also discussed that the energy to heavy element mass ratio of the observed hot plasma is too large to be of the supernova origin.
We should note that Tsuru et al. (1997) assumed that all stars above 8 have already exploded. However, the age of the starburst is estimated to be yr from the radio observation (Matsushita et al. 2000) and yr from the size of the X-ray halo observed with ROSAT (Strickland, Ponman & Stevens 1997). Only the very massive stars have exploded in such a short time.
Moreover, the previous SN II and SN Ibc yields adopted in Tsuru et al. (1997) were obtained only for the explosion energy of erg. Recently some massive supernovae have been found to explode much more energetically as “hypernovae” than normal SNe II (e.g., Iwamoto et al. 1998; Nomoto et al. 2001). Therefore, we need to reconsider the previous conclusions by Tsuru et al. (1997).
In this paper we re-examine whether the abundance and energetics of M82 are consistent with the supernova models taking account of the starburst age and hypernova explosions. Because of the short age, the abundance is likely to be determined mainly by relatively massive supernovae. The contributions of high energy explosions would affect the energy to the heavy element mass ratio and the abundance pattern in the galactic winds. Recently we have found that in nucleosynthesis of hypernovae, the Si and S abundances are much enhanced relative to O; and also large Fe/O ratio ([Fe/O] ) can be realized (Umeda, Nomoto & Nakamura 2000; Nakamura et al. 2001). These patterns are consistent with those observed in M82, which has motivated us to calculate detailed nucleosynthesis in massive energetic core-collapse SNe for comparison with the M82 data. We also investigate pair instability supernovae (PISNe) of stars, because PISNe also yields relatively abundant Si and S compared with O, and large amount of Fe.
2 Abundance Pattern
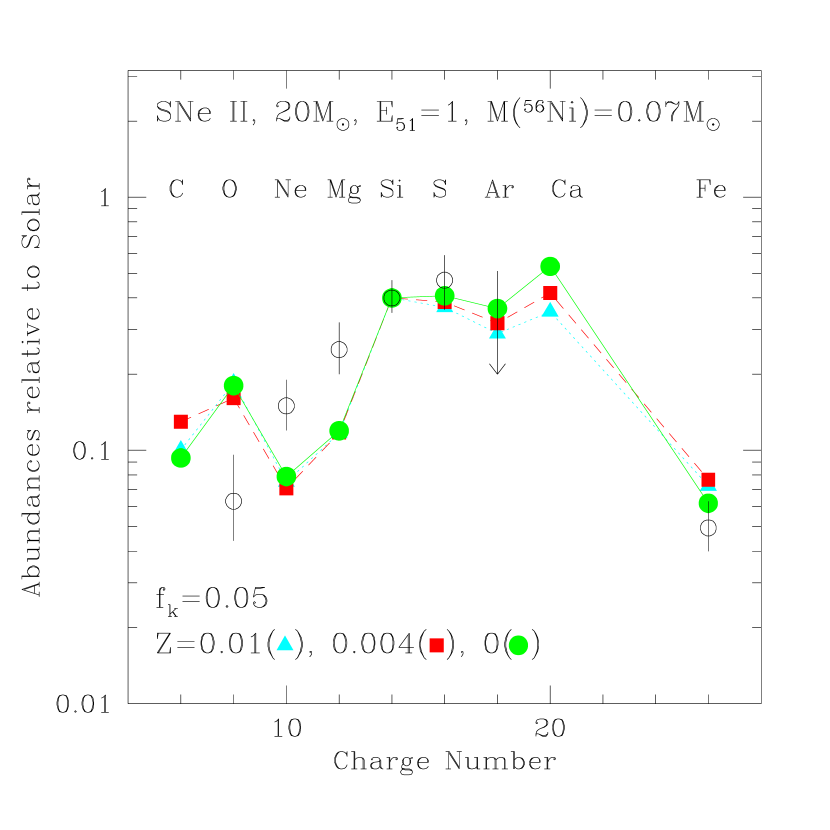
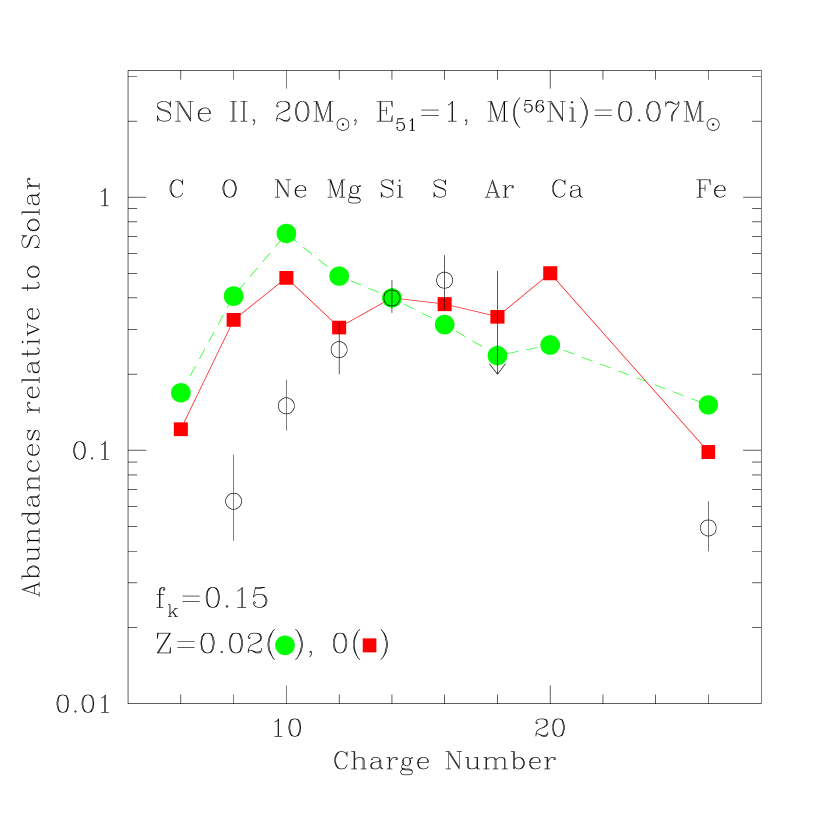
The heavy element abundances in M82 observed with ASCA (Tsuru et al. 1997) are shown in Figure 1 by open circles with error bars. For Ar, only the upper limit is given. Here, the heavy element abundances are defined by the mass fractions of elements with respect to light elements (mostly hydrogen and helium). The data are normalized to the solar ratios (Anders & Grevesse 1989). We note two features of the observational data. One is the overabundances of Si and S relative to O with respect to the solar ratio, i.e., [Si,S/O] . Here, [X/Y] log(X/Y) log (X/Y) ⊙. Second is such low abundances of O and Fe as [O/H] [Fe/H] 1.2.
Since these abundances were derived by fitting the ASCA spectra with the two-temperature plasma model for the hot gas in M82, one might argue that these features are an artifact due to the too simple model assumption. Therefore, we fitted the ASCA spectrum with a multi-temperature plasma model in which an emission measure of each temperature component follows a power-law in temperature (i.e., the emission measure from the temperature is proportional to , where and are free parameters). We obtained and keV as the best-fit results, and the best-fit abundances are quite similar to those of the two-temperature model fitting. We thus conclude that the above two features are not the artifact.
To compare with the observed abundance pattern of M82, we calculate nucleosynthesis in the SN II explosions of 20 stars for various energies and metallicities. (More details on our massive star evolution, explosion simulation and nucleosynthesis calculations are given in Umeda et al. 2000 and Umeda & Nomoto 2002). Since [Fe/H] , it is better to use low metal star models to compare with the M82 abundances.
2.1 Normal Type II Supernovae
First, let us compare the abundance pattern of M82 with the normal SN II models for which the explosion energy is assumed to be erg = 1. This is the typical energy for SNe II as estimated from SNe 1987A, 1993J, and 1994I (e.g., Shigeyama & Nomoto 1990; Blinnikov et al. 2000; Nomoto et al. 1993, 1994). The ejected mass of Fe (mostly 56Fe produced by the 56Ni decay, and some 54Fe and 57Fe) depends on the uncertain “mass-cut”, but here we assume that the ejected 56Ni mass is 0.07 as estimated for the above SNe. The mass-cut depends on the progenitor mass and the explosion energy.
In Table 1, we summarize the ejected masses of selected elements for a various set of metallicity and the mass of SN II models with . The abundances in the ejecta depend on the convective efficiency and the 12C(O rate adopted for the stellar evolution models as shown in Table 1. Here, the parameter is proportional to the diffusion coefficient of convective mixing (Spruit 1992; Umeda et al. 1999). In Figure 1, we plot the abundances of these 20 SNe II models for various metallicities. The left and right panels show the cases with relatively slow and fast convective mixing (=0.05 and 0.15), respectively. The overall abundances are normalized to the observed Si abundance. In this section, we can compare only the theoretical and observed abundance ratios. The overall normalization is constrained by the energy to heavy element mass ratios discussed in the section 3.
From Figure 1, we find that these models are all have much smaller Si/O ratios than the M82 data. The Si/O ratios are larger for than but still smaller than the observation by a factor of 4. For other models in Table 1, we find that [Si/O] , being much smaller than the observation in all models. Generally, more massive core-collapse SNe () yield smaller Si/O ratios because the O yield increases more rapidly with increasing mass than the Si yield. Therefore, the Si/O ratio is likely to be largest for the smallest mass SN II. However, as shown in Table 1, the Si/O ratios for the 13 SN II models are not large enough to be consistent with the M82 data. Contribution of even smaller mass SNe II would be negligible unless the Initial Mass Function was extremely steep. Stars with explode as PISNe, and the nucleosynthesis pattern may be different. These cases are discussed in Section 4. This result is quite general, being consistent with our previous and other groups’ results. We also note that the Si/O ratio is insensitive to the 12C(O rate (Nomoto et al. 1997a).
It is interesting to note that, the abundance ratios for these even Z elements are insensitive to the metallicity (Figure 1). This is because the synthesis of these elements are mostly governed by the - nuclei reactions, which are almost independent of metallicity (Umeda et al. 2000). From this reason, in the rest of this paper, we use the =0 models for the progenitor and supernova models.
2.2 Hypernovae
Recent observations suggest that some massive SNe with explode more than ten times energetically than normal SNe II and SNe Ibc, which may be called “hypernovae”. The first discovery of such SNe was SN1998bw (Galama et al. 1998; Iwamoto et al. 1998). Then several other hypernovae and their candidates have been discovered, namely, SNe 1997ef, 1997cy, 1999as, and 2002ap (e.g., Nomoto et al. 2001; Mazzali et al. 2002).
Umeda et al. (2000) and Nakamura et al. (2001) have shown that the large Si/O ratio may be the signature of the energetic supernova explosions. Figure 2 compares the post-explosion abundance distribution of the hypernova and the normal SN II models. In the more energetic explosion, the outer boundary of the explosive O burning region moves outwards. The explosive O burning to produce Si, S and Ar takes place when the peak temperature after the supernova shock passage exceeds , where is the peak temperature in units of 109K. The region after the shock passage is radiation dominant, so the peak temperature is approximately related to the stellar radius and the explosion energy as , i.e., km)-3/4. For larger , therefore, the O burning region extends to larger . On the other hand, the outer edge of the O-rich region is fixed at the C+O/He interface, where the density is too low for explosive burning. This is why the Si/O ratio is enhanced for more energetic explosions.
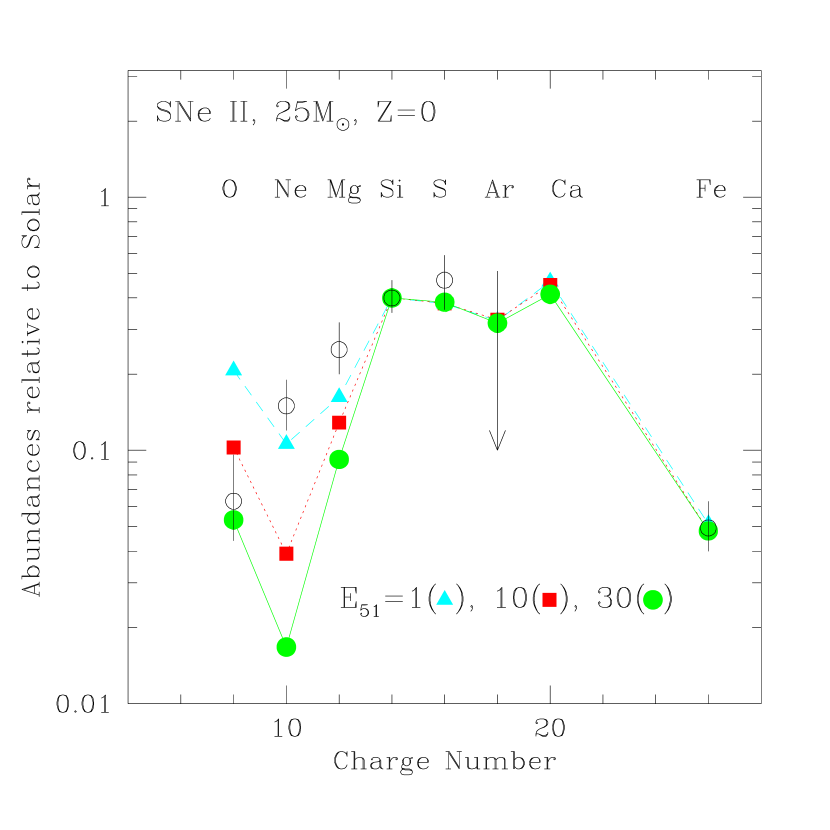
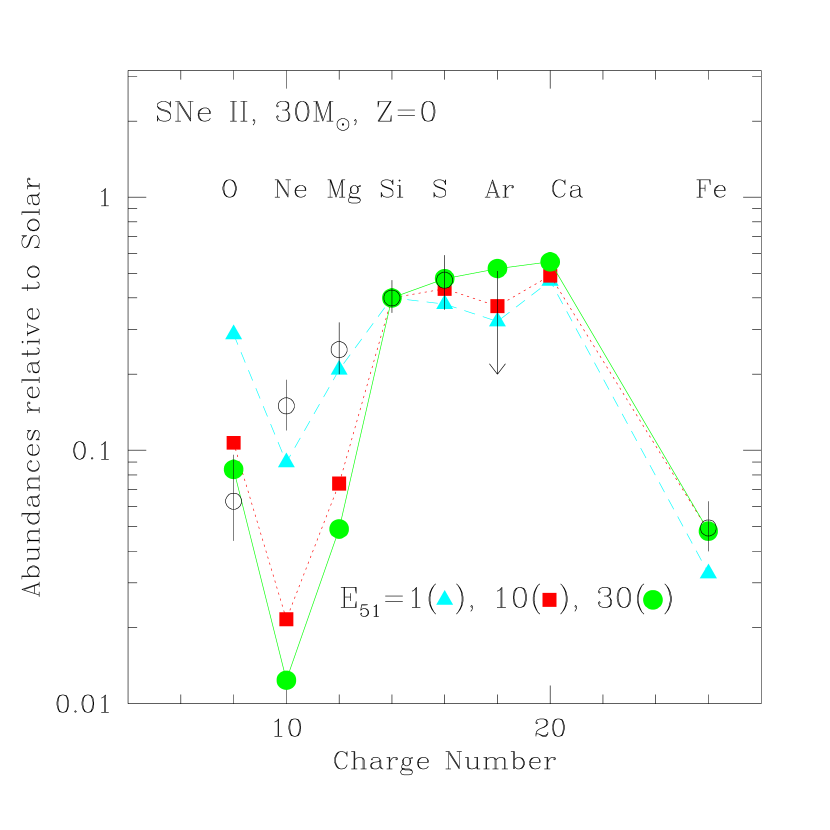
Figure 3 shows the nucleosynthesis pattern of the 25 (=0, ) models for various explosion energies, =1, 10 and 30. Here the abundances are normalized to the observed Si abundance and the mass-cuts (i.e., the compact remnants’ masses) are chosen to eject the Fe mass to fit the data point. Thus the ejected Fe masses are 0.07, 0.095 and 0.12 , for =1, 10 and 30, respectively. The mass-cuts for these models are 2.3, 3.1 and 4.0 , respectively. Table 2 summarize the ejected masses of O, Ne, Mg, Si, S and Fe as a function of the explosion energy for the 25 and 30 (=0) models.
The observational and theoretical mass ratios of Si/O are compared in the top panel of Figure 4. The observed large abundance ratio of Si/O can be reproduced for 10 in the 25 models, and 30 in the 30 models. Here, the results are for the models. For the models, which is more O-rich, higher energy is required to be consistent with observations.
Similar Si/O ratios can be obtained for more massive stars if the explosion energy is sufficiently large. Therefore, more massive core-collapse hypernovae with initial masses of could also be consistent with the M82 abundance pattern, although we do not know how much fraction of these massive stars actually explode rather than collapsing to black holes without explosion.
In these results, Ne and Mg appear to be underproduced. However, the ratios (Ne, Mg)/O are sensitive to the uncertain reaction rate 12C(O and convective parameter as seen in Figure 1. Thus a better agreement with observations can be obtained by choosing appropriate parameters, which does not change the present conclusion on the Si/O ratio.
3 Energy to Heavy Element Mass Ratio
In this section, we discuss another observational constraint which theoretical models should satisfy. Suppose that the hot plasma in M82 is a mixture of the SN ejecta and the interstellar gas, and most of the thermal energy of the hot plasma was supplied by supernovae. Then we can constrain the ratio of the energy released by one supernova, , to the mass of the heavy elements as follows (Tsuru et al. 1997).
The thermal energy of the hot plasma supplied by one SN explosion can be written as
| (1) |
where and are the masses of the ejecta and the ambient gas heated by a single SN and, is the mean molecular weight. The ratio of the mass of each heavy element () to the total mass () is expressed as
| (2) |
where the quantities with asterisk denote the mass of each heavy element. From these equations, we obtain:
| (3) |
where is the ejected mass in units of of each heavy element synthesized by the SN. For a given heavy element mass in the ejecta, this inequality determines the minimum explosion energy required for the supernova model to be consistent with the observations.
Using this relation and the observed values of k keV) and (Tsuru et al. 1997 and references therein), the minimum energy to the heavy element mass ratios for O, Si, and Fe are given as follows:
| (4) |
| (5) |
| (6) |
The limits for other elements can also be obtained, but these three elements are sufficient for constraining .
Here, we have neglected the contribution of the stellar wind to the total energy of the hot plasmas. The energy of stellar wind from solar metallicity stars is estimated to be erg from the observation of OB associations (Abbott 1982). This is much smaller than the typical explosion energy of a normal SN II, erg. This energy is even smaller for a lower metal environment as in M82, because the wind mass-loss rate decreases with metallicity as (Leitherer, Robert & Drissen 1992). Furthermore, we are considering the energy from a hypernova with erg. Therefore, it is not a bad approximation to neglect the energy from stellar winds in the hot-plasma.
In the middle and bottom panels of Figure 4, we compare the observed ratios ( with the theoretical . For the models, the ratios for all elements are much smaller than the minimum values in Eq. (3). On the other hand, all other energetic models shown here satisfy the constraints. Therefore, the 25 models with and the 30 models with are consistent with both constraints on the Si/O abundance ratio and the energy to mass ratio. Here, we note again that these results are for the models and larger energy is required for models to be consistent with observations.
4 Pair Instability Supernovae
It has been known that the stars with also explode energetically as pair instability SNe (PISNe) (e.g., Barkat, Rakavy & Sack 1967; Fraley 1968; Ober, El Eid & Fricke 1983; Woosley & Weaver 1982). During oxygen burning the cores of these stars enter into the electron - positron pair creation region. Then the adiabatic index of these cores becomes less than 4/3 and the stars collapse rapidly. The central temperature increases during the collapse and rapid O-burning takes place to produce a large amount of thermal energy and Si. For the stars with the thermal energy produced by oxygen burning exceeds the gravitational potential energy, and the stars disrupt completely. Compared with normal SNe II, the explosion energies are larger, typically erg, and the Si abundance in the ejecta is also larger (see Table 2). During the PISN explosion a large amount of Fe () can be produced (Umeda & Nomoto 2002; Heger & Woosley 2002), although the amount of Fe production is very sensitive to the maximum temperature attained.
In Figure 5, we show the abundance distribution of the 200 PISN model. In Table 2, the ejected masses of O, Ne, Mg, Si, S and Fe are shown for the 170 and 200 Pop III PISN (Umeda & Nomoto 2002). The abundance patterns of the 170 and 200 stars are compared with the M82 data in Figure 6. It seems that the large [Si/O] ratio in M82 can be realized by PISN nucleosynthesis.
However, we also need to compare the energy to mass ratio for the PISN models. Since the amount of ejected O is least model dependent, we show the energy to the O mass ratio for the PISNe. Our models with = 170 and 200 (=0) have (O)= 22.4/44.2 = 0.51 and 26.8/56.0 = 0.48, respectively. These are much smaller than the observed lower limit of 7.9 (Eq. 4), because the ejected O mass is more than ten times larger than in the core-collapse SNe.
This ratio may be larger for more extremely massive stars. For example, in the model of Heger & Woosley (2002), their 130 He star model, corresponding to the initial stellar mass of 260, gives (O)= 87.1/29.9 = 2.9. For these models, however, the O/Fe ratios are typically too small ([O/Fe]= for the 130 He star model) to be compatible with observations.
5 Conclusions and Discussion
X-ray observations have shown that the chemical abundance in the starburst galaxy M82 is quite rich in Si and S compared with oxygen. Such an abundance pattern cannot be explained with any combination of conventional Type I and II supernova yields. Also the energy to heavy element mass ratio of the observed hot plasma is much higher than that of normal supernovae. We have calculated explosive nucleosynthesis in core-collapse hypernovae to show that the abundance pattern and the large energy of the hot plasma of M82 can be explained with such hypernovae as (, ) = (25, 10) and (30, 30). More massive and more energetic core-collapse explosions would also satisfy the observed constraints. We have also investigated pair-instability supernovae () and conclude that the energy to heavy element mass ratio in these supernovae is too small to explain the observation.
Such “hypernova” (energetic core-collapse SN) explosions are expected to occur for stars more massive than (Mazzali et al. 2002). The upper mass limit of core-collapse SNe is still uncertain. Too massive stars may collapse to black holes without explosion.
The question is how the abundance in M82 can be dominated by such hypernovae. One possible explanation is the age effect. As mentioned in Introduction, the age after the beginning of star-burst is estimated to be years. On the other hand, the lifetime of our Pop III stars are 1.40, 1.10, 0.81 and 0.70 years for 15, 20, 25 and 30 models, respectively (Umeda et al. 2000). This is consistent with the assumption that only such massive stars as have exploded in M82.
There have been some suggestions that hypernovae might be correlated with gamma-ray bursts (GRBs) (e.g., Iwamoto et al. 1998). However, how much fraction of hypernovae is associated with GRBs is still unknown. Paczynski (2001) discussed that the SN rate (including the energetic SNe) is much higher than the GRB rate. On the other hand, we have shown that in order to explain the observed abundance pattern of M82, dominant fractions of massive stars () needs to be hypernovae. This implies that hypernovae are much more frequent than GRBs. If GRBs are associated with hypernovae, it is likely that they occur only for certain special cases of hypernova explosions. For example, the explosion energy needs to exceed a certain value, the explosion needs to be extremely aspherical, i.e., the ejecta needs to be strongly beamed, and both hydrogen and helium envelopes need to be stripped off before the explosion. In fact, GRB980425 associate with SN1998bw is the exceptionally weak GRB (Galama et al. 1998), while SN1998bw is among the most energetic hypernovae so far (Nomoto et al. 2001; Mazzali et al. 2002).
What is the implication of this work to the intermediate mass black holes recently discovered in M82? One possible scenario for the formation of such black holes is the merging of massive stars in the dense stellar clusters (Portegies et al. 1999). This scenario is consistent with the results of this paper, because such merging increases the number of massive star explosions. However, our results constrain the merging history. The typical mass range for the merged stars cannot be in the range for PISN () to be consistent with the energy to heavy element mass ratios observed in M82.
This work has been supported in part by the grant-in-Aid for Scientific Research (12640233, 14047206, 14540223) of the Ministry of Education, Science, Culture, Sports, and Technology in Japan.
References
- (1) Abbott, D. C. 1982, ApJ, 263, 723
- (2) Anders, E., & Grevesse, N. 1989, Geochim. Cosmochim. Acta, 53, 197
- (3) Barkat, Z., Rakavy, G., & Sack, N. 1967, Phys. Rev. Letters, 18, 379
- (4) Blinnikov, S., Lundqvist, P., Bartunov, O., Nomoto, K., & Iwamoto, K. 2000, ApJ, 532, 1132
- (5) Caughlan, G., & Fowler, W. 1988, Atomic Data Nucl. Data Tables, 40 , 283
- (6) Ebisuzaki, T., Makino, J., Tsuru, T. G., Funato, Y., Portegies, S., Hut, P., McMillan, S., Matsushita, S., Matsumoto, H., & Kawabe, R. 2001, ApJ, 562, L19
- (7) Fraley, G. S. 1968, Ap & Sp. Sci. 2, 96
- (8) Galama, T. et al. 1998, Nature, 395, 670
- (9) Harashima, T., et al. 2002, in preparation
- (10) Heger, A., & Woosley, E. 2002, ApJ, 567, 532
- (11) Iwamoto, K., Mazzali, P.A., Nomoto, K., Umeda, H., et al. 1998, Nature, 395, 672
- (12) Kaaret, P., Prestwich, A. H., Zezas, A., Murray, S. S., Kim, D.-W., Kilgard, R. E., Schlegel, E. M., & Ward, M. J. 2001, MNRAS, 321, L29
- (13) Leitherer, C., Robert, C., & Drissen, L 1992, ApJ, 401, L596
- (14) Matsumoto, H., Tsuru, T. G., Koyama, K., Awaki, H., Canizares, C. R., Kawai, N., Kawabe, R., Matsushita, S., & Kawabe, R. 2001, ApJ, 547, L25
- (15) Matsushita, S., Kawabe, R., Matsumoto, H., Tsuru, T. G., Kohno, K., Morita, K., Okumura, S. K., & Vila-Vilaró, B. 2000, ApJ, 545, L107
- (16) Mazzali, P.A., et al. 2002, ApJ, 572, L61
- (17) Nakamura, T., Umeda, K., Iwamoto, K., Nomoto, K., Hashimoto, M., Hix, W.R., Thielemann, F.-K. 2001, ApJ, 555, 880
- (18) Nomoto, K., Thielemann, F. -K., & Yokoi, K. 1984, ApJ, 286, 644
- (19) Nomoto, K., Hashimoto, M., Tsujimoto, T., Thielemann, F.-K., Kishimoto, N., Kubo, Y., & Nakasato, N. 1997a, Nucl. Phys. A616, 79
- (20) Nomoto, K., Iwamoto, K., Nakasato, N., Thielemann, F.-K., Brachwitz, F., Tsujimoto, T., Kubo, Y., & Kishimoto, N. 1997b, Nucl. Phys. A621, 467
- (21) Nomoto, K., Suzuki, T., Shigeyama, T., Kumagai, S., Yamaoka, H., & Saio, H. 1993, Nature, 364, 507
- (22) Nomoto, K., Yamaoka, H., Pols, O. R., van den Heuvel, E. P. J., Iwamoto, K., Kumagai, S., & Shigeyama, T. 1994, Nature, 371, 227
- (23) Nomoto, K. et al. 2001, in Supernovae and Gamma Ray Bursts, ed. M.Livio et al. (Cambridge University Press), 144 (astro-ph/0003077)
- (24) Ober, W. W., El Eid, M. F., & Fricke, K. J. 1983, A&A, 119, 61
- (25) Paczynski, B. et al. 2001, in Supernovae and Gamma Ray Bursts, ed. M.Livio et al. (Cambridge University Press), 1
- (26) Portegies Z. S. F., Makino, J., McMillan, S. L. W., & Hut, P. 1999, A&A, 348, 117
- (27) Shigeyama, T., & Nomoto, K. 1990, ApJ, 360, 242
- (28) Spruit, H. C. 1992, A&A, 253, 131
- (29) Strickland, D.K., Ponman, T. J., Stevens, I. R. 1997, A&A, 320, 378
- (30) Thielemann, F.-K., Nomoto, K., & Hashimoto, M. 1996, ApJ, 460, 408
- (31) Tsuru, T. G., Awaki, H., Koyama, K., Ptak, A. 1997, PASJ, 49, 619
- (32) Umeda, H., Nomoto, K., Yamaoka, H. & Wanajo, S. 1999, ApJ, 513, 861
- (33) Umeda, H., Nomoto, K., & Nakamura, T. 2000, in The First Stars, ed. A. Weiss, T. Abel, & V. Hill (Berlin: Springer), 150 (astro-ph/9912248)
- (34) Umeda, H., & Nomoto, K. 2002, ApJ, 565, 385
- (35) Woosley, S. E., & Weaver, T. A. 1982, in Supernovae: A survey of Current Research, eds. M. J. Rees & R. J. Stoneham (Dordrecht: Reidel), 79
- (36) Woosley, S.E., & Weaver, T.A. 1995, ApJS, 101, 181


| Ejected Mass () | |||||||||||
|---|---|---|---|---|---|---|---|---|---|---|---|
| (, ) | C | N | O | Ne | Mg | Si | S | Ar | Ca | Fe | [Si/O] |
| (13, 0.02) | 0.11 | 0.058 | 0.26 | 0.037 | 0.025 | 0.072 | 0.039 | 0.0074 | 0.0059 | 0.091 | 0.57 |
| (13, 0) | 0.19 | 0.10 | 0.22 | 0.026 | 0.023 | 0.049 | 0.026 | 0.0051 | 0.0048 | 0.070 | 0.56 |
| (15, 0.02) | 0.16 | 0.060 | 0.39 | 0.058 | 0.035 | 0.085 | 0.044 | 0.0081 | 0.0066 | 0.094 | 0.47 |
| (15, 0) | 0.19 | 0.014 | 0.53 | 0.072 | 0.030 | 0.11 | 0.063 | 0.013 | 0.013 | 0.070 | 0.43 |
| (20, 0.01) | 0.31 | 0.028 | 1.76 | 0.12 | 0.076 | 0.28 | 0.15 | 0.026 | 0.022 | 0.082 | 0.33 |
| (20, 0.004) | 0.33 | 0.015 | 1.27 | 0.10 | 0.064 | 0.23 | 0.13 | 0.024 | 0.021 | 0.081 | 0.39 |
| (20, 0.001) | 0.29 | 0.0034 | 1.65 | 0.14 | 0.077 | 0.28 | 0.17 | 0.032 | 0.030 | 0.073 | 0.36 |
| (20, ) | 0.26 | 4.8e-4 | 1.27 | 0.18 | 0.080 | 0.28 | 0.16 | 0.028 | 0.024 | 0.071 | 0.48 |
| (20, ) | 0.26 | 0.0018 | 2.02 | 0.15 | 0.098 | 0.33 | 0.21 | 0.041 | 0.040 | 0.070 | 0.35 |
| (20, 0) | 0.26 | 2.7e-4 | 1.56 | 0.12 | 0.071 | 0.25 | 0.15 | 0.030 | 0.030 | 0.070 | 0.34 |
| (25, 0.02) | 1.01 | 0.050 | 5.79 | 0.66 | 0.22 | 0.67 | 0.30 | 0.049 | 0.032 | 0.11 | 0.20 |
| (25, 0) | 0.61 | 3.6e-4 | 2.18 | 0.20 | 0.12 | 0.31 | 0.17 | 0.033 | 0.031 | 0.070 | 0.28 |
| (30, 0.02) | 0.96 | 0.061 | 3.43 | 2.31 | 0.68 | 0.25 | 0.091 | 0.017 | 0.0083 | 0.12 | |
| (30, 0) | 0.36 | 1.9e-4 | 4.80 | 0.27 | 0.24 | 0.49 | 0.27 | 0.052 | 0.050 | 0.070 | 0.14 |
| (40, 0.02) | 0.81 | 0.086 | 6.41 | 2.06 | 0.48 | 0.36 | 0.16 | 0.026 | 0.019 | 0.12 | 0.12 |
| (20, 0.02)aa=0.15, 1.3 CF88 for the 12C(O rate | 0.27 | 0.048 | 2.03 | 0.65 | 0.17 | 0.15 | 0.068 | 0.011 | 0.0084 | 0.10 | 0.01 |
| (20, 0)aa=0.15, 1.3 CF88 for the 12C(O rate | 0.21 | 9.9e-4 | 1.77 | 0.47 | 0.11 | 0.16 | 0.089 | 0.018 | 0.017 | 0.071 | 0.09 |
| (50, )bb=0.1, CF88 12C(O rate | 5.89 | 0.0015 | 11.6 | 0.38 | 0.21 | 0.37 | 0.17 | 0.030 | 0.027 | 0.070 | 0.36 |
| (50, )cc=0.5, CF88 12C(O rate | 1.14 | 9.7e-4 | 12.5 | 2.41 | 0.79 | 0.95 | 0.45 | 0.077 | 0.068 | 0.071 | 0.01 |
Note. — The mass of Fe (54Fe, 56Fe, 57Fe) depends on the mass-cut. Here, the mass-cut is chosen to eject 0.07 of 56Ni, which decays into 56Fe, via 56Co. Except for the last four items, the adopted parameters are =0.05 and 1.4 Caughlan & Fowler (1988; CF88 hereafter) for the 12C(O rate.
| Ejected Mass () | |||||||||||
|---|---|---|---|---|---|---|---|---|---|---|---|
| (, ) | C | N | O | Ne | Mg | Si | S | Ar | Ca | Fe | [Si/O] |
| (25, 1) | 0.61 | 3.6e-4 | 2.18 | 0.20 | 0.12 | 0.31 | 0.17 | 0.033 | 0.031 | 0.07 | 0.28 |
| (25, 10) | 0.40 | 7.2e-4 | 1.55 | 0.11 | 0.13 | 0.43 | 0.24 | 0.048 | 0.044 | 0.095 | 0.58 |
| (25, 30) | 0.17 | 0.0023 | 1.03 | 0.059 | 0.12 | 0.54 | 0.30 | 0.060 | 0.052 | 0.12 | 0.85 |
| (30, 1) | 0.36 | 1.9e-4 | 4.80 | 0.27 | 0.24 | 0.52 | 0.27 | 0.052 | 0.050 | 0.11 | 0.17 |
| (30, 20) | 0.24 | 2.2e-4 | 3.21 | 0.14 | 0.15 | 0.75 | 0.44 | 0.079 | 0.074 | 0.16 | 0.50 |
| (30, 30) | 0.17 | 1.4e-4 | 2.77 | 0.10 | 0.13 | 0.78 | 0.51 | 0.093 | 0.081 | 0.16 | 0.58 |
| (30, 50) | 0.11 | 9.1e-5 | 2.16 | 0.058 | 0.086 | 0.78 | 0.56 | 0.13 | 0.092 | 0.18 | 0.69 |
| (170, 22.4) | 2.30 | 0.010 | 44.2 | 1.19 | 1.94 | 16.2 | 8.06 | 1.42 | 1.32 | 3.6 | 0.69 |
| (200, 26.8) | 4.24 | 5.8e-4 | 56.0 | 3.75 | 3.08 | 21.2 | 13.1 | 2.36 | 2.32 | 7.2 | 0.71 |
Note. — Here, the mass-cut (or Fe mass) is chosen to satisfy the observed Si/Fe ratio. The =170 & 200 PISN models are also shown. The SN II models with and PISN models do not satisfy the observational constraints Eq.s (4-6), but the core-collapse hypernova models () shown here satisfy the constraints. The adopted parameters are =0.05 and 1.4 CF88 for the 12C(O rate.