The Fornax Cluster Spectroscopic Survey: A Sample of Confirmed Cluster Dwarfs
Abstract
The Fornax Cluster Spectroscopic Survey (FCSS) project utilises the Two-degree field (2dF) multi-object spectrograph on the Anglo-Australian Telescope. Its aim is to obtain spectra for a complete sample of all 14000 objects with irrespective of their morphology in a 12 deg2 area centred on the Fornax Cluster. A sample of 24 Fornax Cluster members has been identified from the first 2dF field (3.1 deg2 in area) to be completed. This is the first complete sample of cluster objects of known distance with well defined selection limits. 19 of the galaxies (with –15.8–12.7) appear to be conventional dwarf elliptical (dE) or dwarf S0 (dS0) galaxies. The other 5 objects (with –13.6–11.3) are those galaxies which we described in Drinkwater et al. (2000b) and labelled ‘Ultra-Compact Dwarfs’ (UCDs). A major result is that the conventional dwarfs all have scale-sizes 3 arcsec (300 pc). This apparent minimum scale size implies an equivalent minimum luminosity for a dwarf of a given surface brightness. This produces a limit on their distribution in the magnitude-surface brightness plane, such that we do not observe dEs with high surface-brightnesses but faint absolute magnitudes. Above this observed minimum scale-size of 3 arcsec, the dEs and dS0s fill the whole area of the magnitude–surface brightness plane sampled by our selection limits. The observed correlation between magnitude and surface brightness noted by several recent studies of brighter galaxies is not seen with our fainter cluster sample. A comparison of our results with the Fornax Cluster Catalog (FCC) of Ferguson illustrates that attempts to determine cluster membership solely on the basis of observed morphology can produce significant errors. The FCC identified 17 of the 24 FCSS sample (i.e 71 per cent) as being ‘cluster’ members, in particular missing all 5 of the UCDs. The FCC also suffers from significant contamination: within the FCSS’s field and selection limits, 23 per cent of those objects described as cluster members by the FCC are shown by the FCSS to be background objects.
keywords:
galaxies: luminosity function – galaxies: statistics – galaxies: clusters: individual: Fornax – surveys – techniques: spectroscopic1 Introduction
It is generally perceived that dwarf galaxies are primarily of low surface brightness, and that lower luminosity galaxies have fainter surface brightnesses. In particular, low surface brightness galaxies (LSBGs) seen towards a cluster are conventionally assumed to be members, while apparently faint, but high surface brightness galaxies (HSBGs) are presumed to be luminous objects in the background (e.g. Sandage, Binggeli & Tammann 1985). Indeed, it has frequently been asserted that dwarf galaxies (in particular) exhibit a strong surface brightness – luminosity relation (e.g. Sandage, Binggeli & Tammann 1985; Bingelli, Sandage & Tammann 1985; Kormendy 1985; Ferguson & Sandage 1988). Binggeli (1994) has particularly persuasively argued this point with reference to the Local Group. Nevertheless, other authors have noted that a good deal of the evidence for the correlation relies on the ‘eyeball’ selection of dwarf galaxies ‘similar’ to ones already known, that any correlation breaks down at the low luminosity end, and/or that there may be strong selection effects limiting the detected galaxies’ photometric parameters (e.g. Phillipps, Davies & Disney 1988; Irwin et al. 1990).
The failure of the relation, i.e. the existence of large background LSBGs (such as the serendipitously discovered Malin 1; Bothun et al. 1987), or of a population of high surface brightness (compact) dwarfs in a cluster (Drinkwater & Gregg 1998), or indeed of a population of galaxies so compact as to masquerade as stars and, hence, be missed altogether from galaxy samples (e.g. Arp 1965; Drinkwater et al. 2000b; Phillipps et al. 2001) could have a dramatic effect on our perception of the galaxy population as a whole (see Impey & Bothun 1997).
The primary factor preventing a resolution of the controversy has been the non-existence of suitable samples of confirmed dwarfs of known distance (and hence luminosity) with well defined selection limits. Generally, dwarf galaxy samples have been either subjectively (for instance, morphologically) selected sets of cluster galaxies (e.g. Ferguson 1989) or objectively chosen sets of galaxies with unconfirmed cluster membership/unknown distances (e.g. Irwin et al. 1990).
However, the development of a new generation of multi-object spectrographs, exemplified by the ‘2 degree field’, or 2dF, multi-fibre spectrograph on the Anglo-Australian Telescope (AAT) (see e.g. Taylor, Canon & Parker 1998), has made it possible to conduct a truly complete spectroscopic survey of a given area on the sky, down to well determined, faint limits, irrespective of image morphology or any other pre-selection of target type, and thus obtain redshifts for a large and unbiased sample of targets (Phillipps 1997). Our Fornax Cluster Spectroscopic Survey (FCSS) aims to exploit the huge multiplexing advantage of 2dF in this way by surveying, in total, a region of 12 deg2 centred on the Fornax Cluster of galaxies. The prime reason for choosing this area of sky area was, of course, the presence of the Fornax Cluster itself. Fornax, with Virgo, is the nearest reasonably rich cluster (approximately Abell Richness Class 0 – it is supplementary cluster S0373 in Abell, Corwin & Olowin 1989).
The targets of the FCSS encompass both cluster galaxies, of a wide range of types and magnitudes, and background galaxies (over a similarly wide range of morphologies), as well as Galactic stars and QSOs (Drinkwater et al. 2000a). Our main motivation for an all-object survey was to determine cluster membership for as complete a sample of objects as possible across a wide range of surface brightnesses. We wished to test, in particular, whether the usual assignment of LSBGs to the cluster and high (or even ‘normal’) surface brightness faint galaxies to the background is justified. The situation regarding HSBGs is even less clear than for LSBGs – the question of the very existence of normal or high surface brightness dwarf galaxies (excepting possibly pathological cases like M32) has been highly controversial – see, for example, the contrasting views expressed in Ferguson & Sandage (1988) and Irwin et al. (1990). An up to date discussion is given in Trentham & Hodgkin (2002).
Drinkwater et al. (2000a) (hereafter Paper I) outlined the aims and methods of the FCSS and presented the results from the first 2° diameter field surveyed. Drinkwater et al. (1999) (Paper II) described the nature of several compact galaxies found beyond the cluster. Meyer et al. (2001) ( Paper IV) discussed the quasars found in the FCSS data. Drinkwater et al. (2000b) (Paper III) and Phillipps et al. (2001) (Paper V) described the discovery of 5 extremely compact, high surface brightness dwarf galaxies within the cluster. These objects (dubbed ‘Ultra-Compact Dwarfs’ -UCDs) have intrinsic sizes 100 pc. They are more compact and significantly less luminous than other known compact dwarf galaxies, yet are much brighter than globular clusters.
The data from the first field (see Paper I) revealed that the Fornax Cluster is clearly defined kinematically. A total of 24 galaxies from the data lie within the cluster (this includes the 5 UCDs described in Papers III and V). This is, to our knowledge, the first complete sample of dwarf galaxies of known distance (and hence luminosity) with well defined selection limits. In this paper we study the nature of the objects in this complete sample. Section 2 briefly describes the methods and present status of the FCSS. Section 3 describes the contents of the complete Fornax Cluster sample and presents and photometry, radial intensity profiles and radial colour distributions for all 24 confirmed cluster members. Using this data we are able to explore (in Section 4) the distribution in luminosity and surface brightness of the confirmed cluster members. Section 5 presents our conclusions.
2 The Fornax Cluster Spectroscopic Survey
The FCSS survey-area will ultimately comprise four separate 2dF fields, covering the majority of the Fornax Cluster area (see fig. 1 and table 1 of Paper I). The results presented in this paper are derived from the first of these four fields to be completed. Field 1 is centred on the large galaxy NGC 1399 at the centre of the cluster (R.A.=03h38m29.0s, Dec.=35°27′01″, J2000).
In common with the main 2dF Galaxy Redshift Survey (2dFGRS; see Colless et al. 2001 and references therein), we have chosen to select our targets from catalogues based on UKST Sky Survey plates digitised by the Automatic Plate Measuring (APM) facility at Cambridge (see Irwin, Maddox & McMahon 1994). However, unlike other galaxy surveys, which only select resolved images for spectroscopic measurement, we avoid any morphological pre-selection and include all objects, both resolved and unresolved (i.e. ‘stars’ and ‘galaxies’). This means that we can include galaxies with the greatest possible range of surface brightnesses: our only selection criterion is the (blue) magnitude limit. Including objects normally classified as stars greatly increases the size of our sample but it is the only way to ensure completeness.
In order both to cover a large number of targets and to go significantly deeper than previous spectroscopic cluster surveys we chose to limit our survey at a magnitude of 19.7. This is marginally deeper than the main 2dFGRS, which is limited at . is the natural band photographic system of the UKST data. This is related to the standard Cousins magnitude by (Blair & Gilmore 1982). Targets are also chosen to be fainter than , since the photometry of brighter objects is problematic with the UKST/APM data (particularly because of image saturation).
Note that the selection limits of the overall APM object catalogue (images larger than a certain area at a given isophotal detection threshold) do not impinge on our target selection, since any galaxies brighter than = 19.7 and with surface brightness high enough to be observable with 2dF (see below) are well above the APM limit (see also Paper I).
Our input catalogue for the FCSS is a standard APM ‘catalogues’ file (Irwin et al. 1994) of field F358 from the UKST Southern Sky Survey. The field is centred at R.A.=03h37m559, Dec.=–34°50′14″ (J2000) and the region scanned for the catalogue file is 5.85.8 deg2, approximately centered on the Fornax Cluster. The APM image catalogue lists image positions, magnitudes and morphological classifications (as ‘star’, ‘galaxy’, ‘noise’, or ‘merged’) measured from both the blue and red survey plates. The ‘merged’ image classification indicates two overlapping images: at the magnitudes of interest for this project the merged objects nearly always consisted of a star overlapping a much fainter galaxy. All the positions are measured from the more recent red survey plate (epoch 1991 September 13 compared to 1976 November 18 for the blue plate) to minimise problems with proper motions. The APM catalogue magnitudes are calibrated for unresolved (stellar) objects only (see Bunclark & Irwin 1984), so we supplemented these with total magnitudes for the galaxies measured by direct analysis of the digitised plate data. These magnitudes were obtained by fitting exponentials to the APM galaxy surface brightness profiles (see Phillipps et al. 1987 and Morshidi-Esslinger, Davies & Smith 1999) across the surface brightness range 22.7 to 25.7 B mag arcsec-2 (i.e. between the possibly saturated inner parts of the images and the sky noise dominated outer parts). Central surface brightnesses and exponential scale lengths could be determined in this way and combined to give pseudo-total magnitudes (see Paper I for further details); we refine these measurements for the cluster objects in the present paper.
Our target selection then consisted simply of taking all objects from the APM catalogue in each of our four 2dF fields with magnitudes in the range . We take the distance to the cluster to be 20 Mpc (a distance modulus of 31.5 mag) as derived by Drinkwater, Gregg & Colless (2001b). This leads to an absolute magnitude range for cluster galaxies –14.8 –11.6, so all the cluster galaxies from FCSS are dwarfs in terms of their luminosity. We did not apply any morphological selection, although the APM image classifications from the blue survey plate were used to determine which photometry to use (i.e. the catalogued APM magnitude in the case of unresolved images, or our fitted magnitudes for resolved images).
Although our targets cover a wide range of surface brightnesses (see fig. 1 of Paper I), our final spectroscopic sample inevitably suffers from incompleteness at the low surface brightness end. It is not possible to measure spectra for the faintest LSBGs catalogued (at central surface brightness around 24.5 B mag arcsec-2) in reasonable exposure times even though the multiplex advantage of 2dF enables us to profitably expose for longer times and hence go fainter than most previous nearby cluster work. Two hour exposures enabled us to obtain measurable spectra for galaxies with central surface brightnesses down to 23.2 B mag arcsec-2 with a success rate of 80 per cent (see Paper I). In order to try to extend our surface brightness limit, we have also experimented with much longer exposures (around 4 hours) for the lowest surface brightness subset and have obtained successful spectra for some objects with surface brightnesses as faint as 23.7 B mag arcsec-2. This forms the practical lower limit to our cluster galaxy sample.
We observed all our targets with an identical observing setup for 2dF: the 300B grating and a central wavelength setting of 5800Å giving a wavelength coverage of 3600–8010Å at a resolution of 9Å (a dispersion of 4.3Å per pixel).
The 2dF facility includes its own data reduction package, 2dfdr, which permits fast, semi-automatic reduction of data direct from the instrument. However, when we started the FCSS project 2dFdr was still under development, so we chose instead to reduce the data with the DOFIBERS package in IRAF111IRAF is distributed by the National Optical Astronomy Observatories, operated by the Association of Universities for Research in Astronomy, Inc. under cooperative agreement with the NSF., as described in Paper I. We have since reduced the data independently with 2dFdr, obtaining entirely comparable results (Deady 2002). In particular, 98 per cent of spectra gave the same velocity shift (see below) to within the quoted errors; the remaining 2 per cent turned out, on further inspection, to have spurious features which had not been removed by the cleaning of the original data.
Redshifts are determined in a standard fashion via cross-correlation of the spectra with templates, using RVSAO in IRAF (Kurtz & Mink 1998). However, as we required an automated system capable of coping with a large number of stars as well as galaxies, we have used stellar template spectra of various types, rather than absorption line galaxy spectra. These were chosen from the library of Jacoby, Hunter & Christian (1984). In addition we use emission line galaxy and quasar templates. For each spectrum we determined the best-matching template, the Tonry-Davies (1979) R coefficient, the redshift and its error. (Again see Paper I for more details and illustrations of the template spectra used). The redshifts are measured as radial velocities in units of and are subsequently converted to heliocentric values. By choosing the template giving the best coefficient we can determine not only the redshift, but a first estimate of the object type. We only accept identifications with . Objects with redshifts of 500 km s-1 or less are Galactic stars for which the best template indicates the stellar spectral type. At higher redshifts, external galaxies are separated into absorption-line types if they match one of the stellar spectra or emission-line types if they match the emission-line galaxy template best.
Typical velocity errors are around 64 km s-1, while comparison with 44 galaxies with redshifts given in the NASA/IPAC Extragalactic Database (NED) reveals a negligible external mean error of km s-1 and rms scatter of 110 km s-1, consistent with our internal errors given the heterogeneous data compiled in NED.
| Name | FCC | ||||||
| FCSS | FCC | FLSB | NG | Other | Type | km s-1 | Template |
| J033418.4-354740 | 132 | – | – | dE2 | M0 | ||
| J033612.9-360959 | 164 | 64 | – | dS0(5),N | K5 | ||
| J033653.3-345618 | 181 | 71 | 56 | HPW19 | dE2,N | G6 | |
| J033703.3-353804 | – | – | – | UCD1 | K5 | ||
| J033718.0-354157 | 194 | 252 | – | dE3 | G0 | ||
| J033723.3-345400 | 195 | 80 | 55 | H14 | dE5,N | G6 | |
| J033734.1-354945 | 196 | 83 | 23 | dE6 | M0 | ||
| J033754.7-345255 | 200 | 256 | – | dE2 | F6 | ||
| J033806.3-352858 | – | – | – | UCD2 | K5 | ||
| J033816.7-353027 | (B1241) | 95 | – | (dE3,pec?) | G6 | ||
| J033821.5-351535 | 211 | – | 71 | dE2,N | F6 | ||
| J033854.1-353333 | – | – | – | UCD3 = CGF1-4 | K5 | ||
| J033905.8-360556 | 221 | 108 | 43 | dE4,N | F6 | ||
| J033919.5-354334 | 223 | 114 | 6 | HPW28 | dE0,N | K5 | |
| J033935.9-352824 | – | – | – | UCD4 = CGF5-4 | K5 | ||
| J033952.5-350424 | – | – | – | UCD5 | F6 | ||
| J034001.3-344529 | 230 | 120 | 76 | HPW29 | dE5,N | G0 | |
| J034023.5-351636 | 241 | 124 | 5 | HPW30 | dE0,N | F6 | |
| J034033.8-350122 | 245 | 126 | 3 | dE0,N | K5 | ||
| J034042.3-353940 | 247 | 127 | 40 | dE3/Im? | F6 | ||
| J034100.8-354433 | 254 | 129 | 22 | dE0,N | G0 | ||
| J034131.8-353521 | 264 | 135 | – | dS0(8),N | G6 | ||
| J034159.4-352053 | (B1554) | – | – | CGF3-1 | (E) | K5 | |
| J034217.3-353226 | 274 | 141 | 15 | HPW39 | dE0,N | K5 |
In the second stage of the identification process we check each identification interactively (cf. Colless et al. 2001), using the RVSAO package to display the best cross-correlation and the object spectrum with common spectral features plotted at the calculated redshift. In the small number of cases when the redshift is obviously wrong (e.g. with the calcium H and K lines clearly present but misidentified), it is flagged as being incorrect or in some cases is recalculated interactively. Objects still not dealt with successfully at this stage are flagged to be re-observed.
Note that the 2dF spectra, though of low resolution and unfluxed, are still useful for more detailed analysis than simple redshift measurements and object classifications. However, we defer any detailed analysis of the spectra in terms of, e.g., emission or absorption line equivalent widths, line ratios, absorption line indices or rough metalicities to later papers.
3 The Fornax Cluster Sample
3.1 Composition of the sample
Within Field 1, we found 24 galaxies with redshifts which place them in the Fornax Cluster (mean km s-1). (In fact, 26 of the input APM catalogue objects have such velocities, but closer inspection reveals one to be an individual HII region of the large irregular galaxy NGC 1427A and the other to be a mistakenly demerged part of the image of the giant galaxy NGC 1381.) Assignment to the cluster is unambiguous, as the cluster is well isolated in redshift space (see Paper I). Our magnitude selection limits place all the sample objects between roughly =–14.8 and =–11.6; more precise magnitudes are determined in Section 3.2 below. Five of the objects were originally observed as ‘stars’, i.e. they had unresolved or only marginally resolved images on the plate material used for the APM catalogue. The relatively small number of cluster galaxies is largely due to the lower bound on the surface brightness at which successful fibre spectra can be obtained. Many dwarfs at these faint magnitudes are expected to have surface brightnesses well below our practical 2dF limit at around 23.7 B mag arcsec-2 (see, e.g., Irwin et al. 1990, Kambas et al. 2000).
Our 24 objects are listed in R.A. order in Table 1. We give their official IAU designations along with their names in other recent Fornax catalogues. FCC refers to Ferguson’s (1989) Fornax Cluster Catalog, FLSBG numbers are from the Fornax Low Surface Brightness Galaxy catalogue of Davies et al. (1988), continued in Irwin et al. (1990) and the UCDs are from Phillipps et al. (2001). NG refers to the galaxies listed by Caldwell (1987). Note that the two non-compact galaxies without FCC numbers were given background galaxy numbers by Ferguson (FCCB 1241 and 1554), but clearly these designations are now inappropriate (see Section 4.2 for a full discussion of this issue). The latter is also CGF3-1 from Hilker et al. (1999), and UCD3 and UCD4 are CGF1-4 and CGF5-4 from the same source. Finally objects FCC 181, 195, 223, 230, 241 and 274 were earlier studied by Hodge (1960) or Hodge, Pyper & Webb (1965), where they were the dwarfs HPW 19, H 14 and HPW 28, 29, 30 and 39, respectively (see Irwin et al. 1990).
As noted, 17 of the 19 non-compact galaxies appear as cluster galaxies in Ferguson’s FCC, and we have included Ferguson’s assessment of their morphological types from his large plate scale Las Campanas plates. All are classified dE or, in two cases, dS0; 12 were judged ‘definite members’, 4 as ‘probable members’ and 1 as a ‘possible member’ (see Section 4.2).
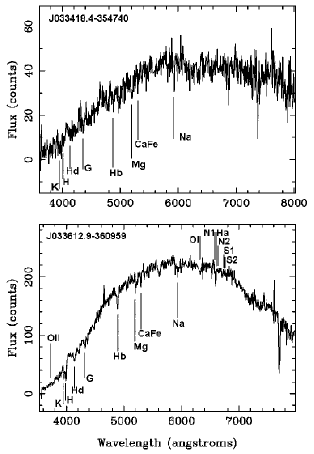
The remaining columns in Table 1 give our derived heliocentric redshift (given as a ‘velocity’, ) and the best fitting stellar template (there are no emission line objects in the sample once the NGC 1427A HII region has been removed). Example spectra are shown in Fig. 1 (all of them can be accessed at http://www.star.bris.ac.uk/pjb/2dfspectra.htm). Remember that no correction for throughput as a function of wavelength in each fibre has been attempted, so the continuum shape in the plots is fairly arbitrary.
The majority (17) of the spectra are best matched by G (7) or K (10) star templates, with 6 matches to F types and 2 to M types. The fact that none of our objects displays any sign of star formation corroborates Ferguson’s dE and dS0 classifications. The non-detection of any dwarf irregular (dI) galaxies within Field 1 is noteworthy. Field 1 is centered on NGC1399 and covers the central part of the cluster. Drinkwater et al. (2001a) obtained Flair-II spectra for 108 brighter (18) members of the cluster over a 6° field. They found that among the dwarfs in their sample (–16.5), the early-type dwarfs dominate in the cluster centre (within a radius of 100 arcmin) with late-type dwarfs being concentrated in the outer regions of the cluster.
Recent theoretical work on dynamical evolution has suggested that, in rich clusters, tidal forces from the cluster’s tidal field can result in significant morphological evolution, enough to convert dIs to dEs (Moore, Lake & Katz 1998). Boyce et al. (2001) suggested that such forces may explain their observation that the core of the rich cluster Abell 868 is devoid of dIs but that there are similar proportions of dIs to dEs beyond the cluster centre. Mayer et al. (2001) have suggested that a related process (‘tidal stirring’) may explain the distribution of dI and dE galaxies in the Local Group. In this process tidal interactions between the dwarfs and the larger member galaxies cause the tidal instabilities which induce evolution from dI to dE. In a poor, but centrally concentrated cluster like Fornax, both of these processes may be at work.
3.2 Photometry of the sample
| Name | ||||||
|---|---|---|---|---|---|---|
| FCSS | arcsec | B mags arcsec-2 | kpc | |||
| J033418.4-354740 | 3.64 | 23.2 | 18.8 | 17.3 | –12.7 | 360 |
| J033612.9-360959 | 5.93 | 21.9 | 16.7 | 15.3 | –14.9 | 580 |
| J033653.3-345618 | 5.94 | 22.9 | 17.6 | 16.3 | –13.9 | 580 |
| J033703.3-353804⋆ | 0.89 | 21.5 | 20.2 | 18.7 | –11.4 | |
| J033718.0-354157 | 4.13 | 23.3 | 18.6 | 17.3 | –12.9 | 410 |
| J033723.3-345400 | 7.27 | 22.8 | 17.1 | 15.7 | –14.4 | 720 |
| J033734.1-354945 | 7.90 | 23.7 | 18.2 | 16.5 | –13.3 | 790 |
| J033754.7-345255 | 4.62 | 23.0 | 17.8 | 16.4 | –13.7 | 450 |
| J033806.3-352858⋆ | 1.41 | 22.3 | 19.9 | 18.3 | –12.4 | |
| J033816.7-353027 | 5.43 | 22.7 | 17.5 | 16.1 | –14.0 | 570 |
| J033821.5-351535 | 4.35 | 21.5 | 16.5 | 15.1 | –15.0 | 470 |
| J033854.1-353333⋆ | 0.98 | 20.7 | 18.9 | 17.2 | –13.6 | |
| J033905.8-360556 | 3.86 | 22.6 | 18.0 | 16.5 | –13.5 | 380 |
| J033919.5-354334 | 9.21 | 23.2 | 16.6 | 15.3 | –14.9 | 900 |
| J033935.9-352824⋆ | 1.00 | 21.9 | 19.9 | 18.5 | –12.5 | |
| J033952.5-350424⋆ | 0.97 | 21.8 | 20.1 | 18.7 | –11.6 | |
| J034001.3-344529 | 5.30 | 22.6 | 17.6 | 16.4 | –13.9 | 520 |
| J034023.5-351636 | 8.76 | 23.7 | 17.1 | 16.0 | –14.4 | 860 |
| J034033.8-350122 | 6.85 | 22.3 | 16.3 | 15.0 | –15.2 | 670 |
| J034042.3-353940 | 6.02 | 23.4 | 18.1 | 17.1 | –13.4 | 590 |
| J034100.8-354433 | 9.42 | 24.6 | 18.1 | 16.6 | –13.4 | 920 |
| J034131.8-353521 | 6.08 | 21.9 | 17.0 | 15.7 | –14.5 | 600 |
| J034159.4-352053 | 3.23 | 22.1 | 17.8 | 16.2 | –13.8 | 320 |
| J034217.3-353226 | 6.30 | 22.8 | 16.9 | 15.8 | –14.7 | 620 |
As noted earlier, initial photometry for all the catalogue galaxies was derived from the APM scan data in automated fashion, assuming pure exponential radial profiles and circular isophotes (cf. Morshidi-Esslinger et al. 1999). We have now improved on this photometry by using photographic data from a IIIaJ plate and a Tech Pan film from the UKST, digitised by the SuperCOSMOS measuring machine at the Royal Observatory, Edinburgh (e.g. Hambly, Irwin & MacGillivray 2001). Table 2 presents the results of this photometry. The data were calibrated (Deady 2002) onto the standard Cousins and system via comparison of the surface brightness profiles of four suitable, lowish surface brightness dwarfs (so as to avoid problems of saturation at moderate to high surface brightness on the plates) with corresponding CCD data from Davies, Phillipps & Disney (1990). The methodology was as in Phillipps & Parker (1993). Note that none of the calibrating galaxies are actually in the present cluster galaxy sample, either being outside the 2dF area or of too low a surface brightness for 2dF spectroscopy. The Davies et al. (1990) calibration is closely similar (to 0.1 mag) to both that of the original APM low surface brightness galaxy survey of Davies et al. (1988) and the Fornax Cluster Catalog of Ferguson (1989). After independently calibrated Curtis Schmidt data became available (Karick et al., in prep.) we were able to confirm that our photographic and CCD magnitude scales were in excellent agreement, too.
To determine total magnitudes for our galaxies, we used the SEXTRACTOR package (Bertin & Arnouts 1996) to generate Kron magnitudes (Kron 1978). We selected an aperture size of 3.5 Kron radii (cf. Metcalfe et al. 1995), which contains 99.3 per cent of the light for an exponential profile. Our magnitudes should therefore be total to within 0.01 mag. A more significant source of error will be the determination of the background sky level. A realistic measure of the uncertainty in this was judged to be , where is the width (standard deviation) of the histogram of local sky values. Repeating the Kron radius and magnitude calculation with the background varied by this amount gives our estimate of the magnitude errors from this source. Allowing also for possible systematic zero point errors of 0.05 mag we find final photographic magnitude errors 0.1–0.2 mag. The and magnitudes for all our cluster galaxies are summarized in columns 4 and 5 of Table 2. Note, however, that the photographic data of the UCDs (denoted by an asterix in Table 2) suffer from saturation, so the and values in Table 2 only provide faint magnitude limits for these objects. Column 6 presents values assuming D=20 Mpc (see Section 2). In this column, we have avoided the problems of the saturation of the photographic data for the UCDs, by including, for these objects, the absolute magnitudes derived from Curtis Schmidt CCD data by Phillipps et al. (2001), and corrected from to by assuming 0.7.
The colours are all rather similar (nearly all between 1.2 and 1.5), and are consistent with the spectral classifications as quiescent dE or dS0 galaxies. Aside from the UCDs, the galaxies have a mean colour of =1.330.03, essentially identical to the =1.38 reported by Davies et al. (1990) for their (presumed) cluster LSBGs. Although the numbers are small, there is a (comforting) slight trend for redder colours for the objects which match best to later type stellar spectra (in particular the two M0 matches have an average of 1.54).


The STARLINK routine ELPROF was used to determine the radial intensity profile, as a function of semi-major axis length, for the cluster dwarfs (as well as the calibrating galaxies) from the photographic and data. The radial intensity profiles and radial colour distributions are illustrated in Fig. 2. Most of the radial intensity profiles are well fitted by a simple exponential law (straight line in the plot), typical of dwarf galaxies, though some do show some curvature. In some cases this is due merely to the saturation of the band measurements at 22 B mag arcsec-2. This is less of a problem with the profiles as the Tech Pan films have somewhat better dynamic range. For completeness we have therefore also fitted the more general Sersic (1968) law (cf. Davies et al. 1988). This fitting confirms that 13 of the 19 normal (i.e. not ultra-compact) dwarfs have best fitting indices (in the band), where corresponds to a pure exponential. Four of the remainder have between 0.4 and 0.8 (a pure de Vaucouleurs (1959) law, appropriate for giant ellipticals, would have ), while two have . Given that the differences in calculated for the and band profiles are typically around 0.2 (even when there is no systematic colour gradient), that is probably a reasonable estimate of the level of uncertainty in . For subsequent fitting we thus assume that the standard exponential profile is a sufficiently good fit in all cases.
Columns 2 and 3 of Table 2 therefore contain the scale sizes (in arcsec) and extrapolated central surface brightnesses of the exponential fit to the band radial intensity profiles. Column 7 lists the scale size in kpc (assuming D=20 Mpc). Fitting was carried out in the range between 22.5 and 26 B mag arcsec-2. For the compact objects, the tabulated values are merely limits on the intrinsic surface brightnesses and scale lengths due to the effects of the point-spread function (as discussed in more detail in Paper V). Errors in the scale sizes from the fitting procedure are typically of order 10 per cent, and the differences between the and scale lengths are at the same level in almost all cases (though a couple show systematic colour gradients and therefore differences up to 20 per cent). One galaxy, FCSS J034100.8-354433, is difficult to treat as simply as the others as it appears to have a two component structure. In the table we give the parameters for its ‘outer disc’ (which has a very low surface brightness around 24.5 B mag arcsec-2, making it an outlier in the plots below), but it also has a much more steeply rising ‘inner bulge’ with actual central surface brightness more like 23 B mag arcsec-2 (hence the successful spectroscopy of this object), and a scale size of around 2 arcsec. Given the small range of colours for most of the sample, unsurprisingly no correlation between colour and surface brightness or scale length is apparent.
4 Discussion
4.1 The Bivariate Brightness Distribution (BBD) of the cluster sample
Two necessary steps towards any full understanding of the processes of galaxy formation and evolution are (i) the compilation of a full and complete census of the local extragalactic population and (ii) an accurate and detailed quantification of this population. Traditionally astronomers have sought to quantify the local galaxy population by constructing galaxy luminosity functions (LFs). The LF of a sample of galaxies is the space density of the galaxies in that sample as a function of absolute luminosity. In theory, if one could select a complete sample of galaxies over a sufficiently large section of the local Universe such that large-scale structure and clustering effects could be ignored then the LF which could be constructed would provide a definitive measure of the local luminosity density. In practice the many studies of the field population LF (Loveday et al. 1992; Lin et al. 1997; Marzke et al. 1997; Bromley et al. 1998; Muriel, Valotto & Lambas 1998; Zucca et al. 1997; Folkes et al. 1999) have produced significantly differing results and have generally not been complete to very faint limits. An alternative approach is to seek for clues about galaxy formation and evolution by constructing the LF for particular environments and then studying the difference in the derived LFs between environments. The many recent studies of the LFs of particular clusters (e.g. Driver et al. 1994; de Propris et al. 1995; Lobo et al. 1997; Wilson et al. 1997; Valotto et al. 1997; Smith, Driver & Phillipps 1997; Trentham 1997a, 1997b, 1998; Driver, Couch & Phillipps 1998b; Garilli, Maccagni & Andreon 1999) fall into this category.

However, it is now well established that the inclusion of a galaxy in an optically selected sample is critically dependent not only on its absolute luminosity but also on its surface brightness (Disney 1976; Phillipps, Davies & Disney 1990; Impey & Bothun 1997). It is also well established that LSBGs exist with a wide range of total luminosities. Such galaxies will have been excluded from most determinations of the LF. A more thorough and physically meaningful way to quantify the extragalactic population is the construction of a Bivariate Brightness Distribution (BBD), i.e. the space density of galaxies as a function of their total luminosity and their surface brightness or, equivalently, as a function of their size and surface brightness (Boyce & Phillipps 1995; Dalcanton 1998; Cross & Driver 2002). A consideration of any possible surface brightness–luminosity relation is then encompassed as part of the wider determination of the BBD. Past attempts at deriving a BBD (e.g. Choloniewski 1985; van der Kruit 1987; Sodre & Lahav 1993) have generally suffered from poor statistics. The advent of wide-field imaging surveys and dedicated spectroscopic surveys has made the measurement of the BBD for statistically significant populations possible for the first time (Driver 1999; Cross et al. 2001; de Jong & Lacey 2000; Blanton et al. 2001). These authors have all studied the ‘field’ population to relatively bright limits.
A thorough attempt, therefore, to catalogue and quantify the contents of a cluster, requires, as a first stage, the detection of a complete sample of cluster objects to well defined (preferable very faint) limits in absolute luminosity and surface brightness. Secondly, the morphologies of the various objects found need to be determined. Finally, the BBD for each morphological type can be constructed. Even this could be further refined since, for example, one might expect the morphological composition of the cluster core to differ from its outer regions. Hence, one may wish to study the BBD as a function of cluster radius.
Whilst we do not yet have a large enough sample of Fornax Cluster objects to undertake a full determination of the cluster BBD, we do have a complete sample close to the cluster centre with well defined luminosity and surface brightness limits and can, therefore, draw some general conclusions about the luminosity–surface brightness or size–surface brightness distribution for the first time.
Fig. 3 shows the size–surface brightness distribution of the Fornax Cluster sample using the B-band data from Table 2 (i.e. plotting against ). The limits imposed by the APM magnitude selection limits () are noted. These boundaries become slightly fuzzy in terms of the final photometry since the target selection was in terms of APM magnitudes. The actual APM catalogue limit (on isophotal size at a threshold surface brightness) hardly impinges on our sample, as noted earlier, since the low surface brightness galaxies which we are biased against including because of their small isophotal sizes (see e.g. Davies et al. 1988) have too low a surface brightness to be successfully observed by 2dF anyway. Also noted in Fig. 3 is the position of our absolute surface brightness limit at 23.7 B mag arcsec-2. The surface brightness effective limit is a fuzzy boundary between 23.2 and 23.7 B mag arcsec-2 where the 2dF success rate falls from 80 per cent to zero.
Since we are dealing with fibre spectra, it is only the central region of the object which is observed. This can have a positive effect on the inclusion of low surface brightness objects in the case where they are nucleated (i.e. dE,Ns) since the nucleus may be bright enough to obtain a successful spectrum even if it sits in a very low surface brightness galaxy. For example, we noted in Section 3.2 that J034100.8-354433 has a prominent nuclear bulge and that the values of and included in Table 2 refer only to the outer disk component of this galaxy. In fact, according to the FCC, 12 of our sample are nucleated (see Table 1). However, in our imaging data only 3 (J034023.5-351636, J034100.8-354433 and J034217.3-353226) show an observed central surface brightness significantly brighter than the extrapolated value listed in Table 2. For these 3 objects, we show on Fig. 3 the observed as well as the extrapolated central surface brightness. This makes it clear how J034100.8-354433 in particular has been included in the sample despite having an extrapolated central surface brightness of 24.6 B mags arcsec-2.
From Fig. 3 it can be clearly seen that the Fornax sample falls into two distinct areas of the size–surface brightness plane. Firstly, the UCDs can be seen around 1 arcsec (100 pc at the distance of Fornax) between =20.5–22.3 B mag arcsec-2. Secondly, the rest of the (non-compact) dwarfs have 3 arcsec. Above =3 arcsec (300 pc), the cluster sample essentially fills all of the available (,) parameter space and therefore shows no correlation between the parameters. This non-correlation was claimed previously on purely photometric grounds by Davies et al. (1988) and Irwin et al. (1990). However, the area of parameter space between =1–3 arcsec contains no galaxies. There appears to be a minimum scale size which a Fornax dE can have.
Whilst Fig. 3 re-emphasises that the UCDs appear to form a distinct population from the larger ‘normal’ dwarfs, one cannot extrapolate too much about the relative properties of the UCDs and the non-compact objects from this figure alone. As noted above, due to the unresolved nature of the UCDs in the photographic data, the plotted values of and are merely limits: the UCDs may be smaller and have higher surface brightness than we measure. In fact a preliminary analysis of HST imaging of these objects (Drinkwater et al, in prep.) suggests that the UCDs actually have scale sizes as small as 0.1 arcsec and central surface brightnesses up to 3 mag brighter than measured from our photographic data. The bright central surface brightnesses of the UCDs will make them detectable to fainter magnitudes than the non-compact objects and hence the relative number densities of the two populations are not clearly illustrated by Fig. 3. The nature of the UCDs is currently a subject of some discussion (Drinkwater et al. 2000b; Hilker et al. 1999; Mieske, Hilker & Infante 2002), the debate focussing on whether the UCDs form a distinct population of galaxies not linked to globular clusters or whether there is a smooth transition between both populations. We defer further consideration of this issue until presentation of our HST results.
From Fig. 3, we can say little about the area with surface brightness fainter than 23.7 B. However, it is noteworthy that we have detected 6 objects with surface brightness between 23.2–23.7 B mag arcsec-2, despite the completeness of the sample as whole falling from 80 to 0 per cent in this range. We might reasonably expect further dwarfs to lie within this region.

Fig. 4 shows the relationship in its alternative form, showing central surface brightness against absolute magnitude. The upper and lower magnitude selection limits are once again shown along with the absolute surface brightness limit at 23.7 B mag arcsec-2. The outlier FCSS J034100.8-354433 is again seen apparently defying these limits at 24.5 B mag arcsec-2, –13.4.
Also shown in Fig. 4 is the locus for a galaxy with a pure exponential profile with a constant scale size of 3 arcsec (300 pc at the distance of Fornax), assuming a circular image. There is a large area of parameter space to the upper right of this line within which the FCSS would have detected galaxies, but the only galaxies within it are the UCDs. However, as noted above, the UCDs may have central surface brightness up to 3 mag brighter than derived from our photometry. If so, then the plotted area of parameter space to the upper right of the =3 arcsec locus would be completely empty. Below the =3 arcsec locus the sample fills the entirety of available parameter space. It is notable that this limit in scale-size imposes on the sample the upper-bound of an apparent surface brightness–magnitude ‘correlation’. However, to our limits of and there is no evidence for a lower bound to any such correlation. If such a surface brightness–magnitude correlation does exist for the Fornax dwarfs it must be fairly broad. For example, at =–15.0 the surface brightness distribution is 2.5 mag in width.

In Fig. 5 we again present the Fornax dwarf sample on a plot of central surface brightness against absolute luminosity. We also show on this figure the positions of Local Group galaxies taken from Mateo (1998). One needs to be wary of reading too much into this diagram. Whilst we might reasonably expect that Local Group galaxies form the most complete sample of galaxies at faint luminosities and low surface brightness available, the Local Group data does not form a sample to strictly defined completeness limits. We are also, of course, comparing galaxies from two different environments (i.e. the centre of the Fornax cluster and the much more diffuse Local Group). The presence of several dIs in the Local Group, where none was found in Field 1 of the FCSS, is testimony to this. In common with the Fornax dEs, all of the Local Group dEs also have 300 pc. Most of the Local Group dIs are also constrained by this scale size limit, apart from two outliers, both of which lie in the region of (,) space occupied by the UCDs. However, as noted above, the UCDs have central surface brightnesses up to 3 mag brighter than derived from our photometry, in which case the Local Group dIs do not in reality lie in a similar region of (,) space. The dSphs of the Local Group do appear to show a correlation between surface brightness and absolute magnitude, although these objects are generally considered to form a distinct population from the brighter dEs. Many of the Local Group dSphs have scale-sizes less than 300 pc. Our FCSS data are not sensitive enough to detect any similar objects in Fornax.
We also note on Fig. 5 the region at bright absolute luminosities (–16.0) within which the galaxies from the faint end of Cross et al.’s (2001) 2dFGRS sample lie. This is one of the largest samples of bright galaxies yet assembled and formed the basis of Cross et al.’s determination of the BBD (see also Cross & Driver 2002). It should be noted, however, that Cross et al.’s sample is not differentiated by morphological type (it includes ellipticals, bulge dominated spirals, disc dominated spirals and irregulars). In order to compare the Cross et al. sample with our data, we have translated their effective surface brightnesses to central surface brightness by assuming a shift of 1.8 mag appropriate for an exponential profile. Within the limits of their sample, Cross et al. found a correlation between surface brightness and absolute magnitude such that scales as 0.42. The relationship is around 2.5 mags wide in surface brightness at each absolute magnitude. It is clear from the Fornax and Local Group data that this relationship does not extend to fainter magnitudes. As noted, the lower limit to the scale size of the dEs (at 300 pc) creates an apparent upper-bound to a surface brightness-magnitude ‘correlation’. Obviously the of this upper-bound scales as , i.e. much steeper than the Cross et al. correlation. There is, though, no evidence that there is a low surface brightness bound to any such correlation for dwarfs. The correlation between surface brightness and absolute magnitude for Local Group dSphs is also much steeper than that from Cross et al.’s bright galaxy sample.
4.2 Morphology as an indicator of cluster membership
A prime aim of the FCSS is to test the reliability of using optical morphology as a basis for determining cluster membership. Firstly, it is worth noting that only 50 per cent of our complete cluster sample galaxies actually have 22.5 B mag arcsec-2, the criterion often used to define a low surface brightness galaxy. In other words, though all our objects are dwarfs, many of them extreme dwarfs, in terms of luminosity, half of them are not low surface brightness galaxies. So, any selection based on the assumption that all cluster dwarfs are going to be LSBGs will be flawed. Of course, many other LSB dwarfs which are really present will be too faint for us to obtain a spectroscopic redshift, so the true fraction of non-LSBG dwarfs will be considerably smaller than 50 per cent, but the important point as regards morphological (pre)selection is that such dwarfs do exist. In addition we find 15 background objects with 22.5 B mag arcsec-2 which would morphologically be likely to be assigned to the cluster.
Our best point of comparison is with Ferguson’s (1989) FCC. Ferguson catalogued 2678 objects from photographic plates of an area 40 deg2 centered on the Fornax cluster. He gave each object one of five classifications: ‘class 1 - definite cluster member’; ‘class 2 - probable cluster member’; ‘class 3 - possible cluster member’; ‘class 4 - likely background object’; and ‘class 5 - definite background object’.
Of our complete sample of 24 Fornax Cluster dwarfs, a total of 17 (71 per cent of our cluster sample) were ascribed by Ferguson to the cluster: 12 as class 1; 4 as class 2; and 1 as class 3. One of our cluster sample (FCSS J034159.4-352053) was described as class 5 (‘definite background object’). This object has the smallest scale size (3.23 arcsec) of any of the non-UCDs in our sample, although its surface brightness and absolute magnitude are not remarkable compared to the rest of the cluster sample. Another of our sample (FCSS J033816.7-353027) was listed by Ferguson as a ‘class 4’ (‘possible background object’). This does not have a remarkable surface brightness or absolute magnitude although it has one of the smaller scale lengths of the non-UCD objects (5.43 arcsec). Ferguson did not include any of the UCDs within the FCC either as background galaxies or cluster members. Presumably these were so compact as to be considered foreground stars.
In addition, within the FCSS survey of Field 1 we found that a further 5 objects which Ferguson had ascribed to the cluster (1 as class 1; 4 as class 2) are actually background objects. So within our field and our selection limits, Ferguson ascribed 22 objects to the cluster. FCSS has found that 5 of these objects (i.e. 23 per cent of Ferguson’s cluster objects) are actually background objects. A further 9 objects which were listed by Ferguson as class 3 (‘possible cluster member’) but included in his table of background galaxies, are confirmed by FCSS as background objects.
To summarise: Ferguson did not include any of the FCSS’s UCDs within the FCC (either as ’cluster’ or ’background’ objects), presumably assuming them to be stars. Ferguson did include within the FCC all 19 of the non-compact cluster dwarfs from the FCSS: however, he mis-classified 2 of these as ‘background’ objects. Hence, the FCC contains 89 per cent of the non-compact dwarfs within the FCSS cluster sample (but only 71 per cent if one considers all dwarfs in the FCSS). However, the FCC contains a further 5 objects as ‘cluster’ members which have been shown by the FCSS to be background objects: i.e. within the FCSS’s field and selection limits, 23 per cent of those objects described as cluster members by the FCC are shown by the FCSS to be background objects. This clearly illustrates that attempts to determine cluster membership solely on the basis of observed morphology can produce significant errors: firstly because many compact galaxies will be mis-classified as stars; and secondly because many non-compact background objects will be mis-classified as cluster members and a smaller number of cluster members will be mis-classified as background objects.
5 Conclusions
We have obtained spectra for a morphologically unbiased set of cluster dwarf galaxies as part of the Fornax Cluster Spectroscopic Survey. The present paper provides the photometric study of these confirmed cluster dwarfs. We find that, despite their low luminosities, not all the dwarfs also have low surface brightness. There is therefore a wide spread of parameters in the space of surface brightness versus luminosity or scale size. The only correlation evident in these plots is the one in the luminosity–surface brightness plane caused by the absence of ‘normal’ dwarfs with scale sizes below about 300 pc. Even then, a separate class of Ultra-Compact Dwarfs fills some of this otherwise empty area of parameter space. Morphological selection of cluster dwarfs solely on the grounds of their low surface brightness may therefore overlook a significant number of dwarf galaxies which are virtually impossible to discriminate from background, larger galaxies on appearance alone.
The data presented within this paper result from the completion of only one of the intended 4 FCSS fields. We now have full data for the second field and are in the process of reducing these. The completion of all 4 fields will not only improve the statistics of our results but will also enable us to study the distribution of dwarf galaxies of different morphologies (i.e. dE, dI, UCD) as a function of position within the cluster. Such studies will be assisted by the deep CCD g,r,i,z imaging of the cluster region which we have now obtained using the 4.0-m Blanco Telescope at the Cerro Tololo Inter-American Observatory. These data are currently being reduced.
Important scientific advances could also potentially be made by improving the sensitivity of our spectroscopy to fainter luminosities and/or surface brightnesses. This can be clearly seen by studying Figs. 4 and 5. Using the CCD data we should be able to define a sample to a considerably fainter magnitude limit. The standard 2dF set-up would be adequate to obtain spectra of the higher surface brightness objects in such a sample. This would include many potential UCDs. However, even bigger advances will require us to obtain spectra for objects at fainter surface brightness limits than the present limit of 23.7 B mag arcsec-2. This possibility now exists with the commissioning of multi-object spectrographs on the new generation of 8-m telescopes.
The number of cluster objects found in Field 1 is dwarfed by the number of confirmed background objects (1175). Such a sample is potentially of great value to studies of the BBD of field galaxies. Although the present magnitude limit is only slightly lower than that of the 2dFGRS used by Cross et al. (2001) for their determination of the BBD, the FCSS background sample has the advantage that the FCSS sources were not pre-selected as galaxies. Hence, our sample will contain a fairer representation of compact objects in the background than Cross et al.’s (see Paper II). For the lower surface brightness objects in our sample we have also used longer exposure times than the 2dFGRS, so FCSS extends to fainter surface brightness than 2dFGRS. However, if the FCSS sample could be pushed to even fainter luminosity and surface brightness limits then, not only will this enable us to study the cluster BBD better, but the resulting sample will be ideal for studying the field BBD to fainter surface brightness limits than yet obtained. For example, Cross et al.’s correlation between luminosity and surface brightness has only been tested between –24–16.0 and 18.024.5. At present the FSCC is 80 per cent complete to a surface brightness about 0.5 mag fainter than this. Further improvements in the sensitivity of the spectroscopy will enable us to sample whole new regions of (,) space.
Acknowledgments
This project would not have been possible without the superb 2dF facility provided by the AAO and the generous allocations of observing time from PATT and ATAC. We wish to thank the other members of the FCSS Team: Jonathon Davies, Elaine Sadler and Quentin Parker. JBJ, PJB and JHD acknowledge support from the UK Particle Physics and Astronomy Research Council, and MJD that from the Australian Research Council. Part of this work was done at the Institute of Geophysics and Planetary Physics, under the auspices of the U.S. Department of Energy by Lawrence Livermore National Laboratory under contract No. W-7405-Eng-48. This research has made use of the NASA/IPAC Extragalactic Database (NED) which is operated by the Jet Propulsion Laboratory, Caltech, under agreement with the National Aeronautics and Space Administration.
References
- [1] Abell G.O., Corwin H.G. (Jr), Olowin R.P., 1989, ApJS, 70, 1
- [2] Arp, H., 1965, ApJ, 142, 402
- [3] Bertin E., Arnouts S., 1996, A&AS, 117, 393
- [4] Binggeli B., 1994, in Meylan G., Prigniel P., eds, Proc ESO/OHP Workshop, Dwarf Galaxies. ESO, Garching, p.13
- [5] Binggeli B., Sandage A., Tammann G.A., 1985, AJ, 90, 1681
- [6] Blanton M.R. et al., 2001, AJ, 121, 2358
- [7] Blair M., Gilmore G., 1982, PASP, 94, 742
- [8] Bothun G.D., Impey C.D., Malin D.F., Mould J.R., 1987, AJ, 94, 23
- [9] Boyce P.J., Phillipps S., 1995, A&A, 296, 26
- [10] Boyce P.J., Phillipps S., Jones J.B., Driver S.P., Smith R.M., Couch W.J., 2001, MNRAS, 328, 277
- [11] Bromley B.C., Press W.H., Lin H., Kirshner R.P., 1998, ApJ, 505, 25
- [12] Bunclark P, Irwin M.J., 1984, in Capaccioli, M., ed., Proc. IAU Colloq. 78, Astronomy with Schmidt-type Telescopes. Reidel, Dordrecht, p. 147
- [13] Caldwell, N., 1987, AJ, 94, 1116
- [14] Choliniewski J., 1985, MNRAS, 214, 197
- [15] Colless M.M. et al., 2001, MNRAS, 328, 1039
- [16] Cross N.M., Driver S.P., 2002, MNRAS, 329, 579
- [17] Cross N.M. et al., 2001, MNRAS, 324, 825
- [18] Dalcanton J.J., 1998, ApJ, 495, 251
- [19] Davies J.I., Phillipps S., Cawson M.G.M., Disney M.J., Kibblewhite E.J., 1988, MNRAS, 232, 239
- [20] Davies J.I., Phillipps S., Disney M.J., 1990, MNRAS, 244, 385
- [21] Deady J.H., 2002, PhD Thesis, Univ. Bristol
- [22] de Jong R., Lacey C., 2000, ApJ, 545, 781
- [23] De Propris R., Pritchet C.J., Harris W.E., McClure R.D., 1995, ApJ, 450, 534
- [24] de Vaucouleurs G., 1959, Handbk. Phys., 53, 120
- [25] Disney M.J., 1976, Nature, 263, 573
- [26] Drinkwater M.J., Gregg M.D., 1998 MNRAS., 296, L15
- [27] Drinkwater M.J., Phillipps S., Gregg M.D., Parker Q.A., Smith R.M., Davies J.I., Jones J.B., Sadler E.M., 1999, ApJ, 511, L97 (Paper II)
- [28] Drinkwater M.J. et al., 2000a, A&A, 355, 900 (Paper I)
- [29] Drinkwater M.J., Jones J.B., Gregg M.D., Phillipps S., 2000b, Pub. Astron. Soc. Australia, 17, 227 (Paper III)
- [30] Drinkwater M.J., Gregg M.D., Holman B.A., Brown M., 2001a, MNRAS, 326, 1076
- [31] Drinkwater M.J., Gregg M.D., Colless M.M., 2001b, ApJ, 548, 139
- [32] Driver S.P., 1999, ApJ, 526, L69
- [33] Driver S.P., Phillipps S., Davies J.I., Morgan I., Disney M.J., 1994, MNRAS, 268, 393
- [34] Driver S.P., Couch W.J., Phillipps S., Smith R.M., 1998a, MNRAS, 301, 357
- [35] Driver S.P, Couch W.J., Phillipps S., 1998b, MNRAS, 301, 369
- [36] Ferguson H.C., 1989, AJ, 98, 367 (FCC)
- [37] Ferguson H.C., Sandage A., 1988, AJ, 96, 1520
- [38] Folkes S. et. al., 1999, MNRAS, 308, 459
- [39] Garilli B., Maccagni D., Andreon S., 1999, A&A, 342, 408
- [40] Hambly N.C., Irwin M.J., MacGillivray H.T., 2001, MNRAS, 326, 1295
- [41] Hilker M., Infante L., Vieira G., Kissler-Patig M., Richtler T., 1999, A&AS, 134, 75
- [42] Hodge P.W., 1960, PASA, 72, 188
- [43] Hodge P.W., Pyper D.M., Webb C.J., 1965, AJ, 70, 559
- [44] Impey C.D., Bothun G.D., 1997, ARA&A, 35, 267
- [45] Irwin M.J., Davies J.I., Disney M.J., Phillipps S., 1990, MNRAS, 245, 289
- [46] Irwin M.J., Maddox S., McMahon R., 1994, Spectrum, 2, 14
- [47] Jacoby G.H., Hunter D.A., Christian C.A., 1984, ApJS, 56, 257
- [48] Kambas A., Davies J.I., Smith R.M., Bianchi S., Haynes J.A., 2000, AJ, 120, 1316
- [49] Kormendy J., 1985, ApJ, 295, 73
- [50] Kron R.G., 1978, PhD Thesis, Univ. California, Berkeley
- [51] Kurtz M.J., Mink D.J., 1998, PASP, 110, 934
- [52] Lin H., Yee H.K.C., Carlberg R.G., Ellingson E., 1997, ApJ, 475, 494
- [53] Lobo C., Biviano A., Durret F., Gerbal D., Le Fevre O., Mazure, A., Slezek E., 1997, A&A, 317, 385
- [54] Loveday J., Peterson B.A., Efstathiou G., Maddox S.J., 1992, ApJ, 390, 338
- [55] Marzke R.O., Da Costa L.N., Pellegrini P.S., Willmer C.N.A., Geller M.J., 1997, ApJ, 503, 617
- [56] Mayer L., Governato F., Colpi M., Moore B., Quinn T., Wadsley J., Stadel J., Lake G., 2001, ApJ, 559, 754
- [57] Mateo M., 1998, AR&A, 36, 435
- [58] Metcalfe N., Shanks T., Fong R., Roche N.,1995, MNRAS, 273, 257
- [59] Meyer M.J., Drinkwater M.J., Phillipps S., Couch W.J., 2001, MNRAS, 324, 343 (Paper IV)
- [60] Miekse S., Hilker M., Infante L., 2002, A&A, 383, 823
- [61] Moore B., Lake G., Katz N., 1998, ApJ, 495, 139
- [62] Morshidi-Esslinger Z., Davies J., Smith R., 1999, MNRAS, 304, 311
- [63] Muriel H., Valotto C.A., Lambas D.G., 1998, ApJ, 506, 540
- [64] Phillipps S., 1997, in Kontizas E., Konizas M., Morgan D.H., Vettolani G.P., eds, Proc Working Group IAU Commission 9, Wide-Field Imaging. Kluwer, Dordrecht, p. 281
- [65] Phillipps S., Parker Q.A., 1993, MNRAS, 265, 385
- [66] Phillipps S., Driver S.P., 1995, MNRAS, 274, 832
- [67] Phillipps S., Disney M.J., Kibblewhite E.J., Cawson M.G.M., 1987, MNRAS, 229, 505
- [68] Phillipps S., Davies J.I., Disney M.J., 1988, MNRAS, 233, 485
- [69] Phillipps S., Davies J.I., Disney M.J., 1990, MNRAS, 242, 235
- [70] Phillipps S., Drinkwater M.J., Gregg M.D., Jones J.B., 2001, ApJ, 560, 201 (Paper V)
- [71] Sandage A., Binggeli B., Tammann G., 1985, AJ, 90, 385
- [72] Sersic J.L., 1968, Atlas de Galaxies Australes, Observatorio Astronomico, Cordoba
- [73] Sodre L. (Jr), Lahav O., 1993, MNRAS, 260, 285
- [74] Smith R.M., Driver S.P., Phillipps S., 1997, MNRAS, 287, 415
- [75] Taylor K., Canon R.D., Parker Q.A., 1998, in McLean B.J., Golombek D.A., Hayes J.J.E., Payne H.E., eds, Proc. IAUS 179, New Horizons from Multi-Wavelength Sky Surveys. Kluwer, Dordrecht, p.135
- [76] Tonry J.L., Davis M., 1979, AJ, 84, 1511
- [77] Trentham N., 1997a, MNRAS, 286, 133
- [78] Trentham N., 1997b, MNRAS, 290, 334
- [79] Trentham N., 1998, MNRAS, 295, 360
- [80] Trentham N., Hodgkin S., 2002, MNRAS, 333, 423
- [81] Valotto C.A., Nicotra M.A., Muriel H., Lambas D.G., 1997, ApJ, 479, 90
- [82] van der Kruit P., 1987, A&A, 173, 59
- [83] Wilson G., Smail I., Ellis R.S., Couch W.J., 1997, MNRAS, 284, 915
- [84] Zucca E. et al., 1997, A&A, 326, 477